Microsoft Planetary Computer Sentinel-1 RTC Imagery#
This book will demonstrate how to access radiometrically terrain corrected Sentinel-1 imagery from Microsoft Planetary Computer using stackstac. STAC stands for spatio-temporal asset catalog, it is a common framework to describe geospatial information and a way for data providers, developers and users to work and communicate efficiently. You can read more about STAC here and checkout more useful tutorials for working with STAC data.
Learning goals#
Xarray and python techniques:
Introduction to working with STAC data
Using
pystacto query cloud-hosted datasets, observe metadataUsing
stackstacto read cloud-hosted data as xarray objectsUsing
xarrayto manipulate and organize Sentinel-1 SAR dataPerforming grouping and reductions on
xarrrayobjectsVisualizing
xarrayobjects usingFacetGrid
High-level science goals:
Querying large cloud-hosted dataset
Accessing cloud-hosted data stored as COGs (cloud-optimized GeoTIFFs)
Extracting and organizing metadata
Other useful resources#
These are resources that contain additional examples and discussion of the content in this notebook and more.
How do I… this is very helpful!
Xarray High-level computational patterns discussion of concepts and associated code examples
Parallel computing with dask Xarray tutorial demonstrating wrapping of dask arrays
%xmode minimal
import xarray as xr
import geopandas as gpd
import matplotlib.pyplot as plt
import numpy as np
import pandas as pd
import requests
import rich.table
import planetary_computer
from pystac_client import Client
from shapely.geometry import Polygon
import rioxarray as rio
import pystac
from IPython.display import Image
We will use the pystac_client package to interact with and query the Microsoft Planetary Computer Sentinel-1 RTC dataset. In the cell below, we will create an object called catalog by calling the .open() method of the Client class. This is establishing a connection with the hosted data at the url provided. Explore the catalog object. You
STAC items#
catalog = Client.open('https://planetarycomputer.microsoft.com/api/stac/v1')
catalog
- type "Catalog"
- id "microsoft-pc"
- stac_version "1.0.0"
- description "Searchable spatiotemporal metadata describing Earth science datasets hosted by the Microsoft Planetary Computer"
links [] 130 items
0
- rel "self"
- href "https://planetarycomputer.microsoft.com/api/stac/v1"
- type "application/json"
1
- rel "root"
- href "https://planetarycomputer.microsoft.com/api/stac/v1/"
- type "application/json"
2
- rel "data"
- href "https://planetarycomputer.microsoft.com/api/stac/v1/collections"
- type "application/json"
3
- rel "conformance"
- href "https://planetarycomputer.microsoft.com/api/stac/v1/conformance"
- type "application/json"
- title "STAC/WFS3 conformance classes implemented by this server"
4
- rel "search"
- href "https://planetarycomputer.microsoft.com/api/stac/v1/search"
- type "application/geo+json"
- title "STAC search"
- method "GET"
5
- rel "search"
- href "https://planetarycomputer.microsoft.com/api/stac/v1/search"
- type "application/geo+json"
- title "STAC search"
- method "POST"
6
- rel "child"
- href "https://planetarycomputer.microsoft.com/api/stac/v1/collections/daymet-annual-pr"
- type "application/json"
- title "Daymet Annual Puerto Rico"
7
- rel "child"
- href "https://planetarycomputer.microsoft.com/api/stac/v1/collections/daymet-daily-hi"
- type "application/json"
- title "Daymet Daily Hawaii"
8
- rel "child"
- href "https://planetarycomputer.microsoft.com/api/stac/v1/collections/3dep-seamless"
- type "application/json"
- title "USGS 3DEP Seamless DEMs"
9
- rel "child"
- href "https://planetarycomputer.microsoft.com/api/stac/v1/collections/3dep-lidar-dsm"
- type "application/json"
- title "USGS 3DEP Lidar Digital Surface Model"
10
- rel "child"
- href "https://planetarycomputer.microsoft.com/api/stac/v1/collections/fia"
- type "application/json"
- title "Forest Inventory and Analysis"
11
- rel "child"
- href "https://planetarycomputer.microsoft.com/api/stac/v1/collections/sentinel-1-rtc"
- type "application/json"
- title "Sentinel 1 Radiometrically Terrain Corrected (RTC)"
12
- rel "child"
- href "https://planetarycomputer.microsoft.com/api/stac/v1/collections/gridmet"
- type "application/json"
- title "gridMET"
13
- rel "child"
- href "https://planetarycomputer.microsoft.com/api/stac/v1/collections/daymet-annual-na"
- type "application/json"
- title "Daymet Annual North America"
14
- rel "child"
- href "https://planetarycomputer.microsoft.com/api/stac/v1/collections/daymet-monthly-na"
- type "application/json"
- title "Daymet Monthly North America"
15
- rel "child"
- href "https://planetarycomputer.microsoft.com/api/stac/v1/collections/daymet-annual-hi"
- type "application/json"
- title "Daymet Annual Hawaii"
16
- rel "child"
- href "https://planetarycomputer.microsoft.com/api/stac/v1/collections/daymet-monthly-hi"
- type "application/json"
- title "Daymet Monthly Hawaii"
17
- rel "child"
- href "https://planetarycomputer.microsoft.com/api/stac/v1/collections/daymet-monthly-pr"
- type "application/json"
- title "Daymet Monthly Puerto Rico"
18
- rel "child"
- href "https://planetarycomputer.microsoft.com/api/stac/v1/collections/gnatsgo-tables"
- type "application/json"
- title "gNATSGO Soil Database - Tables"
19
- rel "child"
- href "https://planetarycomputer.microsoft.com/api/stac/v1/collections/hgb"
- type "application/json"
- title "HGB: Harmonized Global Biomass for 2010"
20
- rel "child"
- href "https://planetarycomputer.microsoft.com/api/stac/v1/collections/cop-dem-glo-30"
- type "application/json"
- title "Copernicus DEM GLO-30"
21
- rel "child"
- href "https://planetarycomputer.microsoft.com/api/stac/v1/collections/cop-dem-glo-90"
- type "application/json"
- title "Copernicus DEM GLO-90"
22
- rel "child"
- href "https://planetarycomputer.microsoft.com/api/stac/v1/collections/goes-cmi"
- type "application/json"
- title "GOES-R Cloud & Moisture Imagery"
23
- rel "child"
- href "https://planetarycomputer.microsoft.com/api/stac/v1/collections/terraclimate"
- type "application/json"
- title "TerraClimate"
24
- rel "child"
- href "https://planetarycomputer.microsoft.com/api/stac/v1/collections/nasa-nex-gddp-cmip6"
- type "application/json"
- title "Earth Exchange Global Daily Downscaled Projections (NEX-GDDP-CMIP6)"
25
- rel "child"
- href "https://planetarycomputer.microsoft.com/api/stac/v1/collections/gpm-imerg-hhr"
- type "application/json"
- title "GPM IMERG"
26
- rel "child"
- href "https://planetarycomputer.microsoft.com/api/stac/v1/collections/gnatsgo-rasters"
- type "application/json"
- title "gNATSGO Soil Database - Rasters"
27
- rel "child"
- href "https://planetarycomputer.microsoft.com/api/stac/v1/collections/3dep-lidar-hag"
- type "application/json"
- title "USGS 3DEP Lidar Height above Ground"
28
- rel "child"
- href "https://planetarycomputer.microsoft.com/api/stac/v1/collections/3dep-lidar-intensity"
- type "application/json"
- title "USGS 3DEP Lidar Intensity"
29
- rel "child"
- href "https://planetarycomputer.microsoft.com/api/stac/v1/collections/3dep-lidar-pointsourceid"
- type "application/json"
- title "USGS 3DEP Lidar Point Source"
30
- rel "child"
- href "https://planetarycomputer.microsoft.com/api/stac/v1/collections/mtbs"
- type "application/json"
- title "MTBS: Monitoring Trends in Burn Severity"
31
- rel "child"
- href "https://planetarycomputer.microsoft.com/api/stac/v1/collections/noaa-c-cap"
- type "application/json"
- title "C-CAP Regional Land Cover and Change"
32
- rel "child"
- href "https://planetarycomputer.microsoft.com/api/stac/v1/collections/3dep-lidar-copc"
- type "application/json"
- title "USGS 3DEP Lidar Point Cloud"
33
- rel "child"
- href "https://planetarycomputer.microsoft.com/api/stac/v1/collections/modis-64A1-061"
- type "application/json"
- title "MODIS Burned Area Monthly"
34
- rel "child"
- href "https://planetarycomputer.microsoft.com/api/stac/v1/collections/alos-fnf-mosaic"
- type "application/json"
- title "ALOS Forest/Non-Forest Annual Mosaic"
35
- rel "child"
- href "https://planetarycomputer.microsoft.com/api/stac/v1/collections/3dep-lidar-returns"
- type "application/json"
- title "USGS 3DEP Lidar Returns"
36
- rel "child"
- href "https://planetarycomputer.microsoft.com/api/stac/v1/collections/mobi"
- type "application/json"
- title "MoBI: Map of Biodiversity Importance"
37
- rel "child"
- href "https://planetarycomputer.microsoft.com/api/stac/v1/collections/landsat-c2-l2"
- type "application/json"
- title "Landsat Collection 2 Level-2"
38
- rel "child"
- href "https://planetarycomputer.microsoft.com/api/stac/v1/collections/era5-pds"
- type "application/json"
- title "ERA5 - PDS"
39
- rel "child"
- href "https://planetarycomputer.microsoft.com/api/stac/v1/collections/chloris-biomass"
- type "application/json"
- title "Chloris Biomass"
40
- rel "child"
- href "https://planetarycomputer.microsoft.com/api/stac/v1/collections/kaza-hydroforecast"
- type "application/json"
- title "HydroForecast - Kwando & Upper Zambezi Rivers"
41
- rel "child"
- href "https://planetarycomputer.microsoft.com/api/stac/v1/collections/planet-nicfi-analytic"
- type "application/json"
- title "Planet-NICFI Basemaps (Analytic)"
42
- rel "child"
- href "https://planetarycomputer.microsoft.com/api/stac/v1/collections/modis-17A2H-061"
- type "application/json"
- title "MODIS Gross Primary Productivity 8-Day"
43
- rel "child"
- href "https://planetarycomputer.microsoft.com/api/stac/v1/collections/modis-11A2-061"
- type "application/json"
- title "MODIS Land Surface Temperature/Emissivity 8-Day"
44
- rel "child"
- href "https://planetarycomputer.microsoft.com/api/stac/v1/collections/daymet-daily-pr"
- type "application/json"
- title "Daymet Daily Puerto Rico"
45
- rel "child"
- href "https://planetarycomputer.microsoft.com/api/stac/v1/collections/3dep-lidar-dtm-native"
- type "application/json"
- title "USGS 3DEP Lidar Digital Terrain Model (Native)"
46
- rel "child"
- href "https://planetarycomputer.microsoft.com/api/stac/v1/collections/3dep-lidar-classification"
- type "application/json"
- title "USGS 3DEP Lidar Classification"
47
- rel "child"
- href "https://planetarycomputer.microsoft.com/api/stac/v1/collections/3dep-lidar-dtm"
- type "application/json"
- title "USGS 3DEP Lidar Digital Terrain Model"
48
- rel "child"
- href "https://planetarycomputer.microsoft.com/api/stac/v1/collections/gap"
- type "application/json"
- title "USGS Gap Land Cover"
49
- rel "child"
- href "https://planetarycomputer.microsoft.com/api/stac/v1/collections/modis-17A2HGF-061"
- type "application/json"
- title "MODIS Gross Primary Productivity 8-Day Gap-Filled"
50
- rel "child"
- href "https://planetarycomputer.microsoft.com/api/stac/v1/collections/planet-nicfi-visual"
- type "application/json"
- title "Planet-NICFI Basemaps (Visual)"
51
- rel "child"
- href "https://planetarycomputer.microsoft.com/api/stac/v1/collections/gbif"
- type "application/json"
- title "Global Biodiversity Information Facility (GBIF)"
52
- rel "child"
- href "https://planetarycomputer.microsoft.com/api/stac/v1/collections/modis-17A3HGF-061"
- type "application/json"
- title "MODIS Net Primary Production Yearly Gap-Filled"
53
- rel "child"
- href "https://planetarycomputer.microsoft.com/api/stac/v1/collections/modis-09A1-061"
- type "application/json"
- title "MODIS Surface Reflectance 8-Day (500m)"
54
- rel "child"
- href "https://planetarycomputer.microsoft.com/api/stac/v1/collections/alos-dem"
- type "application/json"
- title "ALOS World 3D-30m"
55
- rel "child"
- href "https://planetarycomputer.microsoft.com/api/stac/v1/collections/alos-palsar-mosaic"
- type "application/json"
- title "ALOS PALSAR Annual Mosaic"
56
- rel "child"
- href "https://planetarycomputer.microsoft.com/api/stac/v1/collections/deltares-water-availability"
- type "application/json"
- title "Deltares Global Water Availability"
57
- rel "child"
- href "https://planetarycomputer.microsoft.com/api/stac/v1/collections/modis-16A3GF-061"
- type "application/json"
- title "MODIS Net Evapotranspiration Yearly Gap-Filled"
58
- rel "child"
- href "https://planetarycomputer.microsoft.com/api/stac/v1/collections/modis-21A2-061"
- type "application/json"
- title "MODIS Land Surface Temperature/3-Band Emissivity 8-Day"
59
- rel "child"
- href "https://planetarycomputer.microsoft.com/api/stac/v1/collections/us-census"
- type "application/json"
- title "US Census"
60
- rel "child"
- href "https://planetarycomputer.microsoft.com/api/stac/v1/collections/jrc-gsw"
- type "application/json"
- title "JRC Global Surface Water"
61
- rel "child"
- href "https://planetarycomputer.microsoft.com/api/stac/v1/collections/deltares-floods"
- type "application/json"
- title "Deltares Global Flood Maps"
62
- rel "child"
- href "https://planetarycomputer.microsoft.com/api/stac/v1/collections/modis-43A4-061"
- type "application/json"
- title "MODIS Nadir BRDF-Adjusted Reflectance (NBAR) Daily"
63
- rel "child"
- href "https://planetarycomputer.microsoft.com/api/stac/v1/collections/modis-09Q1-061"
- type "application/json"
- title "MODIS Surface Reflectance 8-Day (250m)"
64
- rel "child"
- href "https://planetarycomputer.microsoft.com/api/stac/v1/collections/modis-14A1-061"
- type "application/json"
- title "MODIS Thermal Anomalies/Fire Daily"
65
- rel "child"
- href "https://planetarycomputer.microsoft.com/api/stac/v1/collections/hrea"
- type "application/json"
- title "HREA: High Resolution Electricity Access"
66
- rel "child"
- href "https://planetarycomputer.microsoft.com/api/stac/v1/collections/modis-13Q1-061"
- type "application/json"
- title "MODIS Vegetation Indices 16-Day (250m)"
67
- rel "child"
- href "https://planetarycomputer.microsoft.com/api/stac/v1/collections/modis-14A2-061"
- type "application/json"
- title "MODIS Thermal Anomalies/Fire 8-Day"
68
- rel "child"
- href "https://planetarycomputer.microsoft.com/api/stac/v1/collections/sentinel-2-l2a"
- type "application/json"
- title "Sentinel-2 Level-2A"
69
- rel "child"
- href "https://planetarycomputer.microsoft.com/api/stac/v1/collections/modis-15A2H-061"
- type "application/json"
- title "MODIS Leaf Area Index/FPAR 8-Day"
70
- rel "child"
- href "https://planetarycomputer.microsoft.com/api/stac/v1/collections/modis-11A1-061"
- type "application/json"
- title "MODIS Land Surface Temperature/Emissivity Daily"
71
- rel "child"
- href "https://planetarycomputer.microsoft.com/api/stac/v1/collections/modis-15A3H-061"
- type "application/json"
- title "MODIS Leaf Area Index/FPAR 4-Day"
72
- rel "child"
- href "https://planetarycomputer.microsoft.com/api/stac/v1/collections/modis-13A1-061"
- type "application/json"
- title "MODIS Vegetation Indices 16-Day (500m)"
73
- rel "child"
- href "https://planetarycomputer.microsoft.com/api/stac/v1/collections/daymet-daily-na"
- type "application/json"
- title "Daymet Daily North America"
74
- rel "child"
- href "https://planetarycomputer.microsoft.com/api/stac/v1/collections/nrcan-landcover"
- type "application/json"
- title "Land Cover of Canada"
75
- rel "child"
- href "https://planetarycomputer.microsoft.com/api/stac/v1/collections/modis-10A2-061"
- type "application/json"
- title "MODIS Snow Cover 8-day"
76
- rel "child"
- href "https://planetarycomputer.microsoft.com/api/stac/v1/collections/ecmwf-forecast"
- type "application/json"
- title "ECMWF Open Data (real-time)"
77
- rel "child"
- href "https://planetarycomputer.microsoft.com/api/stac/v1/collections/noaa-mrms-qpe-24h-pass2"
- type "application/json"
- title "NOAA MRMS QPE 24-Hour Pass 2"
78
- rel "child"
- href "https://planetarycomputer.microsoft.com/api/stac/v1/collections/sentinel-1-grd"
- type "application/json"
- title "Sentinel 1 Level-1 Ground Range Detected (GRD)"
79
- rel "child"
- href "https://planetarycomputer.microsoft.com/api/stac/v1/collections/nasadem"
- type "application/json"
- title "NASADEM HGT v001"
80
- rel "child"
- href "https://planetarycomputer.microsoft.com/api/stac/v1/collections/io-lulc"
- type "application/json"
- title "Esri 10-Meter Land Cover (10-class)"
81
- rel "child"
- href "https://planetarycomputer.microsoft.com/api/stac/v1/collections/landsat-c2-l1"
- type "application/json"
- title "Landsat Collection 2 Level-1"
82
- rel "child"
- href "https://planetarycomputer.microsoft.com/api/stac/v1/collections/drcog-lulc"
- type "application/json"
- title "Denver Regional Council of Governments Land Use Land Cover"
83
- rel "child"
- href "https://planetarycomputer.microsoft.com/api/stac/v1/collections/chesapeake-lc-7"
- type "application/json"
- title "Chesapeake Land Cover (7-class)"
84
- rel "child"
- href "https://planetarycomputer.microsoft.com/api/stac/v1/collections/chesapeake-lc-13"
- type "application/json"
- title "Chesapeake Land Cover (13-class)"
85
- rel "child"
- href "https://planetarycomputer.microsoft.com/api/stac/v1/collections/chesapeake-lu"
- type "application/json"
- title "Chesapeake Land Use"
86
- rel "child"
- href "https://planetarycomputer.microsoft.com/api/stac/v1/collections/noaa-mrms-qpe-1h-pass1"
- type "application/json"
- title "NOAA MRMS QPE 1-Hour Pass 1"
87
- rel "child"
- href "https://planetarycomputer.microsoft.com/api/stac/v1/collections/noaa-mrms-qpe-1h-pass2"
- type "application/json"
- title "NOAA MRMS QPE 1-Hour Pass 2"
88
- rel "child"
- href "https://planetarycomputer.microsoft.com/api/stac/v1/collections/noaa-nclimgrid-monthly"
- type "application/json"
- title "Monthly NOAA U.S. Climate Gridded Dataset (NClimGrid)"
89
- rel "child"
- href "https://planetarycomputer.microsoft.com/api/stac/v1/collections/goes-glm"
- type "application/json"
- title "GOES-R Lightning Detection"
90
- rel "child"
- href "https://planetarycomputer.microsoft.com/api/stac/v1/collections/usda-cdl"
- type "application/json"
- title "USDA Cropland Data Layers (CDLs)"
91
- rel "child"
- href "https://planetarycomputer.microsoft.com/api/stac/v1/collections/eclipse"
- type "application/json"
- title "Urban Innovation Eclipse Sensor Data"
92
- rel "child"
- href "https://planetarycomputer.microsoft.com/api/stac/v1/collections/esa-cci-lc"
- type "application/json"
- title "ESA Climate Change Initiative Land Cover Maps (Cloud Optimized GeoTIFF)"
93
- rel "child"
- href "https://planetarycomputer.microsoft.com/api/stac/v1/collections/esa-cci-lc-netcdf"
- type "application/json"
- title "ESA Climate Change Initiative Land Cover Maps (NetCDF)"
94
- rel "child"
- href "https://planetarycomputer.microsoft.com/api/stac/v1/collections/fws-nwi"
- type "application/json"
- title "FWS National Wetlands Inventory"
95
- rel "child"
- href "https://planetarycomputer.microsoft.com/api/stac/v1/collections/usgs-lcmap-conus-v13"
- type "application/json"
- title "USGS LCMAP CONUS Collection 1.3"
96
- rel "child"
- href "https://planetarycomputer.microsoft.com/api/stac/v1/collections/usgs-lcmap-hawaii-v10"
- type "application/json"
- title "USGS LCMAP Hawaii Collection 1.0"
97
- rel "child"
- href "https://planetarycomputer.microsoft.com/api/stac/v1/collections/noaa-climate-normals-tabular"
- type "application/json"
- title "NOAA US Tabular Climate Normals"
98
- rel "child"
- href "https://planetarycomputer.microsoft.com/api/stac/v1/collections/noaa-climate-normals-netcdf"
- type "application/json"
- title "NOAA US Gridded Climate Normals (NetCDF)"
99
- rel "child"
- href "https://planetarycomputer.microsoft.com/api/stac/v1/collections/noaa-climate-normals-gridded"
- type "application/json"
- title "NOAA US Gridded Climate Normals (Cloud-Optimized GeoTIFF)"
100
- rel "child"
- href "https://planetarycomputer.microsoft.com/api/stac/v1/collections/aster-l1t"
- type "application/json"
- title "ASTER L1T"
101
- rel "child"
- href "https://planetarycomputer.microsoft.com/api/stac/v1/collections/cil-gdpcir-cc-by-sa"
- type "application/json"
- title "CIL Global Downscaled Projections for Climate Impacts Research (CC-BY-SA-4.0)"
102
- rel "child"
- href "https://planetarycomputer.microsoft.com/api/stac/v1/collections/io-lulc-9-class"
- type "application/json"
- title "10m Annual Land Use Land Cover (9-class)"
103
- rel "child"
- href "https://planetarycomputer.microsoft.com/api/stac/v1/collections/io-biodiversity"
- type "application/json"
- title "Biodiversity Intactness"
104
- rel "child"
- href "https://planetarycomputer.microsoft.com/api/stac/v1/collections/naip"
- type "application/json"
- title "NAIP: National Agriculture Imagery Program"
105
- rel "child"
- href "https://planetarycomputer.microsoft.com/api/stac/v1/collections/noaa-cdr-sea-surface-temperature-whoi"
- type "application/json"
- title "Sea Surface Temperature - WHOI CDR"
106
- rel "child"
- href "https://planetarycomputer.microsoft.com/api/stac/v1/collections/noaa-cdr-ocean-heat-content"
- type "application/json"
- title "Global Ocean Heat Content CDR"
107
- rel "child"
- href "https://planetarycomputer.microsoft.com/api/stac/v1/collections/cil-gdpcir-cc0"
- type "application/json"
- title "CIL Global Downscaled Projections for Climate Impacts Research (CC0-1.0)"
108
- rel "child"
- href "https://planetarycomputer.microsoft.com/api/stac/v1/collections/cil-gdpcir-cc-by"
- type "application/json"
- title "CIL Global Downscaled Projections for Climate Impacts Research (CC-BY-4.0)"
109
- rel "child"
- href "https://planetarycomputer.microsoft.com/api/stac/v1/collections/noaa-cdr-sea-surface-temperature-whoi-netcdf"
- type "application/json"
- title "Sea Surface Temperature - WHOI CDR NetCDFs"
110
- rel "child"
- href "https://planetarycomputer.microsoft.com/api/stac/v1/collections/noaa-cdr-sea-surface-temperature-optimum-interpolation"
- type "application/json"
- title "Sea Surface Temperature - Optimum Interpolation CDR"
111
- rel "child"
- href "https://planetarycomputer.microsoft.com/api/stac/v1/collections/modis-10A1-061"
- type "application/json"
- title "MODIS Snow Cover Daily"
112
- rel "child"
- href "https://planetarycomputer.microsoft.com/api/stac/v1/collections/sentinel-5p-l2-netcdf"
- type "application/json"
- title "Sentinel-5P Level-2"
113
- rel "child"
- href "https://planetarycomputer.microsoft.com/api/stac/v1/collections/sentinel-3-olci-wfr-l2-netcdf"
- type "application/json"
- title "Sentinel-3 Water (Full Resolution)"
114
- rel "child"
- href "https://planetarycomputer.microsoft.com/api/stac/v1/collections/noaa-cdr-ocean-heat-content-netcdf"
- type "application/json"
- title "Global Ocean Heat Content CDR NetCDFs"
115
- rel "child"
- href "https://planetarycomputer.microsoft.com/api/stac/v1/collections/sentinel-3-synergy-aod-l2-netcdf"
- type "application/json"
- title "Sentinel-3 Global Aerosol"
116
- rel "child"
- href "https://planetarycomputer.microsoft.com/api/stac/v1/collections/sentinel-3-synergy-v10-l2-netcdf"
- type "application/json"
- title "Sentinel-3 10-Day Surface Reflectance and NDVI (SPOT VEGETATION)"
117
- rel "child"
- href "https://planetarycomputer.microsoft.com/api/stac/v1/collections/sentinel-3-olci-lfr-l2-netcdf"
- type "application/json"
- title "Sentinel-3 Land (Full Resolution)"
118
- rel "child"
- href "https://planetarycomputer.microsoft.com/api/stac/v1/collections/sentinel-3-sral-lan-l2-netcdf"
- type "application/json"
- title "Sentinel-3 Land Radar Altimetry"
119
- rel "child"
- href "https://planetarycomputer.microsoft.com/api/stac/v1/collections/sentinel-3-slstr-lst-l2-netcdf"
- type "application/json"
- title "Sentinel-3 Land Surface Temperature"
120
- rel "child"
- href "https://planetarycomputer.microsoft.com/api/stac/v1/collections/sentinel-3-slstr-wst-l2-netcdf"
- type "application/json"
- title "Sentinel-3 Sea Surface Temperature"
121
- rel "child"
- href "https://planetarycomputer.microsoft.com/api/stac/v1/collections/sentinel-3-sral-wat-l2-netcdf"
- type "application/json"
- title "Sentinel-3 Ocean Radar Altimetry"
122
- rel "child"
- href "https://planetarycomputer.microsoft.com/api/stac/v1/collections/ms-buildings"
- type "application/json"
- title "Microsoft Building Footprints"
123
- rel "child"
- href "https://planetarycomputer.microsoft.com/api/stac/v1/collections/sentinel-3-slstr-frp-l2-netcdf"
- type "application/json"
- title "Sentinel-3 Fire Radiative Power"
124
- rel "child"
- href "https://planetarycomputer.microsoft.com/api/stac/v1/collections/sentinel-3-synergy-syn-l2-netcdf"
- type "application/json"
- title "Sentinel-3 Land Surface Reflectance and Aerosol"
125
- rel "child"
- href "https://planetarycomputer.microsoft.com/api/stac/v1/collections/sentinel-3-synergy-vgp-l2-netcdf"
- type "application/json"
- title "Sentinel-3 Top of Atmosphere Reflectance (SPOT VEGETATION)"
126
- rel "child"
- href "https://planetarycomputer.microsoft.com/api/stac/v1/collections/sentinel-3-synergy-vg1-l2-netcdf"
- type "application/json"
- title "Sentinel-3 1-Day Surface Reflectance and NDVI (SPOT VEGETATION)"
127
- rel "child"
- href "https://planetarycomputer.microsoft.com/api/stac/v1/collections/esa-worldcover"
- type "application/json"
- title "ESA WorldCover"
128
- rel "service-desc"
- href "https://planetarycomputer.microsoft.com/api/stac/v1/openapi.json"
- type "application/vnd.oai.openapi+json;version=3.0"
- title "OpenAPI service description"
129
- rel "service-doc"
- href "https://planetarycomputer.microsoft.com/api/stac/v1/docs"
- type "text/html"
- title "OpenAPI service documentation"
conformsTo [] 15 items
- 0 "http://www.opengis.net/spec/cql2/1.0/conf/basic-cql2"
- 1 "http://www.opengis.net/spec/cql2/1.0/conf/cql2-json"
- 2 "http://www.opengis.net/spec/cql2/1.0/conf/cql2-text"
- 3 "http://www.opengis.net/spec/ogcapi-features-1/1.0/conf/core"
- 4 "http://www.opengis.net/spec/ogcapi-features-1/1.0/conf/geojson"
- 5 "http://www.opengis.net/spec/ogcapi-features-1/1.0/conf/oas30"
- 6 "http://www.opengis.net/spec/ogcapi-features-3/1.0/conf/filter"
- 7 "https://api.stacspec.org/v1.0.0-rc.1/collections"
- 8 "https://api.stacspec.org/v1.0.0-rc.1/core"
- 9 "https://api.stacspec.org/v1.0.0-rc.1/item-search"
- 10 "https://api.stacspec.org/v1.0.0-rc.1/item-search#fields"
- 11 "https://api.stacspec.org/v1.0.0-rc.1/item-search#filter"
- 12 "https://api.stacspec.org/v1.0.0-rc.1/item-search#query"
- 13 "https://api.stacspec.org/v1.0.0-rc.1/item-search#sort"
- 14 "https://api.stacspec.org/v1.0.0-rc.1/ogcapi-features"
- title "Microsoft Planetary Computer STAC API"
Now we will define some parameters to help us query the data catalog for the specific collection, time range and geographic area of interest.
The function points2coords() just helps us to format coordinates for areas of interest.
#we'll use this function to get bounding box coordinates from a list of points
def points2coords(pt_ls): #should be [xmin, ymin, xmax, ymax]
coords_ls = [(pt_ls[0], pt_ls[1]), (pt_ls[0], pt_ls[3]),
(pt_ls[2], pt_ls[3]), (pt_ls[2], pt_ls[1]),
(pt_ls[0], pt_ls[1])]
return coords_ls
In the cell below we specify the time range we’re interested in as well as the geographic area of interest.
time_range = '2021-01-01/2022-08-01'
bbox = [88.214935, 27.92767, 88.302, 28.034]
bbox_coords = points2coords(bbox)
bbox_coords
[(88.214935, 27.92767),
(88.214935, 28.034),
(88.302, 28.034),
(88.302, 27.92767),
(88.214935, 27.92767)]
Now we will search the catalog for entries that match our criteria for collection (Sentinel-1 RTC), bbox (our AOI) and datetime (our specified time range):
search = catalog.search(collections=["sentinel-1-rtc"], bbox=bbox, datetime=time_range)
items = search.get_all_items()
len(items)
/home/emmamarshall/miniconda3/envs/s1rtc/lib/python3.10/site-packages/pystac_client/item_search.py:850: FutureWarning: get_all_items() is deprecated, use item_collection() instead.
warnings.warn(
143
We’ve created a few more instances of pystac_client classes. Check out the object types below to better familiarize yourself with the pystac package
print(type(catalog))
print(type(search))
print(type(items))
<class 'pystac_client.client.Client'>
<class 'pystac_client.item_search.ItemSearch'>
<class 'pystac.item_collection.ItemCollection'>
You can see that items is an instance of the class ItemCollection, and we can explore it via the embedded html interface.
items
- type "FeatureCollection"
features [] 143 items
0
- type "Feature"
- stac_version "1.0.0"
- id "S1A_IW_GRDH_1SDV_20220801T121402_20220801T121427_044359_054B39_rtc"
properties
- datetime "2022-08-01T12:14:14.610123Z"
- platform "SENTINEL-1A"
s1:shape [] 2 items
- 0 28151
- 1 21598
proj:bbox [] 4 items
- 0 421830.0
- 1 2916240.0
- 2 703340.0
- 3 3132220.0
- proj:epsg 32645
proj:shape [] 2 items
- 0 21598
- 1 28151
- end_datetime "2022-08-01 12:14:27.109058+00:00"
- constellation "Sentinel-1"
- s1:resolution "high"
proj:transform [] 9 items
- 0 10.0
- 1 0.0
- 2 421830.0
- 3 0.0
- 4 -10.0
- 5 3132220.0
- 6 0.0
- 7 0.0
- 8 1.0
- s1:datatake_id "346937"
- start_datetime "2022-08-01 12:14:02.111187+00:00"
- s1:orbit_source "RESORB"
- s1:slice_number "6"
- s1:total_slices "20"
- sar:looks_range 5
- sat:orbit_state "ascending"
- sar:product_type "GRD"
- sar:looks_azimuth 1
sar:polarizations [] 2 items
- 0 "VV"
- 1 "VH"
- sar:frequency_band "C"
- sat:absolute_orbit 44359
- sat:relative_orbit 12
- s1:processing_level "1"
- sar:instrument_mode "IW"
- sar:center_frequency 5.405
- sar:resolution_range 20
- s1:product_timeliness "Fast-24h"
- sar:resolution_azimuth 22
- sar:pixel_spacing_range 10
- sar:observation_direction "right"
- sar:pixel_spacing_azimuth 10
- sar:looks_equivalent_number 4.4
- s1:instrument_configuration_ID "7"
- sat:platform_international_designator "2014-016A"
geometry
- type "Polygon"
coordinates [] 1 items
0 [] 15 items
0 [] 2 items
- 0 86.2061172
- 1 27.844139
1 [] 2 items
- 0 86.2101121
- 1 27.7832745
2 [] 2 items
- 0 86.2347885
- 1 27.7815176
3 [] 2 items
- 0 86.2165994
- 1 27.7561398
4 [] 2 items
- 0 86.2711759
- 1 27.6975806
5 [] 2 items
- 0 86.277775
- 1 27.4645268
6 [] 2 items
- 0 86.3275919
- 1 27.3771174
7 [] 2 items
- 0 86.3188758
- 1 27.2312756
8 [] 2 items
- 0 86.3555363
- 1 27.1611209
9 [] 2 items
- 0 86.4991766
- 1 26.3666859
10 [] 2 items
- 0 88.9846704
- 1 26.7769876
11 [] 2 items
- 0 88.9224408
- 1 27.3277712
12 [] 2 items
- 0 88.7383568
- 1 28.2896054
13 [] 2 items
- 0 86.2107705
- 1 27.881718
14 [] 2 items
- 0 86.2061172
- 1 27.844139
links [] 7 items
0
- rel "collection"
- href "https://planetarycomputer.microsoft.com/api/stac/v1/collections/sentinel-1-rtc"
- type "application/json"
1
- rel "parent"
- href "https://planetarycomputer.microsoft.com/api/stac/v1/collections/sentinel-1-rtc"
- type "application/json"
2
- rel "root"
- href "https://planetarycomputer.microsoft.com/api/stac/v1"
- type "application/json"
- title "Microsoft Planetary Computer STAC API"
3
- rel "self"
- href "https://planetarycomputer.microsoft.com/api/stac/v1/collections/sentinel-1-rtc/items/S1A_IW_GRDH_1SDV_20220801T121402_20220801T121427_044359_054B39_rtc"
- type "application/geo+json"
4
- rel "license"
- href "https://sentinel.esa.int/documents/247904/690755/Sentinel_Data_Legal_Notice"
5
- rel "derived_from"
- href "https://planetarycomputer.microsoft.com/api/stac/v1/collections/sentinel-1-grd/items/S1A_IW_GRDH_1SDV_20220801T121402_20220801T121427_044359_054B39"
- type "application/json"
- title "Sentinel 1 GRD Item"
6
- rel "preview"
- href "https://planetarycomputer.microsoft.com/api/data/v1/item/map?collection=sentinel-1-rtc&item=S1A_IW_GRDH_1SDV_20220801T121402_20220801T121427_044359_054B39_rtc"
- type "text/html"
- title "Map of item"
assets
vh
- href "https://sentinel1euwestrtc.blob.core.windows.net/sentinel1-grd-rtc/GRD/2022/8/1/IW/DV/S1A_IW_GRDH_1SDV_20220801T121402_20220801T121427_044359_054B39_E902/measurement/iw-vh.rtc.tiff"
- type "image/tiff; application=geotiff; profile=cloud-optimized"
- title "VH: vertical transmit, horizontal receive"
- description "Terrain-corrected gamma naught values of signal transmitted with vertical polarization and received with horizontal polarization with radiometric terrain correction applied."
- file:size 1864400774
- file:checksum "60989fa489c1ebf4ea27de1d3c560450"
raster:bands [] 1 items
0
- nodata -32768
- data_type "float32"
- spatial_resolution 10.0
roles [] 1 items
- 0 "data"
vv
- href "https://sentinel1euwestrtc.blob.core.windows.net/sentinel1-grd-rtc/GRD/2022/8/1/IW/DV/S1A_IW_GRDH_1SDV_20220801T121402_20220801T121427_044359_054B39_E902/measurement/iw-vv.rtc.tiff"
- type "image/tiff; application=geotiff; profile=cloud-optimized"
- title "VV: vertical transmit, vertical receive"
- description "Terrain-corrected gamma naught values of signal transmitted with vertical polarization and received with vertical polarization with radiometric terrain correction applied."
- file:size 1874779451
- file:checksum "8f4244723d81c5cacb5045f13aba68c7"
raster:bands [] 1 items
0
- nodata -32768
- data_type "float32"
- spatial_resolution 10.0
roles [] 1 items
- 0 "data"
tilejson
- href "https://planetarycomputer.microsoft.com/api/data/v1/item/tilejson.json?collection=sentinel-1-rtc&item=S1A_IW_GRDH_1SDV_20220801T121402_20220801T121427_044359_054B39_rtc&assets=vv&assets=vh&tile_format=png&expression=0.03+%2B+log+%2810e-4+-+log+%280.05+%2F+%280.02+%2B+2+%2A+vv%29%29%29%3B0.05+%2B+exp+%280.25+%2A+%28log+%280.01+%2B+2+%2A+vv%29+%2B+log+%280.02+%2B+5+%2A+vh%29%29%29%3B1+-+log+%280.05+%2F+%280.045+-+0.9+%2A+vv%29%29&asset_as_band=True&rescale=0%2C.8000&rescale=0%2C1.000&rescale=0%2C1.000&format=png"
- type "application/json"
- title "TileJSON with default rendering"
roles [] 1 items
- 0 "tiles"
rendered_preview
- href "https://planetarycomputer.microsoft.com/api/data/v1/item/preview.png?collection=sentinel-1-rtc&item=S1A_IW_GRDH_1SDV_20220801T121402_20220801T121427_044359_054B39_rtc&assets=vv&assets=vh&tile_format=png&expression=0.03+%2B+log+%2810e-4+-+log+%280.05+%2F+%280.02+%2B+2+%2A+vv%29%29%29%3B0.05+%2B+exp+%280.25+%2A+%28log+%280.01+%2B+2+%2A+vv%29+%2B+log+%280.02+%2B+5+%2A+vh%29%29%29%3B1+-+log+%280.05+%2F+%280.045+-+0.9+%2A+vv%29%29&asset_as_band=True&rescale=0%2C.8000&rescale=0%2C1.000&rescale=0%2C1.000&format=png"
- type "image/png"
- title "Rendered preview"
- rel "preview"
roles [] 1 items
- 0 "overview"
bbox [] 4 items
- 0 86.20611723
- 1 26.36668589
- 2 88.98467037
- 3 28.28960544
stac_extensions [] 6 items
- 0 "https://stac-extensions.github.io/sar/v1.0.0/schema.json"
- 1 "https://stac-extensions.github.io/sat/v1.0.0/schema.json"
- 2 "https://stac-extensions.github.io/eo/v1.0.0/schema.json"
- 3 "https://stac-extensions.github.io/projection/v1.0.0/schema.json"
- 4 "https://stac-extensions.github.io/file/v2.0.0/schema.json"
- 5 "https://stac-extensions.github.io/raster/v1.1.0/schema.json"
- collection "sentinel-1-rtc"
1
- type "Feature"
- stac_version "1.0.0"
- id "S1A_IW_GRDH_1SDV_20220727T120554_20220727T120619_044286_05491D_rtc"
properties
- datetime "2022-07-27T12:06:06.953202Z"
- platform "SENTINEL-1A"
s1:shape [] 2 items
- 0 28423
- 1 21970
proj:bbox [] 4 items
- 0 618250.0
- 1 2960450.0
- 2 902480.0
- 3 3180150.0
- proj:epsg 32645
proj:shape [] 2 items
- 0 21970
- 1 28423
- end_datetime "2022-07-27 12:06:19.452211+00:00"
- constellation "Sentinel-1"
- s1:resolution "high"
proj:transform [] 9 items
- 0 10.0
- 1 0.0
- 2 618250.0
- 3 0.0
- 4 -10.0
- 5 3180150.0
- 6 0.0
- 7 0.0
- 8 1.0
- s1:datatake_id "346397"
- start_datetime "2022-07-27 12:05:54.454193+00:00"
- s1:orbit_source "RESORB"
- s1:slice_number "6"
- s1:total_slices "21"
- sar:looks_range 5
- sat:orbit_state "ascending"
- sar:product_type "GRD"
- sar:looks_azimuth 1
sar:polarizations [] 2 items
- 0 "VV"
- 1 "VH"
- sar:frequency_band "C"
- sat:absolute_orbit 44286
- sat:relative_orbit 114
- s1:processing_level "1"
- sar:instrument_mode "IW"
- sar:center_frequency 5.405
- sar:resolution_range 20
- s1:product_timeliness "Fast-24h"
- sar:resolution_azimuth 22
- sar:pixel_spacing_range 10
- sar:observation_direction "right"
- sar:pixel_spacing_azimuth 10
- sar:looks_equivalent_number 4.4
- s1:instrument_configuration_ID "7"
- sat:platform_international_designator "2014-016A"
geometry
- type "Polygon"
coordinates [] 1 items
0 [] 14 items
0 [] 2 items
- 0 89.9801183
- 1 27.0121865
1 [] 2 items
- 0 90.9939426
- 1 27.1729184
2 [] 2 items
- 0 90.7252634
- 1 28.6819044
3 [] 2 items
- 0 88.2182955
- 1 28.2798472
4 [] 2 items
- 0 88.3561865
- 1 27.7231858
5 [] 2 items
- 0 88.3304652
- 1 27.5843394
6 [] 2 items
- 0 88.3772026
- 1 27.5223238
7 [] 2 items
- 0 88.3589031
- 1 27.4089501
8 [] 2 items
- 0 88.4010815
- 1 27.3368619
9 [] 2 items
- 0 88.3797299
- 1 27.3022315
10 [] 2 items
- 0 88.4165088
- 1 27.206452
11 [] 2 items
- 0 88.4049479
- 1 27.0894004
12 [] 2 items
- 0 88.4758345
- 1 26.7595977
13 [] 2 items
- 0 89.9801183
- 1 27.0121865
links [] 7 items
0
- rel "collection"
- href "https://planetarycomputer.microsoft.com/api/stac/v1/collections/sentinel-1-rtc"
- type "application/json"
1
- rel "parent"
- href "https://planetarycomputer.microsoft.com/api/stac/v1/collections/sentinel-1-rtc"
- type "application/json"
2
- rel "root"
- href "https://planetarycomputer.microsoft.com/api/stac/v1"
- type "application/json"
- title "Microsoft Planetary Computer STAC API"
3
- rel "self"
- href "https://planetarycomputer.microsoft.com/api/stac/v1/collections/sentinel-1-rtc/items/S1A_IW_GRDH_1SDV_20220727T120554_20220727T120619_044286_05491D_rtc"
- type "application/geo+json"
4
- rel "license"
- href "https://sentinel.esa.int/documents/247904/690755/Sentinel_Data_Legal_Notice"
5
- rel "derived_from"
- href "https://planetarycomputer.microsoft.com/api/stac/v1/collections/sentinel-1-grd/items/S1A_IW_GRDH_1SDV_20220727T120554_20220727T120619_044286_05491D"
- type "application/json"
- title "Sentinel 1 GRD Item"
6
- rel "preview"
- href "https://planetarycomputer.microsoft.com/api/data/v1/item/map?collection=sentinel-1-rtc&item=S1A_IW_GRDH_1SDV_20220727T120554_20220727T120619_044286_05491D_rtc"
- type "text/html"
- title "Map of item"
assets
vh
- href "https://sentinel1euwestrtc.blob.core.windows.net/sentinel1-grd-rtc/GRD/2022/7/27/IW/DV/S1A_IW_GRDH_1SDV_20220727T120554_20220727T120619_044286_05491D_8A6C/measurement/iw-vh.rtc.tiff"
- type "image/tiff; application=geotiff; profile=cloud-optimized"
- title "VH: vertical transmit, horizontal receive"
- description "Terrain-corrected gamma naught values of signal transmitted with vertical polarization and received with horizontal polarization with radiometric terrain correction applied."
- file:size 1848866687
- file:checksum "872821e94ebf45c9cc9998398809b732"
raster:bands [] 1 items
0
- nodata -32768
- data_type "float32"
- spatial_resolution 10.0
roles [] 1 items
- 0 "data"
vv
- href "https://sentinel1euwestrtc.blob.core.windows.net/sentinel1-grd-rtc/GRD/2022/7/27/IW/DV/S1A_IW_GRDH_1SDV_20220727T120554_20220727T120619_044286_05491D_8A6C/measurement/iw-vv.rtc.tiff"
- type "image/tiff; application=geotiff; profile=cloud-optimized"
- title "VV: vertical transmit, vertical receive"
- description "Terrain-corrected gamma naught values of signal transmitted with vertical polarization and received with vertical polarization with radiometric terrain correction applied."
- file:size 1857450946
- file:checksum "addc7ec51af749c52f4edeb7e8e89044"
raster:bands [] 1 items
0
- nodata -32768
- data_type "float32"
- spatial_resolution 10.0
roles [] 1 items
- 0 "data"
tilejson
- href "https://planetarycomputer.microsoft.com/api/data/v1/item/tilejson.json?collection=sentinel-1-rtc&item=S1A_IW_GRDH_1SDV_20220727T120554_20220727T120619_044286_05491D_rtc&assets=vv&assets=vh&tile_format=png&expression=0.03+%2B+log+%2810e-4+-+log+%280.05+%2F+%280.02+%2B+2+%2A+vv%29%29%29%3B0.05+%2B+exp+%280.25+%2A+%28log+%280.01+%2B+2+%2A+vv%29+%2B+log+%280.02+%2B+5+%2A+vh%29%29%29%3B1+-+log+%280.05+%2F+%280.045+-+0.9+%2A+vv%29%29&asset_as_band=True&rescale=0%2C.8000&rescale=0%2C1.000&rescale=0%2C1.000&format=png"
- type "application/json"
- title "TileJSON with default rendering"
roles [] 1 items
- 0 "tiles"
rendered_preview
- href "https://planetarycomputer.microsoft.com/api/data/v1/item/preview.png?collection=sentinel-1-rtc&item=S1A_IW_GRDH_1SDV_20220727T120554_20220727T120619_044286_05491D_rtc&assets=vv&assets=vh&tile_format=png&expression=0.03+%2B+log+%2810e-4+-+log+%280.05+%2F+%280.02+%2B+2+%2A+vv%29%29%29%3B0.05+%2B+exp+%280.25+%2A+%28log+%280.01+%2B+2+%2A+vv%29+%2B+log+%280.02+%2B+5+%2A+vh%29%29%29%3B1+-+log+%280.05+%2F+%280.045+-+0.9+%2A+vv%29%29&asset_as_band=True&rescale=0%2C.8000&rescale=0%2C1.000&rescale=0%2C1.000&format=png"
- type "image/png"
- title "Rendered preview"
- rel "preview"
roles [] 1 items
- 0 "overview"
bbox [] 4 items
- 0 88.2182955
- 1 26.75959774
- 2 90.9939426
- 3 28.6819044
stac_extensions [] 6 items
- 0 "https://stac-extensions.github.io/sar/v1.0.0/schema.json"
- 1 "https://stac-extensions.github.io/sat/v1.0.0/schema.json"
- 2 "https://stac-extensions.github.io/eo/v1.0.0/schema.json"
- 3 "https://stac-extensions.github.io/projection/v1.0.0/schema.json"
- 4 "https://stac-extensions.github.io/file/v2.0.0/schema.json"
- 5 "https://stac-extensions.github.io/raster/v1.1.0/schema.json"
- collection "sentinel-1-rtc"
2
- type "Feature"
- stac_version "1.0.0"
- id "S1A_IW_GRDH_1SDV_20220723T000320_20220723T000345_044220_05471E_rtc"
properties
- datetime "2022-07-23T00:03:32.650978Z"
- platform "SENTINEL-1A"
s1:shape [] 2 items
- 0 27531
- 1 21084
proj:bbox [] 4 items
- 0 524490.0
- 1 2980820.0
- 2 799800.0
- 3 3191660.0
- proj:epsg 32645
proj:shape [] 2 items
- 0 21084
- 1 27531
- end_datetime "2022-07-23 00:03:45.150333+00:00"
- constellation "Sentinel-1"
- s1:resolution "high"
proj:transform [] 9 items
- 0 10.0
- 1 0.0
- 2 524490.0
- 3 0.0
- 4 -10.0
- 5 3191660.0
- 6 0.0
- 7 0.0
- 8 1.0
- s1:datatake_id "345886"
- start_datetime "2022-07-23 00:03:20.151622+00:00"
- s1:orbit_source "RESORB"
- s1:slice_number "12"
- s1:total_slices "17"
- sar:looks_range 5
- sat:orbit_state "descending"
- sar:product_type "GRD"
- sar:looks_azimuth 1
sar:polarizations [] 2 items
- 0 "VV"
- 1 "VH"
- sar:frequency_band "C"
- sat:absolute_orbit 44220
- sat:relative_orbit 48
- s1:processing_level "1"
- sar:instrument_mode "IW"
- sar:center_frequency 5.405
- sar:resolution_range 20
- s1:product_timeliness "Fast-24h"
- sar:resolution_azimuth 22
- sar:pixel_spacing_range 10
- sar:observation_direction "right"
- sar:pixel_spacing_azimuth 10
- sar:looks_equivalent_number 4.4
- s1:instrument_configuration_ID "7"
- sat:platform_international_designator "2014-016A"
geometry
- type "Polygon"
coordinates [] 1 items
0 [] 19 items
0 [] 2 items
- 0 89.8044214
- 1 27.0231057
1 [] 2 items
- 0 89.8292935
- 1 27.2747258
2 [] 2 items
- 0 89.9033439
- 1 27.4312625
3 [] 2 items
- 0 89.9219145
- 1 27.6326771
4 [] 2 items
- 0 89.9527268
- 1 27.678662
5 [] 2 items
- 0 89.9294684
- 1 27.8243024
6 [] 2 items
- 0 89.9444494
- 1 27.9504536
7 [] 2 items
- 0 89.9877134
- 1 28.0016586
8 [] 2 items
- 0 89.9712875
- 1 28.0843713
9 [] 2 items
- 0 89.9978829
- 1 28.148287
10 [] 2 items
- 0 89.9733431
- 1 28.1919392
11 [] 2 items
- 0 90.026332
- 1 28.2909889
12 [] 2 items
- 0 90.0497456
- 1 28.4415936
13 [] 2 items
- 0 87.5583275
- 1 28.8401155
14 [] 2 items
- 0 87.4258944
- 1 28.1939869
15 [] 2 items
- 0 87.3053834
- 1 27.3292904
16 [] 2 items
- 0 89.7849689
- 1 26.9225324
17 [] 2 items
- 0 89.777233
- 1 26.9949089
18 [] 2 items
- 0 89.8044214
- 1 27.0231057
links [] 7 items
0
- rel "collection"
- href "https://planetarycomputer.microsoft.com/api/stac/v1/collections/sentinel-1-rtc"
- type "application/json"
1
- rel "parent"
- href "https://planetarycomputer.microsoft.com/api/stac/v1/collections/sentinel-1-rtc"
- type "application/json"
2
- rel "root"
- href "https://planetarycomputer.microsoft.com/api/stac/v1"
- type "application/json"
- title "Microsoft Planetary Computer STAC API"
3
- rel "self"
- href "https://planetarycomputer.microsoft.com/api/stac/v1/collections/sentinel-1-rtc/items/S1A_IW_GRDH_1SDV_20220723T000320_20220723T000345_044220_05471E_rtc"
- type "application/geo+json"
4
- rel "license"
- href "https://sentinel.esa.int/documents/247904/690755/Sentinel_Data_Legal_Notice"
5
- rel "derived_from"
- href "https://planetarycomputer.microsoft.com/api/stac/v1/collections/sentinel-1-grd/items/S1A_IW_GRDH_1SDV_20220723T000320_20220723T000345_044220_05471E"
- type "application/json"
- title "Sentinel 1 GRD Item"
6
- rel "preview"
- href "https://planetarycomputer.microsoft.com/api/data/v1/item/map?collection=sentinel-1-rtc&item=S1A_IW_GRDH_1SDV_20220723T000320_20220723T000345_044220_05471E_rtc"
- type "text/html"
- title "Map of item"
assets
vh
- href "https://sentinel1euwestrtc.blob.core.windows.net/sentinel1-grd-rtc/GRD/2022/7/23/IW/DV/S1A_IW_GRDH_1SDV_20220723T000320_20220723T000345_044220_05471E_F9A0/measurement/iw-vh.rtc.tiff"
- type "image/tiff; application=geotiff; profile=cloud-optimized"
- title "VH: vertical transmit, horizontal receive"
- description "Terrain-corrected gamma naught values of signal transmitted with vertical polarization and received with horizontal polarization with radiometric terrain correction applied."
- file:size 1837791533
- file:checksum "339b9e17610393f59798e84743bcf519"
raster:bands [] 1 items
0
- nodata -32768
- data_type "float32"
- spatial_resolution 10.0
roles [] 1 items
- 0 "data"
vv
- href "https://sentinel1euwestrtc.blob.core.windows.net/sentinel1-grd-rtc/GRD/2022/7/23/IW/DV/S1A_IW_GRDH_1SDV_20220723T000320_20220723T000345_044220_05471E_F9A0/measurement/iw-vv.rtc.tiff"
- type "image/tiff; application=geotiff; profile=cloud-optimized"
- title "VV: vertical transmit, vertical receive"
- description "Terrain-corrected gamma naught values of signal transmitted with vertical polarization and received with vertical polarization with radiometric terrain correction applied."
- file:size 1847106635
- file:checksum "efd83657cbc9bf43a729679c789bc5cf"
raster:bands [] 1 items
0
- nodata -32768
- data_type "float32"
- spatial_resolution 10.0
roles [] 1 items
- 0 "data"
tilejson
- href "https://planetarycomputer.microsoft.com/api/data/v1/item/tilejson.json?collection=sentinel-1-rtc&item=S1A_IW_GRDH_1SDV_20220723T000320_20220723T000345_044220_05471E_rtc&assets=vv&assets=vh&tile_format=png&expression=0.03+%2B+log+%2810e-4+-+log+%280.05+%2F+%280.02+%2B+2+%2A+vv%29%29%29%3B0.05+%2B+exp+%280.25+%2A+%28log+%280.01+%2B+2+%2A+vv%29+%2B+log+%280.02+%2B+5+%2A+vh%29%29%29%3B1+-+log+%280.05+%2F+%280.045+-+0.9+%2A+vv%29%29&asset_as_band=True&rescale=0%2C.8000&rescale=0%2C1.000&rescale=0%2C1.000&format=png"
- type "application/json"
- title "TileJSON with default rendering"
roles [] 1 items
- 0 "tiles"
rendered_preview
- href "https://planetarycomputer.microsoft.com/api/data/v1/item/preview.png?collection=sentinel-1-rtc&item=S1A_IW_GRDH_1SDV_20220723T000320_20220723T000345_044220_05471E_rtc&assets=vv&assets=vh&tile_format=png&expression=0.03+%2B+log+%2810e-4+-+log+%280.05+%2F+%280.02+%2B+2+%2A+vv%29%29%29%3B0.05+%2B+exp+%280.25+%2A+%28log+%280.01+%2B+2+%2A+vv%29+%2B+log+%280.02+%2B+5+%2A+vh%29%29%29%3B1+-+log+%280.05+%2F+%280.045+-+0.9+%2A+vv%29%29&asset_as_band=True&rescale=0%2C.8000&rescale=0%2C1.000&rescale=0%2C1.000&format=png"
- type "image/png"
- title "Rendered preview"
- rel "preview"
roles [] 1 items
- 0 "overview"
bbox [] 4 items
- 0 87.30538337
- 1 26.92253241
- 2 90.04974562
- 3 28.84011547
stac_extensions [] 6 items
- 0 "https://stac-extensions.github.io/sar/v1.0.0/schema.json"
- 1 "https://stac-extensions.github.io/sat/v1.0.0/schema.json"
- 2 "https://stac-extensions.github.io/eo/v1.0.0/schema.json"
- 3 "https://stac-extensions.github.io/projection/v1.0.0/schema.json"
- 4 "https://stac-extensions.github.io/file/v2.0.0/schema.json"
- 5 "https://stac-extensions.github.io/raster/v1.1.0/schema.json"
- collection "sentinel-1-rtc"
3
- type "Feature"
- stac_version "1.0.0"
- id "S1A_IW_GRDH_1SDV_20220720T121401_20220720T121426_044184_054615_rtc"
properties
- datetime "2022-07-20T12:14:13.801000Z"
- platform "SENTINEL-1A"
s1:shape [] 2 items
- 0 28149
- 1 21598
proj:bbox [] 4 items
- 0 421810.0
- 1 2916230.0
- 2 703300.0
- 3 3132210.0
- proj:epsg 32645
proj:shape [] 2 items
- 0 21598
- 1 28149
- end_datetime "2022-07-20 12:14:26.299940+00:00"
- constellation "Sentinel-1"
- s1:resolution "high"
proj:transform [] 9 items
- 0 10.0
- 1 0.0
- 2 421810.0
- 3 0.0
- 4 -10.0
- 5 3132210.0
- 6 0.0
- 7 0.0
- 8 1.0
- s1:datatake_id "345621"
- start_datetime "2022-07-20 12:14:01.302060+00:00"
- s1:orbit_source "RESORB"
- s1:slice_number "6"
- s1:total_slices "20"
- sar:looks_range 5
- sat:orbit_state "ascending"
- sar:product_type "GRD"
- sar:looks_azimuth 1
sar:polarizations [] 2 items
- 0 "VV"
- 1 "VH"
- sar:frequency_band "C"
- sat:absolute_orbit 44184
- sat:relative_orbit 12
- s1:processing_level "1"
- sar:instrument_mode "IW"
- sar:center_frequency 5.405
- sar:resolution_range 20
- s1:product_timeliness "Fast-24h"
- sar:resolution_azimuth 22
- sar:pixel_spacing_range 10
- sar:observation_direction "right"
- sar:pixel_spacing_azimuth 10
- sar:looks_equivalent_number 4.4
- s1:instrument_configuration_ID "7"
- sat:platform_international_designator "2014-016A"
geometry
- type "Polygon"
coordinates [] 1 items
0 [] 15 items
0 [] 2 items
- 0 86.2059148
- 1 27.8440476
1 [] 2 items
- 0 86.2100172
- 1 27.7823712
2 [] 2 items
- 0 86.2345875
- 1 27.7812457
3 [] 2 items
- 0 86.2161935
- 1 27.7561375
4 [] 2 items
- 0 86.27067
- 1 27.6973974
5 [] 2 items
- 0 86.2773714
- 1 27.4643442
6 [] 2 items
- 0 86.3267796
- 1 27.3776551
7 [] 2 items
- 0 86.3184707
- 1 27.2314542
8 [] 2 items
- 0 86.355234
- 1 27.1610293
9 [] 2 items
- 0 86.4988763
- 1 26.3665946
10 [] 2 items
- 0 88.9842682
- 1 26.7769932
11 [] 2 items
- 0 88.9221361
- 1 27.3276852
12 [] 2 items
- 0 88.7378471
- 1 28.2896119
13 [] 2 items
- 0 86.2105673
- 1 27.8817168
14 [] 2 items
- 0 86.2059148
- 1 27.8440476
links [] 7 items
0
- rel "collection"
- href "https://planetarycomputer.microsoft.com/api/stac/v1/collections/sentinel-1-rtc"
- type "application/json"
1
- rel "parent"
- href "https://planetarycomputer.microsoft.com/api/stac/v1/collections/sentinel-1-rtc"
- type "application/json"
2
- rel "root"
- href "https://planetarycomputer.microsoft.com/api/stac/v1"
- type "application/json"
- title "Microsoft Planetary Computer STAC API"
3
- rel "self"
- href "https://planetarycomputer.microsoft.com/api/stac/v1/collections/sentinel-1-rtc/items/S1A_IW_GRDH_1SDV_20220720T121401_20220720T121426_044184_054615_rtc"
- type "application/geo+json"
4
- rel "license"
- href "https://sentinel.esa.int/documents/247904/690755/Sentinel_Data_Legal_Notice"
5
- rel "derived_from"
- href "https://planetarycomputer.microsoft.com/api/stac/v1/collections/sentinel-1-grd/items/S1A_IW_GRDH_1SDV_20220720T121401_20220720T121426_044184_054615"
- type "application/json"
- title "Sentinel 1 GRD Item"
6
- rel "preview"
- href "https://planetarycomputer.microsoft.com/api/data/v1/item/map?collection=sentinel-1-rtc&item=S1A_IW_GRDH_1SDV_20220720T121401_20220720T121426_044184_054615_rtc"
- type "text/html"
- title "Map of item"
assets
vh
- href "https://sentinel1euwestrtc.blob.core.windows.net/sentinel1-grd-rtc/GRD/2022/7/20/IW/DV/S1A_IW_GRDH_1SDV_20220720T121401_20220720T121426_044184_054615_05D6/measurement/iw-vh.rtc.tiff"
- type "image/tiff; application=geotiff; profile=cloud-optimized"
- title "VH: vertical transmit, horizontal receive"
- description "Terrain-corrected gamma naught values of signal transmitted with vertical polarization and received with horizontal polarization with radiometric terrain correction applied."
- file:size 1865254106
- file:checksum "19af748f6048807df6820f3ee8ef8a22"
raster:bands [] 1 items
0
- nodata -32768
- data_type "float32"
- spatial_resolution 10.0
roles [] 1 items
- 0 "data"
vv
- href "https://sentinel1euwestrtc.blob.core.windows.net/sentinel1-grd-rtc/GRD/2022/7/20/IW/DV/S1A_IW_GRDH_1SDV_20220720T121401_20220720T121426_044184_054615_05D6/measurement/iw-vv.rtc.tiff"
- type "image/tiff; application=geotiff; profile=cloud-optimized"
- title "VV: vertical transmit, vertical receive"
- description "Terrain-corrected gamma naught values of signal transmitted with vertical polarization and received with vertical polarization with radiometric terrain correction applied."
- file:size 1874494482
- file:checksum "06cdb2d937ace0ed521ba2cd2d284d0c"
raster:bands [] 1 items
0
- nodata -32768
- data_type "float32"
- spatial_resolution 10.0
roles [] 1 items
- 0 "data"
tilejson
- href "https://planetarycomputer.microsoft.com/api/data/v1/item/tilejson.json?collection=sentinel-1-rtc&item=S1A_IW_GRDH_1SDV_20220720T121401_20220720T121426_044184_054615_rtc&assets=vv&assets=vh&tile_format=png&expression=0.03+%2B+log+%2810e-4+-+log+%280.05+%2F+%280.02+%2B+2+%2A+vv%29%29%29%3B0.05+%2B+exp+%280.25+%2A+%28log+%280.01+%2B+2+%2A+vv%29+%2B+log+%280.02+%2B+5+%2A+vh%29%29%29%3B1+-+log+%280.05+%2F+%280.045+-+0.9+%2A+vv%29%29&asset_as_band=True&rescale=0%2C.8000&rescale=0%2C1.000&rescale=0%2C1.000&format=png"
- type "application/json"
- title "TileJSON with default rendering"
roles [] 1 items
- 0 "tiles"
rendered_preview
- href "https://planetarycomputer.microsoft.com/api/data/v1/item/preview.png?collection=sentinel-1-rtc&item=S1A_IW_GRDH_1SDV_20220720T121401_20220720T121426_044184_054615_rtc&assets=vv&assets=vh&tile_format=png&expression=0.03+%2B+log+%2810e-4+-+log+%280.05+%2F+%280.02+%2B+2+%2A+vv%29%29%29%3B0.05+%2B+exp+%280.25+%2A+%28log+%280.01+%2B+2+%2A+vv%29+%2B+log+%280.02+%2B+5+%2A+vh%29%29%29%3B1+-+log+%280.05+%2F+%280.045+-+0.9+%2A+vv%29%29&asset_as_band=True&rescale=0%2C.8000&rescale=0%2C1.000&rescale=0%2C1.000&format=png"
- type "image/png"
- title "Rendered preview"
- rel "preview"
roles [] 1 items
- 0 "overview"
bbox [] 4 items
- 0 86.20591478
- 1 26.36659455
- 2 88.98426824
- 3 28.28961193
stac_extensions [] 6 items
- 0 "https://stac-extensions.github.io/sar/v1.0.0/schema.json"
- 1 "https://stac-extensions.github.io/sat/v1.0.0/schema.json"
- 2 "https://stac-extensions.github.io/eo/v1.0.0/schema.json"
- 3 "https://stac-extensions.github.io/projection/v1.0.0/schema.json"
- 4 "https://stac-extensions.github.io/file/v2.0.0/schema.json"
- 5 "https://stac-extensions.github.io/raster/v1.1.0/schema.json"
- collection "sentinel-1-rtc"
4
- type "Feature"
- stac_version "1.0.0"
- id "S1A_IW_GRDH_1SDV_20220715T120553_20220715T120618_044111_0543E4_rtc"
properties
- datetime "2022-07-15T12:06:06.242032Z"
- platform "SENTINEL-1A"
s1:shape [] 2 items
- 0 28422
- 1 21971
proj:bbox [] 4 items
- 0 618260.0
- 1 2960440.0
- 2 902480.0
- 3 3180150.0
- proj:epsg 32645
proj:shape [] 2 items
- 0 21971
- 1 28422
- end_datetime "2022-07-15 12:06:18.741751+00:00"
- constellation "Sentinel-1"
- s1:resolution "high"
proj:transform [] 9 items
- 0 10.0
- 1 0.0
- 2 618260.0
- 3 0.0
- 4 -10.0
- 5 3180150.0
- 6 0.0
- 7 0.0
- 8 1.0
- s1:datatake_id "345060"
- start_datetime "2022-07-15 12:05:53.742314+00:00"
- s1:orbit_source "RESORB"
- s1:slice_number "6"
- s1:total_slices "21"
- sar:looks_range 5
- sat:orbit_state "ascending"
- sar:product_type "GRD"
- sar:looks_azimuth 1
sar:polarizations [] 2 items
- 0 "VV"
- 1 "VH"
- sar:frequency_band "C"
- sat:absolute_orbit 44111
- sat:relative_orbit 114
- s1:processing_level "1"
- sar:instrument_mode "IW"
- sar:center_frequency 5.405
- sar:resolution_range 20
- s1:product_timeliness "Fast-24h"
- sar:resolution_azimuth 22
- sar:pixel_spacing_range 10
- sar:observation_direction "right"
- sar:pixel_spacing_azimuth 10
- sar:looks_equivalent_number 4.4
- s1:instrument_configuration_ID "7"
- sat:platform_international_designator "2014-016A"
geometry
- type "Polygon"
coordinates [] 1 items
0 [] 14 items
0 [] 2 items
- 0 89.980219
- 1 27.0121844
1 [] 2 items
- 0 90.9939394
- 1 27.1728283
2 [] 2 items
- 0 90.7252634
- 1 28.6819044
3 [] 2 items
- 0 88.2183985
- 1 28.2799366
4 [] 2 items
- 0 88.3563893
- 1 27.7231838
5 [] 2 items
- 0 88.3305665
- 1 27.5843384
6 [] 2 items
- 0 88.3773038
- 1 27.5223228
7 [] 2 items
- 0 88.3590053
- 1 27.4090394
8 [] 2 items
- 0 88.4011825
- 1 27.3368609
9 [] 2 items
- 0 88.3797299
- 1 27.3022315
10 [] 2 items
- 0 88.4166086
- 1 27.2063607
11 [] 2 items
- 0 88.4050488
- 1 27.0893993
12 [] 2 items
- 0 88.4759362
- 1 26.7596869
13 [] 2 items
- 0 89.980219
- 1 27.0121844
links [] 7 items
0
- rel "collection"
- href "https://planetarycomputer.microsoft.com/api/stac/v1/collections/sentinel-1-rtc"
- type "application/json"
1
- rel "parent"
- href "https://planetarycomputer.microsoft.com/api/stac/v1/collections/sentinel-1-rtc"
- type "application/json"
2
- rel "root"
- href "https://planetarycomputer.microsoft.com/api/stac/v1"
- type "application/json"
- title "Microsoft Planetary Computer STAC API"
3
- rel "self"
- href "https://planetarycomputer.microsoft.com/api/stac/v1/collections/sentinel-1-rtc/items/S1A_IW_GRDH_1SDV_20220715T120553_20220715T120618_044111_0543E4_rtc"
- type "application/geo+json"
4
- rel "license"
- href "https://sentinel.esa.int/documents/247904/690755/Sentinel_Data_Legal_Notice"
5
- rel "derived_from"
- href "https://planetarycomputer.microsoft.com/api/stac/v1/collections/sentinel-1-grd/items/S1A_IW_GRDH_1SDV_20220715T120553_20220715T120618_044111_0543E4"
- type "application/json"
- title "Sentinel 1 GRD Item"
6
- rel "preview"
- href "https://planetarycomputer.microsoft.com/api/data/v1/item/map?collection=sentinel-1-rtc&item=S1A_IW_GRDH_1SDV_20220715T120553_20220715T120618_044111_0543E4_rtc"
- type "text/html"
- title "Map of item"
assets
vh
- href "https://sentinel1euwestrtc.blob.core.windows.net/sentinel1-grd-rtc/GRD/2022/7/15/IW/DV/S1A_IW_GRDH_1SDV_20220715T120553_20220715T120618_044111_0543E4_34C8/measurement/iw-vh.rtc.tiff"
- type "image/tiff; application=geotiff; profile=cloud-optimized"
- title "VH: vertical transmit, horizontal receive"
- description "Terrain-corrected gamma naught values of signal transmitted with vertical polarization and received with horizontal polarization with radiometric terrain correction applied."
- file:size 1850816181
- file:checksum "e9b56d109d15523d5f5af48949e17f6b"
raster:bands [] 1 items
0
- nodata -32768
- data_type "float32"
- spatial_resolution 10.0
roles [] 1 items
- 0 "data"
vv
- href "https://sentinel1euwestrtc.blob.core.windows.net/sentinel1-grd-rtc/GRD/2022/7/15/IW/DV/S1A_IW_GRDH_1SDV_20220715T120553_20220715T120618_044111_0543E4_34C8/measurement/iw-vv.rtc.tiff"
- type "image/tiff; application=geotiff; profile=cloud-optimized"
- title "VV: vertical transmit, vertical receive"
- description "Terrain-corrected gamma naught values of signal transmitted with vertical polarization and received with vertical polarization with radiometric terrain correction applied."
- file:size 1858474453
- file:checksum "d2475f94b485f5be76c848717eadfb75"
raster:bands [] 1 items
0
- nodata -32768
- data_type "float32"
- spatial_resolution 10.0
roles [] 1 items
- 0 "data"
tilejson
- href "https://planetarycomputer.microsoft.com/api/data/v1/item/tilejson.json?collection=sentinel-1-rtc&item=S1A_IW_GRDH_1SDV_20220715T120553_20220715T120618_044111_0543E4_rtc&assets=vv&assets=vh&tile_format=png&expression=0.03+%2B+log+%2810e-4+-+log+%280.05+%2F+%280.02+%2B+2+%2A+vv%29%29%29%3B0.05+%2B+exp+%280.25+%2A+%28log+%280.01+%2B+2+%2A+vv%29+%2B+log+%280.02+%2B+5+%2A+vh%29%29%29%3B1+-+log+%280.05+%2F+%280.045+-+0.9+%2A+vv%29%29&asset_as_band=True&rescale=0%2C.8000&rescale=0%2C1.000&rescale=0%2C1.000&format=png"
- type "application/json"
- title "TileJSON with default rendering"
roles [] 1 items
- 0 "tiles"
rendered_preview
- href "https://planetarycomputer.microsoft.com/api/data/v1/item/preview.png?collection=sentinel-1-rtc&item=S1A_IW_GRDH_1SDV_20220715T120553_20220715T120618_044111_0543E4_rtc&assets=vv&assets=vh&tile_format=png&expression=0.03+%2B+log+%2810e-4+-+log+%280.05+%2F+%280.02+%2B+2+%2A+vv%29%29%29%3B0.05+%2B+exp+%280.25+%2A+%28log+%280.01+%2B+2+%2A+vv%29+%2B+log+%280.02+%2B+5+%2A+vh%29%29%29%3B1+-+log+%280.05+%2F+%280.045+-+0.9+%2A+vv%29%29&asset_as_band=True&rescale=0%2C.8000&rescale=0%2C1.000&rescale=0%2C1.000&format=png"
- type "image/png"
- title "Rendered preview"
- rel "preview"
roles [] 1 items
- 0 "overview"
bbox [] 4 items
- 0 88.21839847
- 1 26.75968695
- 2 90.99393939
- 3 28.6819044
stac_extensions [] 6 items
- 0 "https://stac-extensions.github.io/sar/v1.0.0/schema.json"
- 1 "https://stac-extensions.github.io/sat/v1.0.0/schema.json"
- 2 "https://stac-extensions.github.io/eo/v1.0.0/schema.json"
- 3 "https://stac-extensions.github.io/projection/v1.0.0/schema.json"
- 4 "https://stac-extensions.github.io/file/v2.0.0/schema.json"
- 5 "https://stac-extensions.github.io/raster/v1.1.0/schema.json"
- collection "sentinel-1-rtc"
5
- type "Feature"
- stac_version "1.0.0"
- id "S1A_IW_GRDH_1SDV_20220711T000319_20220711T000344_044045_0541E4_rtc"
properties
- datetime "2022-07-11T00:03:31.868452Z"
- platform "SENTINEL-1A"
s1:shape [] 2 items
- 0 27533
- 1 21085
proj:bbox [] 4 items
- 0 524420.0
- 1 2980820.0
- 2 799750.0
- 3 3191670.0
- proj:epsg 32645
proj:shape [] 2 items
- 0 21085
- 1 27533
- end_datetime "2022-07-11 00:03:44.367804+00:00"
- constellation "Sentinel-1"
- s1:resolution "high"
proj:transform [] 9 items
- 0 10.0
- 1 0.0
- 2 524420.0
- 3 0.0
- 4 -10.0
- 5 3191670.0
- 6 0.0
- 7 0.0
- 8 1.0
- s1:datatake_id "344548"
- start_datetime "2022-07-11 00:03:19.369100+00:00"
- s1:orbit_source "RESORB"
- s1:slice_number "12"
- s1:total_slices "17"
- sar:looks_range 5
- sat:orbit_state "descending"
- sar:product_type "GRD"
- sar:looks_azimuth 1
sar:polarizations [] 2 items
- 0 "VV"
- 1 "VH"
- sar:frequency_band "C"
- sat:absolute_orbit 44045
- sat:relative_orbit 48
- s1:processing_level "1"
- sar:instrument_mode "IW"
- sar:center_frequency 5.405
- sar:resolution_range 20
- s1:product_timeliness "Fast-24h"
- sar:resolution_azimuth 22
- sar:pixel_spacing_range 10
- sar:observation_direction "right"
- sar:pixel_spacing_azimuth 10
- sar:looks_equivalent_number 4.4
- s1:instrument_configuration_ID "7"
- sat:platform_international_designator "2014-016A"
geometry
- type "Polygon"
coordinates [] 1 items
0 [] 19 items
0 [] 2 items
- 0 89.8034123
- 1 27.0230356
1 [] 2 items
- 0 89.8288875
- 1 27.2746438
2 [] 2 items
- 0 89.9064322
- 1 27.4487897
3 [] 2 items
- 0 89.9210878
- 1 27.6320631
4 [] 2 items
- 0 89.9520106
- 1 27.6784066
5 [] 2 items
- 0 89.9281308
- 1 27.8236091
6 [] 2 items
- 0 89.9438403
- 1 27.9504666
7 [] 2 items
- 0 89.9870322
- 1 28.0027558
8 [] 2 items
- 0 89.9708784
- 1 28.08429
9 [] 2 items
- 0 89.9971735
- 1 28.1483927
10 [] 2 items
- 0 89.9727227
- 1 28.1915919
11 [] 2 items
- 0 90.0256243
- 1 28.291185
12 [] 2 items
- 0 90.0493377
- 1 28.4416027
13 [] 2 items
- 0 87.5575075
- 1 28.8401189
14 [] 2 items
- 0 87.4253861
- 1 28.1942593
15 [] 2 items
- 0 87.3047769
- 1 27.3292917
16 [] 2 items
- 0 89.7844658
- 1 26.9225423
17 [] 2 items
- 0 89.7764343
- 1 26.9951953
18 [] 2 items
- 0 89.8034123
- 1 27.0230356
links [] 7 items
0
- rel "collection"
- href "https://planetarycomputer.microsoft.com/api/stac/v1/collections/sentinel-1-rtc"
- type "application/json"
1
- rel "parent"
- href "https://planetarycomputer.microsoft.com/api/stac/v1/collections/sentinel-1-rtc"
- type "application/json"
2
- rel "root"
- href "https://planetarycomputer.microsoft.com/api/stac/v1"
- type "application/json"
- title "Microsoft Planetary Computer STAC API"
3
- rel "self"
- href "https://planetarycomputer.microsoft.com/api/stac/v1/collections/sentinel-1-rtc/items/S1A_IW_GRDH_1SDV_20220711T000319_20220711T000344_044045_0541E4_rtc"
- type "application/geo+json"
4
- rel "license"
- href "https://sentinel.esa.int/documents/247904/690755/Sentinel_Data_Legal_Notice"
5
- rel "derived_from"
- href "https://planetarycomputer.microsoft.com/api/stac/v1/collections/sentinel-1-grd/items/S1A_IW_GRDH_1SDV_20220711T000319_20220711T000344_044045_0541E4"
- type "application/json"
- title "Sentinel 1 GRD Item"
6
- rel "preview"
- href "https://planetarycomputer.microsoft.com/api/data/v1/item/map?collection=sentinel-1-rtc&item=S1A_IW_GRDH_1SDV_20220711T000319_20220711T000344_044045_0541E4_rtc"
- type "text/html"
- title "Map of item"
assets
vh
- href "https://sentinel1euwestrtc.blob.core.windows.net/sentinel1-grd-rtc/GRD/2022/7/11/IW/DV/S1A_IW_GRDH_1SDV_20220711T000319_20220711T000344_044045_0541E4_1DE4/measurement/iw-vh.rtc.tiff"
- type "image/tiff; application=geotiff; profile=cloud-optimized"
- title "VH: vertical transmit, horizontal receive"
- description "Terrain-corrected gamma naught values of signal transmitted with vertical polarization and received with horizontal polarization with radiometric terrain correction applied."
- file:size 1839101772
- file:checksum "1a976d45a74893b33182617fa98b6e88"
raster:bands [] 1 items
0
- nodata -32768
- data_type "float32"
- spatial_resolution 10.0
roles [] 1 items
- 0 "data"
vv
- href "https://sentinel1euwestrtc.blob.core.windows.net/sentinel1-grd-rtc/GRD/2022/7/11/IW/DV/S1A_IW_GRDH_1SDV_20220711T000319_20220711T000344_044045_0541E4_1DE4/measurement/iw-vv.rtc.tiff"
- type "image/tiff; application=geotiff; profile=cloud-optimized"
- title "VV: vertical transmit, vertical receive"
- description "Terrain-corrected gamma naught values of signal transmitted with vertical polarization and received with vertical polarization with radiometric terrain correction applied."
- file:size 1845891804
- file:checksum "5d55834b5c799dc6feb4b023ca472b3d"
raster:bands [] 1 items
0
- nodata -32768
- data_type "float32"
- spatial_resolution 10.0
roles [] 1 items
- 0 "data"
tilejson
- href "https://planetarycomputer.microsoft.com/api/data/v1/item/tilejson.json?collection=sentinel-1-rtc&item=S1A_IW_GRDH_1SDV_20220711T000319_20220711T000344_044045_0541E4_rtc&assets=vv&assets=vh&tile_format=png&expression=0.03+%2B+log+%2810e-4+-+log+%280.05+%2F+%280.02+%2B+2+%2A+vv%29%29%29%3B0.05+%2B+exp+%280.25+%2A+%28log+%280.01+%2B+2+%2A+vv%29+%2B+log+%280.02+%2B+5+%2A+vh%29%29%29%3B1+-+log+%280.05+%2F+%280.045+-+0.9+%2A+vv%29%29&asset_as_band=True&rescale=0%2C.8000&rescale=0%2C1.000&rescale=0%2C1.000&format=png"
- type "application/json"
- title "TileJSON with default rendering"
roles [] 1 items
- 0 "tiles"
rendered_preview
- href "https://planetarycomputer.microsoft.com/api/data/v1/item/preview.png?collection=sentinel-1-rtc&item=S1A_IW_GRDH_1SDV_20220711T000319_20220711T000344_044045_0541E4_rtc&assets=vv&assets=vh&tile_format=png&expression=0.03+%2B+log+%2810e-4+-+log+%280.05+%2F+%280.02+%2B+2+%2A+vv%29%29%29%3B0.05+%2B+exp+%280.25+%2A+%28log+%280.01+%2B+2+%2A+vv%29+%2B+log+%280.02+%2B+5+%2A+vh%29%29%29%3B1+-+log+%280.05+%2F+%280.045+-+0.9+%2A+vv%29%29&asset_as_band=True&rescale=0%2C.8000&rescale=0%2C1.000&rescale=0%2C1.000&format=png"
- type "image/png"
- title "Rendered preview"
- rel "preview"
roles [] 1 items
- 0 "overview"
bbox [] 4 items
- 0 87.30477686
- 1 26.92254234
- 2 90.0493377
- 3 28.84011886
stac_extensions [] 6 items
- 0 "https://stac-extensions.github.io/sar/v1.0.0/schema.json"
- 1 "https://stac-extensions.github.io/sat/v1.0.0/schema.json"
- 2 "https://stac-extensions.github.io/eo/v1.0.0/schema.json"
- 3 "https://stac-extensions.github.io/projection/v1.0.0/schema.json"
- 4 "https://stac-extensions.github.io/file/v2.0.0/schema.json"
- 5 "https://stac-extensions.github.io/raster/v1.1.0/schema.json"
- collection "sentinel-1-rtc"
6
- type "Feature"
- stac_version "1.0.0"
- id "S1A_IW_GRDH_1SDV_20220708T121400_20220708T121425_044009_0540D0_rtc"
properties
- datetime "2022-07-08T12:14:13.035532Z"
- platform "SENTINEL-1A"
s1:shape [] 2 items
- 0 28148
- 1 21598
proj:bbox [] 4 items
- 0 421800.0
- 1 2916230.0
- 2 703280.0
- 3 3132210.0
- proj:epsg 32645
proj:shape [] 2 items
- 0 21598
- 1 28148
- end_datetime "2022-07-08 12:14:25.534456+00:00"
- constellation "Sentinel-1"
- s1:resolution "high"
proj:transform [] 9 items
- 0 10.0
- 1 0.0
- 2 421800.0
- 3 0.0
- 4 -10.0
- 5 3132210.0
- 6 0.0
- 7 0.0
- 8 1.0
- s1:datatake_id "344272"
- start_datetime "2022-07-08 12:14:00.536608+00:00"
- s1:orbit_source "RESORB"
- s1:slice_number "6"
- s1:total_slices "20"
- sar:looks_range 5
- sat:orbit_state "ascending"
- sar:product_type "GRD"
- sar:looks_azimuth 1
sar:polarizations [] 2 items
- 0 "VV"
- 1 "VH"
- sar:frequency_band "C"
- sat:absolute_orbit 44009
- sat:relative_orbit 12
- s1:processing_level "1"
- sar:instrument_mode "IW"
- sar:center_frequency 5.405
- sar:resolution_range 20
- s1:product_timeliness "Fast-24h"
- sar:resolution_azimuth 22
- sar:pixel_spacing_range 10
- sar:observation_direction "right"
- sar:pixel_spacing_azimuth 10
- sar:looks_equivalent_number 4.4
- s1:instrument_configuration_ID "7"
- sat:platform_international_designator "2014-016A"
geometry
- type "Polygon"
coordinates [] 1 items
0 [] 15 items
0 [] 2 items
- 0 86.2058132
- 1 27.844047
1 [] 2 items
- 0 86.2099157
- 1 27.7823706
2 [] 2 items
- 0 86.2344841
- 1 27.7815159
3 [] 2 items
- 0 86.2160914
- 1 27.7562271
4 [] 2 items
- 0 86.2705686
- 1 27.6973968
5 [] 2 items
- 0 86.2772702
- 1 27.4643437
6 [] 2 items
- 0 86.3266785
- 1 27.3776546
7 [] 2 items
- 0 86.3184724
- 1 27.2311834
8 [] 2 items
- 0 86.355132
- 1 27.1612093
9 [] 2 items
- 0 86.4987761
- 1 26.3665942
10 [] 2 items
- 0 88.9842682
- 1 26.7769932
11 [] 2 items
- 0 88.922133
- 1 27.3275047
12 [] 2 items
- 0 88.7378471
- 1 28.2896119
13 [] 2 items
- 0 86.2105673
- 1 27.8817168
14 [] 2 items
- 0 86.2058132
- 1 27.844047
links [] 7 items
0
- rel "collection"
- href "https://planetarycomputer.microsoft.com/api/stac/v1/collections/sentinel-1-rtc"
- type "application/json"
1
- rel "parent"
- href "https://planetarycomputer.microsoft.com/api/stac/v1/collections/sentinel-1-rtc"
- type "application/json"
2
- rel "root"
- href "https://planetarycomputer.microsoft.com/api/stac/v1"
- type "application/json"
- title "Microsoft Planetary Computer STAC API"
3
- rel "self"
- href "https://planetarycomputer.microsoft.com/api/stac/v1/collections/sentinel-1-rtc/items/S1A_IW_GRDH_1SDV_20220708T121400_20220708T121425_044009_0540D0_rtc"
- type "application/geo+json"
4
- rel "license"
- href "https://sentinel.esa.int/documents/247904/690755/Sentinel_Data_Legal_Notice"
5
- rel "derived_from"
- href "https://planetarycomputer.microsoft.com/api/stac/v1/collections/sentinel-1-grd/items/S1A_IW_GRDH_1SDV_20220708T121400_20220708T121425_044009_0540D0"
- type "application/json"
- title "Sentinel 1 GRD Item"
6
- rel "preview"
- href "https://planetarycomputer.microsoft.com/api/data/v1/item/map?collection=sentinel-1-rtc&item=S1A_IW_GRDH_1SDV_20220708T121400_20220708T121425_044009_0540D0_rtc"
- type "text/html"
- title "Map of item"
assets
vh
- href "https://sentinel1euwestrtc.blob.core.windows.net/sentinel1-grd-rtc/GRD/2022/7/8/IW/DV/S1A_IW_GRDH_1SDV_20220708T121400_20220708T121425_044009_0540D0_8484/measurement/iw-vh.rtc.tiff"
- type "image/tiff; application=geotiff; profile=cloud-optimized"
- title "VH: vertical transmit, horizontal receive"
- description "Terrain-corrected gamma naught values of signal transmitted with vertical polarization and received with horizontal polarization with radiometric terrain correction applied."
- file:size 1866948737
- file:checksum "d2bdfaa2d429dbd99fa6894ba369ffe7"
raster:bands [] 1 items
0
- nodata -32768
- data_type "float32"
- spatial_resolution 10.0
roles [] 1 items
- 0 "data"
vv
- href "https://sentinel1euwestrtc.blob.core.windows.net/sentinel1-grd-rtc/GRD/2022/7/8/IW/DV/S1A_IW_GRDH_1SDV_20220708T121400_20220708T121425_044009_0540D0_8484/measurement/iw-vv.rtc.tiff"
- type "image/tiff; application=geotiff; profile=cloud-optimized"
- title "VV: vertical transmit, vertical receive"
- description "Terrain-corrected gamma naught values of signal transmitted with vertical polarization and received with vertical polarization with radiometric terrain correction applied."
- file:size 1876009804
- file:checksum "0f956036e5a9ef1d0bdb4374cd1e1ad0"
raster:bands [] 1 items
0
- nodata -32768
- data_type "float32"
- spatial_resolution 10.0
roles [] 1 items
- 0 "data"
tilejson
- href "https://planetarycomputer.microsoft.com/api/data/v1/item/tilejson.json?collection=sentinel-1-rtc&item=S1A_IW_GRDH_1SDV_20220708T121400_20220708T121425_044009_0540D0_rtc&assets=vv&assets=vh&tile_format=png&expression=0.03+%2B+log+%2810e-4+-+log+%280.05+%2F+%280.02+%2B+2+%2A+vv%29%29%29%3B0.05+%2B+exp+%280.25+%2A+%28log+%280.01+%2B+2+%2A+vv%29+%2B+log+%280.02+%2B+5+%2A+vh%29%29%29%3B1+-+log+%280.05+%2F+%280.045+-+0.9+%2A+vv%29%29&asset_as_band=True&rescale=0%2C.8000&rescale=0%2C1.000&rescale=0%2C1.000&format=png"
- type "application/json"
- title "TileJSON with default rendering"
roles [] 1 items
- 0 "tiles"
rendered_preview
- href "https://planetarycomputer.microsoft.com/api/data/v1/item/preview.png?collection=sentinel-1-rtc&item=S1A_IW_GRDH_1SDV_20220708T121400_20220708T121425_044009_0540D0_rtc&assets=vv&assets=vh&tile_format=png&expression=0.03+%2B+log+%2810e-4+-+log+%280.05+%2F+%280.02+%2B+2+%2A+vv%29%29%29%3B0.05+%2B+exp+%280.25+%2A+%28log+%280.01+%2B+2+%2A+vv%29+%2B+log+%280.02+%2B+5+%2A+vh%29%29%29%3B1+-+log+%280.05+%2F+%280.045+-+0.9+%2A+vv%29%29&asset_as_band=True&rescale=0%2C.8000&rescale=0%2C1.000&rescale=0%2C1.000&format=png"
- type "image/png"
- title "Rendered preview"
- rel "preview"
roles [] 1 items
- 0 "overview"
bbox [] 4 items
- 0 86.20581323
- 1 26.3665942
- 2 88.98426824
- 3 28.28961193
stac_extensions [] 6 items
- 0 "https://stac-extensions.github.io/sar/v1.0.0/schema.json"
- 1 "https://stac-extensions.github.io/sat/v1.0.0/schema.json"
- 2 "https://stac-extensions.github.io/eo/v1.0.0/schema.json"
- 3 "https://stac-extensions.github.io/projection/v1.0.0/schema.json"
- 4 "https://stac-extensions.github.io/file/v2.0.0/schema.json"
- 5 "https://stac-extensions.github.io/raster/v1.1.0/schema.json"
- collection "sentinel-1-rtc"
7
- type "Feature"
- stac_version "1.0.0"
- id "S1A_IW_GRDH_1SDV_20220703T120553_20220703T120618_043936_053EA7_rtc"
properties
- datetime "2022-07-03T12:06:05.553402Z"
- platform "SENTINEL-1A"
s1:shape [] 2 items
- 0 28425
- 1 21970
proj:bbox [] 4 items
- 0 618180.0
- 1 2960440.0
- 2 902430.0
- 3 3180140.0
- proj:epsg 32645
proj:shape [] 2 items
- 0 21970
- 1 28425
- end_datetime "2022-07-03 12:06:18.052440+00:00"
- constellation "Sentinel-1"
- s1:resolution "high"
proj:transform [] 9 items
- 0 10.0
- 1 0.0
- 2 618180.0
- 3 0.0
- 4 -10.0
- 5 3180140.0
- 6 0.0
- 7 0.0
- 8 1.0
- s1:datatake_id "343719"
- start_datetime "2022-07-03 12:05:53.054364+00:00"
- s1:orbit_source "RESORB"
- s1:slice_number "6"
- s1:total_slices "21"
- sar:looks_range 5
- sat:orbit_state "ascending"
- sar:product_type "GRD"
- sar:looks_azimuth 1
sar:polarizations [] 2 items
- 0 "VV"
- 1 "VH"
- sar:frequency_band "C"
- sat:absolute_orbit 43936
- sat:relative_orbit 114
- s1:processing_level "1"
- sar:instrument_mode "IW"
- sar:center_frequency 5.405
- sar:resolution_range 20
- s1:product_timeliness "Fast-24h"
- sar:resolution_azimuth 22
- sar:pixel_spacing_range 10
- sar:observation_direction "right"
- sar:pixel_spacing_azimuth 10
- sar:looks_equivalent_number 4.4
- s1:instrument_configuration_ID "7"
- sat:platform_international_designator "2014-016A"
geometry
- type "Polygon"
coordinates [] 1 items
0 [] 14 items
0 [] 2 items
- 0 89.9817385
- 1 27.012513
1 [] 2 items
- 0 90.9934359
- 1 27.1728426
2 [] 2 items
- 0 90.7245453
- 1 28.681834
3 [] 2 items
- 0 88.2174789
- 1 28.2797643
4 [] 2 items
- 0 88.354868
- 1 27.7231987
5 [] 2 items
- 0 88.329755
- 1 27.5842559
6 [] 2 items
- 0 88.376287
- 1 27.5219718
7 [] 2 items
- 0 88.3578929
- 1 27.4090502
8 [] 2 items
- 0 88.4002673
- 1 27.3364187
9 [] 2 items
- 0 88.3791282
- 1 27.3025985
10 [] 2 items
- 0 88.4160075
- 1 27.2067278
11 [] 2 items
- 0 88.4041401
- 1 27.0893182
12 [] 2 items
- 0 88.4751307
- 1 26.7596051
13 [] 2 items
- 0 89.9817385
- 1 27.012513
links [] 7 items
0
- rel "collection"
- href "https://planetarycomputer.microsoft.com/api/stac/v1/collections/sentinel-1-rtc"
- type "application/json"
1
- rel "parent"
- href "https://planetarycomputer.microsoft.com/api/stac/v1/collections/sentinel-1-rtc"
- type "application/json"
2
- rel "root"
- href "https://planetarycomputer.microsoft.com/api/stac/v1"
- type "application/json"
- title "Microsoft Planetary Computer STAC API"
3
- rel "self"
- href "https://planetarycomputer.microsoft.com/api/stac/v1/collections/sentinel-1-rtc/items/S1A_IW_GRDH_1SDV_20220703T120553_20220703T120618_043936_053EA7_rtc"
- type "application/geo+json"
4
- rel "license"
- href "https://sentinel.esa.int/documents/247904/690755/Sentinel_Data_Legal_Notice"
5
- rel "derived_from"
- href "https://planetarycomputer.microsoft.com/api/stac/v1/collections/sentinel-1-grd/items/S1A_IW_GRDH_1SDV_20220703T120553_20220703T120618_043936_053EA7"
- type "application/json"
- title "Sentinel 1 GRD Item"
6
- rel "preview"
- href "https://planetarycomputer.microsoft.com/api/data/v1/item/map?collection=sentinel-1-rtc&item=S1A_IW_GRDH_1SDV_20220703T120553_20220703T120618_043936_053EA7_rtc"
- type "text/html"
- title "Map of item"
assets
vh
- href "https://sentinel1euwestrtc.blob.core.windows.net/sentinel1-grd-rtc/GRD/2022/7/3/IW/DV/S1A_IW_GRDH_1SDV_20220703T120553_20220703T120618_043936_053EA7_A796/measurement/iw-vh.rtc.tiff"
- type "image/tiff; application=geotiff; profile=cloud-optimized"
- title "VH: vertical transmit, horizontal receive"
- description "Terrain-corrected gamma naught values of signal transmitted with vertical polarization and received with horizontal polarization with radiometric terrain correction applied."
- file:size 1849774072
- file:checksum "e80aed7be4b1c2079ec518554f1d569d"
raster:bands [] 1 items
0
- nodata -32768
- data_type "float32"
- spatial_resolution 10.0
roles [] 1 items
- 0 "data"
vv
- href "https://sentinel1euwestrtc.blob.core.windows.net/sentinel1-grd-rtc/GRD/2022/7/3/IW/DV/S1A_IW_GRDH_1SDV_20220703T120553_20220703T120618_043936_053EA7_A796/measurement/iw-vv.rtc.tiff"
- type "image/tiff; application=geotiff; profile=cloud-optimized"
- title "VV: vertical transmit, vertical receive"
- description "Terrain-corrected gamma naught values of signal transmitted with vertical polarization and received with vertical polarization with radiometric terrain correction applied."
- file:size 1857942688
- file:checksum "192cb1a0bbe3477346bb2f4e9540a696"
raster:bands [] 1 items
0
- nodata -32768
- data_type "float32"
- spatial_resolution 10.0
roles [] 1 items
- 0 "data"
tilejson
- href "https://planetarycomputer.microsoft.com/api/data/v1/item/tilejson.json?collection=sentinel-1-rtc&item=S1A_IW_GRDH_1SDV_20220703T120553_20220703T120618_043936_053EA7_rtc&assets=vv&assets=vh&tile_format=png&expression=0.03+%2B+log+%2810e-4+-+log+%280.05+%2F+%280.02+%2B+2+%2A+vv%29%29%29%3B0.05+%2B+exp+%280.25+%2A+%28log+%280.01+%2B+2+%2A+vv%29+%2B+log+%280.02+%2B+5+%2A+vh%29%29%29%3B1+-+log+%280.05+%2F+%280.045+-+0.9+%2A+vv%29%29&asset_as_band=True&rescale=0%2C.8000&rescale=0%2C1.000&rescale=0%2C1.000&format=png"
- type "application/json"
- title "TileJSON with default rendering"
roles [] 1 items
- 0 "tiles"
rendered_preview
- href "https://planetarycomputer.microsoft.com/api/data/v1/item/preview.png?collection=sentinel-1-rtc&item=S1A_IW_GRDH_1SDV_20220703T120553_20220703T120618_043936_053EA7_rtc&assets=vv&assets=vh&tile_format=png&expression=0.03+%2B+log+%2810e-4+-+log+%280.05+%2F+%280.02+%2B+2+%2A+vv%29%29%29%3B0.05+%2B+exp+%280.25+%2A+%28log+%280.01+%2B+2+%2A+vv%29+%2B+log+%280.02+%2B+5+%2A+vh%29%29%29%3B1+-+log+%280.05+%2F+%280.045+-+0.9+%2A+vv%29%29&asset_as_band=True&rescale=0%2C.8000&rescale=0%2C1.000&rescale=0%2C1.000&format=png"
- type "image/png"
- title "Rendered preview"
- rel "preview"
roles [] 1 items
- 0 "overview"
bbox [] 4 items
- 0 88.21747889
- 1 26.75960507
- 2 90.99343589
- 3 28.68183403
stac_extensions [] 6 items
- 0 "https://stac-extensions.github.io/sar/v1.0.0/schema.json"
- 1 "https://stac-extensions.github.io/sat/v1.0.0/schema.json"
- 2 "https://stac-extensions.github.io/eo/v1.0.0/schema.json"
- 3 "https://stac-extensions.github.io/projection/v1.0.0/schema.json"
- 4 "https://stac-extensions.github.io/file/v2.0.0/schema.json"
- 5 "https://stac-extensions.github.io/raster/v1.1.0/schema.json"
- collection "sentinel-1-rtc"
8
- type "Feature"
- stac_version "1.0.0"
- id "S1A_IW_GRDH_1SDV_20220629T000318_20220629T000343_043870_053CB6_rtc"
properties
- datetime "2022-06-29T00:03:31.187957Z"
- platform "SENTINEL-1A"
s1:shape [] 2 items
- 0 27534
- 1 21084
proj:bbox [] 4 items
- 0 524390.0
- 1 2980820.0
- 2 799730.0
- 3 3191660.0
- proj:epsg 32645
proj:shape [] 2 items
- 0 21084
- 1 27534
- end_datetime "2022-06-29 00:03:43.686526+00:00"
- constellation "Sentinel-1"
- s1:resolution "high"
proj:transform [] 9 items
- 0 10.0
- 1 0.0
- 2 524390.0
- 3 0.0
- 4 -10.0
- 5 3191660.0
- 6 0.0
- 7 0.0
- 8 1.0
- s1:datatake_id "343222"
- start_datetime "2022-06-29 00:03:18.689387+00:00"
- s1:orbit_source "RESORB"
- s1:slice_number "12"
- s1:total_slices "17"
- sar:looks_range 5
- sat:orbit_state "descending"
- sar:product_type "GRD"
- sar:looks_azimuth 1
sar:polarizations [] 2 items
- 0 "VV"
- 1 "VH"
- sar:frequency_band "C"
- sat:absolute_orbit 43870
- sat:relative_orbit 48
- s1:processing_level "1"
- sar:instrument_mode "IW"
- sar:center_frequency 5.405
- sar:resolution_range 20
- s1:product_timeliness "Fast-24h"
- sar:resolution_azimuth 22
- sar:pixel_spacing_range 10
- sar:observation_direction "right"
- sar:pixel_spacing_azimuth 10
- sar:looks_equivalent_number 4.4
- s1:instrument_configuration_ID "7"
- sat:platform_international_designator "2014-016A"
geometry
- type "Polygon"
coordinates [] 1 items
0 [] 19 items
0 [] 2 items
- 0 89.8032467
- 1 27.0244824
1 [] 2 items
- 0 89.828351
- 1 27.2733916
2 [] 2 items
- 0 89.9060256
- 1 27.4487079
3 [] 2 items
- 0 89.9208854
- 1 27.6320673
4 [] 2 items
- 0 89.9517092
- 1 27.6785033
5 [] 2 items
- 0 89.9279037
- 1 27.8227118
6 [] 2 items
- 0 89.9436348
- 1 27.9503808
7 [] 2 items
- 0 89.986735
- 1 28.0030329
8 [] 2 items
- 0 89.9707767
- 1 28.0842922
9 [] 2 items
- 0 89.9968709
- 1 28.1484896
10 [] 2 items
- 0 89.9725217
- 1 28.1916864
11 [] 2 items
- 0 90.0253213
- 1 28.2912819
12 [] 2 items
- 0 90.0492331
- 1 28.4415148
13 [] 2 items
- 0 87.5574045
- 1 28.840029
14 [] 2 items
- 0 87.4251809
- 1 28.1938989
15 [] 2 items
- 0 87.3046763
- 1 27.3294725
16 [] 2 items
- 0 89.7844658
- 1 26.9225423
17 [] 2 items
- 0 89.7770573
- 1 27.0000551
18 [] 2 items
- 0 89.8032467
- 1 27.0244824
links [] 7 items
0
- rel "collection"
- href "https://planetarycomputer.microsoft.com/api/stac/v1/collections/sentinel-1-rtc"
- type "application/json"
1
- rel "parent"
- href "https://planetarycomputer.microsoft.com/api/stac/v1/collections/sentinel-1-rtc"
- type "application/json"
2
- rel "root"
- href "https://planetarycomputer.microsoft.com/api/stac/v1"
- type "application/json"
- title "Microsoft Planetary Computer STAC API"
3
- rel "self"
- href "https://planetarycomputer.microsoft.com/api/stac/v1/collections/sentinel-1-rtc/items/S1A_IW_GRDH_1SDV_20220629T000318_20220629T000343_043870_053CB6_rtc"
- type "application/geo+json"
4
- rel "license"
- href "https://sentinel.esa.int/documents/247904/690755/Sentinel_Data_Legal_Notice"
5
- rel "derived_from"
- href "https://planetarycomputer.microsoft.com/api/stac/v1/collections/sentinel-1-grd/items/S1A_IW_GRDH_1SDV_20220629T000318_20220629T000343_043870_053CB6"
- type "application/json"
- title "Sentinel 1 GRD Item"
6
- rel "preview"
- href "https://planetarycomputer.microsoft.com/api/data/v1/item/map?collection=sentinel-1-rtc&item=S1A_IW_GRDH_1SDV_20220629T000318_20220629T000343_043870_053CB6_rtc"
- type "text/html"
- title "Map of item"
assets
vh
- href "https://sentinel1euwestrtc.blob.core.windows.net/sentinel1-grd-rtc/GRD/2022/6/29/IW/DV/S1A_IW_GRDH_1SDV_20220629T000318_20220629T000343_043870_053CB6_0CC8/measurement/iw-vh.rtc.tiff"
- type "image/tiff; application=geotiff; profile=cloud-optimized"
- title "VH: vertical transmit, horizontal receive"
- description "Terrain-corrected gamma naught values of signal transmitted with vertical polarization and received with horizontal polarization with radiometric terrain correction applied."
- file:size 1839072769
- file:checksum "c57db192d794784a1021cb1d78861c73"
raster:bands [] 1 items
0
- nodata -32768
- data_type "float32"
- spatial_resolution 10.0
roles [] 1 items
- 0 "data"
vv
- href "https://sentinel1euwestrtc.blob.core.windows.net/sentinel1-grd-rtc/GRD/2022/6/29/IW/DV/S1A_IW_GRDH_1SDV_20220629T000318_20220629T000343_043870_053CB6_0CC8/measurement/iw-vv.rtc.tiff"
- type "image/tiff; application=geotiff; profile=cloud-optimized"
- title "VV: vertical transmit, vertical receive"
- description "Terrain-corrected gamma naught values of signal transmitted with vertical polarization and received with vertical polarization with radiometric terrain correction applied."
- file:size 1847774838
- file:checksum "8e007e1c3e68c923bec68a06995785b2"
raster:bands [] 1 items
0
- nodata -32768
- data_type "float32"
- spatial_resolution 10.0
roles [] 1 items
- 0 "data"
tilejson
- href "https://planetarycomputer.microsoft.com/api/data/v1/item/tilejson.json?collection=sentinel-1-rtc&item=S1A_IW_GRDH_1SDV_20220629T000318_20220629T000343_043870_053CB6_rtc&assets=vv&assets=vh&tile_format=png&expression=0.03+%2B+log+%2810e-4+-+log+%280.05+%2F+%280.02+%2B+2+%2A+vv%29%29%29%3B0.05+%2B+exp+%280.25+%2A+%28log+%280.01+%2B+2+%2A+vv%29+%2B+log+%280.02+%2B+5+%2A+vh%29%29%29%3B1+-+log+%280.05+%2F+%280.045+-+0.9+%2A+vv%29%29&asset_as_band=True&rescale=0%2C.8000&rescale=0%2C1.000&rescale=0%2C1.000&format=png"
- type "application/json"
- title "TileJSON with default rendering"
roles [] 1 items
- 0 "tiles"
rendered_preview
- href "https://planetarycomputer.microsoft.com/api/data/v1/item/preview.png?collection=sentinel-1-rtc&item=S1A_IW_GRDH_1SDV_20220629T000318_20220629T000343_043870_053CB6_rtc&assets=vv&assets=vh&tile_format=png&expression=0.03+%2B+log+%2810e-4+-+log+%280.05+%2F+%280.02+%2B+2+%2A+vv%29%29%29%3B0.05+%2B+exp+%280.25+%2A+%28log+%280.01+%2B+2+%2A+vv%29+%2B+log+%280.02+%2B+5+%2A+vh%29%29%29%3B1+-+log+%280.05+%2F+%280.045+-+0.9+%2A+vv%29%29&asset_as_band=True&rescale=0%2C.8000&rescale=0%2C1.000&rescale=0%2C1.000&format=png"
- type "image/png"
- title "Rendered preview"
- rel "preview"
roles [] 1 items
- 0 "overview"
bbox [] 4 items
- 0 87.30467627
- 1 26.92254234
- 2 90.04923313
- 3 28.84002903
stac_extensions [] 6 items
- 0 "https://stac-extensions.github.io/sar/v1.0.0/schema.json"
- 1 "https://stac-extensions.github.io/sat/v1.0.0/schema.json"
- 2 "https://stac-extensions.github.io/eo/v1.0.0/schema.json"
- 3 "https://stac-extensions.github.io/projection/v1.0.0/schema.json"
- 4 "https://stac-extensions.github.io/file/v2.0.0/schema.json"
- 5 "https://stac-extensions.github.io/raster/v1.1.0/schema.json"
- collection "sentinel-1-rtc"
9
- type "Feature"
- stac_version "1.0.0"
- id "S1A_IW_GRDH_1SDV_20220626T121359_20220626T121424_043834_053BA2_rtc"
properties
- datetime "2022-06-26T12:14:12.455112Z"
- platform "SENTINEL-1A"
s1:shape [] 2 items
- 0 28149
- 1 21599
proj:bbox [] 4 items
- 0 421810.0
- 1 2916210.0
- 2 703300.0
- 3 3132200.0
- proj:epsg 32645
proj:shape [] 2 items
- 0 21599
- 1 28149
- end_datetime "2022-06-26 12:14:24.954817+00:00"
- constellation "Sentinel-1"
- s1:resolution "high"
proj:transform [] 9 items
- 0 10.0
- 1 0.0
- 2 421810.0
- 3 0.0
- 4 -10.0
- 5 3132200.0
- 6 0.0
- 7 0.0
- 8 1.0
- s1:datatake_id "342946"
- start_datetime "2022-06-26 12:13:59.955407+00:00"
- s1:orbit_source "RESORB"
- s1:slice_number "6"
- s1:total_slices "20"
- sar:looks_range 5
- sat:orbit_state "ascending"
- sar:product_type "GRD"
- sar:looks_azimuth 1
sar:polarizations [] 2 items
- 0 "VV"
- 1 "VH"
- sar:frequency_band "C"
- sat:absolute_orbit 43834
- sat:relative_orbit 12
- s1:processing_level "1"
- sar:instrument_mode "IW"
- sar:center_frequency 5.405
- sar:resolution_range 20
- s1:product_timeliness "Fast-24h"
- sar:resolution_azimuth 22
- sar:pixel_spacing_range 10
- sar:observation_direction "right"
- sar:pixel_spacing_azimuth 10
- sar:looks_equivalent_number 4.4
- s1:instrument_configuration_ID "7"
- sat:platform_international_designator "2014-016A"
geometry
- type "Polygon"
coordinates [] 1 items
0 [] 15 items
0 [] 2 items
- 0 86.2059148
- 1 27.8440476
1 [] 2 items
- 0 86.2099137
- 1 27.7826414
2 [] 2 items
- 0 86.2345875
- 1 27.7812457
3 [] 2 items
- 0 86.2162963
- 1 27.7559575
4 [] 2 items
- 0 86.27067
- 1 27.6973974
5 [] 2 items
- 0 86.2773714
- 1 27.4643442
6 [] 2 items
- 0 86.3267796
- 1 27.3776551
7 [] 2 items
- 0 86.3184713
- 1 27.2313639
8 [] 2 items
- 0 86.3551315
- 1 27.1612996
9 [] 2 items
- 0 86.4987764
- 1 26.3665039
10 [] 2 items
- 0 88.9843656
- 1 26.7768113
11 [] 2 items
- 0 88.9222341
- 1 27.3275033
12 [] 2 items
- 0 88.7378457
- 1 28.2895217
13 [] 2 items
- 0 86.210872
- 1 27.8817186
14 [] 2 items
- 0 86.2059148
- 1 27.8440476
links [] 7 items
0
- rel "collection"
- href "https://planetarycomputer.microsoft.com/api/stac/v1/collections/sentinel-1-rtc"
- type "application/json"
1
- rel "parent"
- href "https://planetarycomputer.microsoft.com/api/stac/v1/collections/sentinel-1-rtc"
- type "application/json"
2
- rel "root"
- href "https://planetarycomputer.microsoft.com/api/stac/v1"
- type "application/json"
- title "Microsoft Planetary Computer STAC API"
3
- rel "self"
- href "https://planetarycomputer.microsoft.com/api/stac/v1/collections/sentinel-1-rtc/items/S1A_IW_GRDH_1SDV_20220626T121359_20220626T121424_043834_053BA2_rtc"
- type "application/geo+json"
4
- rel "license"
- href "https://sentinel.esa.int/documents/247904/690755/Sentinel_Data_Legal_Notice"
5
- rel "derived_from"
- href "https://planetarycomputer.microsoft.com/api/stac/v1/collections/sentinel-1-grd/items/S1A_IW_GRDH_1SDV_20220626T121359_20220626T121424_043834_053BA2"
- type "application/json"
- title "Sentinel 1 GRD Item"
6
- rel "preview"
- href "https://planetarycomputer.microsoft.com/api/data/v1/item/map?collection=sentinel-1-rtc&item=S1A_IW_GRDH_1SDV_20220626T121359_20220626T121424_043834_053BA2_rtc"
- type "text/html"
- title "Map of item"
assets
vh
- href "https://sentinel1euwestrtc.blob.core.windows.net/sentinel1-grd-rtc/GRD/2022/6/26/IW/DV/S1A_IW_GRDH_1SDV_20220626T121359_20220626T121424_043834_053BA2_5E9D/measurement/iw-vh.rtc.tiff"
- type "image/tiff; application=geotiff; profile=cloud-optimized"
- title "VH: vertical transmit, horizontal receive"
- description "Terrain-corrected gamma naught values of signal transmitted with vertical polarization and received with horizontal polarization with radiometric terrain correction applied."
- file:size 1865666154
- file:checksum "fff48cb7acfe22ccb7c9bdeebb74cca0"
raster:bands [] 1 items
0
- nodata -32768
- data_type "float32"
- spatial_resolution 10.0
roles [] 1 items
- 0 "data"
vv
- href "https://sentinel1euwestrtc.blob.core.windows.net/sentinel1-grd-rtc/GRD/2022/6/26/IW/DV/S1A_IW_GRDH_1SDV_20220626T121359_20220626T121424_043834_053BA2_5E9D/measurement/iw-vv.rtc.tiff"
- type "image/tiff; application=geotiff; profile=cloud-optimized"
- title "VV: vertical transmit, vertical receive"
- description "Terrain-corrected gamma naught values of signal transmitted with vertical polarization and received with vertical polarization with radiometric terrain correction applied."
- file:size 1873857630
- file:checksum "50d6939790b7d5276c88cb729eb30f62"
raster:bands [] 1 items
0
- nodata -32768
- data_type "float32"
- spatial_resolution 10.0
roles [] 1 items
- 0 "data"
tilejson
- href "https://planetarycomputer.microsoft.com/api/data/v1/item/tilejson.json?collection=sentinel-1-rtc&item=S1A_IW_GRDH_1SDV_20220626T121359_20220626T121424_043834_053BA2_rtc&assets=vv&assets=vh&tile_format=png&expression=0.03+%2B+log+%2810e-4+-+log+%280.05+%2F+%280.02+%2B+2+%2A+vv%29%29%29%3B0.05+%2B+exp+%280.25+%2A+%28log+%280.01+%2B+2+%2A+vv%29+%2B+log+%280.02+%2B+5+%2A+vh%29%29%29%3B1+-+log+%280.05+%2F+%280.045+-+0.9+%2A+vv%29%29&asset_as_band=True&rescale=0%2C.8000&rescale=0%2C1.000&rescale=0%2C1.000&format=png"
- type "application/json"
- title "TileJSON with default rendering"
roles [] 1 items
- 0 "tiles"
rendered_preview
- href "https://planetarycomputer.microsoft.com/api/data/v1/item/preview.png?collection=sentinel-1-rtc&item=S1A_IW_GRDH_1SDV_20220626T121359_20220626T121424_043834_053BA2_rtc&assets=vv&assets=vh&tile_format=png&expression=0.03+%2B+log+%2810e-4+-+log+%280.05+%2F+%280.02+%2B+2+%2A+vv%29%29%29%3B0.05+%2B+exp+%280.25+%2A+%28log+%280.01+%2B+2+%2A+vv%29+%2B+log+%280.02+%2B+5+%2A+vh%29%29%29%3B1+-+log+%280.05+%2F+%280.045+-+0.9+%2A+vv%29%29&asset_as_band=True&rescale=0%2C.8000&rescale=0%2C1.000&rescale=0%2C1.000&format=png"
- type "image/png"
- title "Rendered preview"
- rel "preview"
roles [] 1 items
- 0 "overview"
bbox [] 4 items
- 0 86.20591478
- 1 26.36650391
- 2 88.98436564
- 3 28.2895217
stac_extensions [] 6 items
- 0 "https://stac-extensions.github.io/sar/v1.0.0/schema.json"
- 1 "https://stac-extensions.github.io/sat/v1.0.0/schema.json"
- 2 "https://stac-extensions.github.io/eo/v1.0.0/schema.json"
- 3 "https://stac-extensions.github.io/projection/v1.0.0/schema.json"
- 4 "https://stac-extensions.github.io/file/v2.0.0/schema.json"
- 5 "https://stac-extensions.github.io/raster/v1.1.0/schema.json"
- collection "sentinel-1-rtc"
10
- type "Feature"
- stac_version "1.0.0"
- id "S1A_IW_GRDH_1SDV_20220621T120552_20220621T120617_043761_053978_rtc"
properties
- datetime "2022-06-21T12:06:04.879869Z"
- platform "SENTINEL-1A"
s1:shape [] 2 items
- 0 28425
- 1 21971
proj:bbox [] 4 items
- 0 618170.0
- 1 2960440.0
- 2 902420.0
- 3 3180150.0
- proj:epsg 32645
proj:shape [] 2 items
- 0 21971
- 1 28425
- end_datetime "2022-06-21 12:06:17.379612+00:00"
- constellation "Sentinel-1"
- s1:resolution "high"
proj:transform [] 9 items
- 0 10.0
- 1 0.0
- 2 618170.0
- 3 0.0
- 4 -10.0
- 5 3180150.0
- 6 0.0
- 7 0.0
- 8 1.0
- s1:datatake_id "342392"
- start_datetime "2022-06-21 12:05:52.380127+00:00"
- s1:orbit_source "RESORB"
- s1:slice_number "6"
- s1:total_slices "21"
- sar:looks_range 5
- sat:orbit_state "ascending"
- sar:product_type "GRD"
- sar:looks_azimuth 1
sar:polarizations [] 2 items
- 0 "VV"
- 1 "VH"
- sar:frequency_band "C"
- sat:absolute_orbit 43761
- sat:relative_orbit 114
- s1:processing_level "1"
- sar:instrument_mode "IW"
- sar:center_frequency 5.405
- sar:resolution_range 20
- s1:product_timeliness "Fast-24h"
- sar:resolution_azimuth 22
- sar:pixel_spacing_range 10
- sar:observation_direction "right"
- sar:pixel_spacing_azimuth 10
- sar:looks_equivalent_number 4.4
- s1:instrument_configuration_ID "7"
- sat:platform_international_designator "2014-016A"
geometry
- type "Polygon"
coordinates [] 1 items
0 [] 14 items
0 [] 2 items
- 0 89.9820429
- 1 27.0125968
1 [] 2 items
- 0 90.9933352
- 1 27.1728455
2 [] 2 items
- 0 90.7245516
- 1 28.6820142
3 [] 2 items
- 0 88.2174799
- 1 28.2798545
4 [] 2 items
- 0 88.354868
- 1 27.7231987
5 [] 2 items
- 0 88.3297539
- 1 27.5841657
6 [] 2 items
- 0 88.3762859
- 1 27.5218815
7 [] 2 items
- 0 88.3578918
- 1 27.40896
8 [] 2 items
- 0 88.4002673
- 1 27.3364187
9 [] 2 items
- 0 88.3791282
- 1 27.3025985
10 [] 2 items
- 0 88.4160075
- 1 27.2067278
11 [] 2 items
- 0 88.4041401
- 1 27.0893182
12 [] 2 items
- 0 88.4751307
- 1 26.7596051
13 [] 2 items
- 0 89.9820429
- 1 27.0125968
links [] 7 items
0
- rel "collection"
- href "https://planetarycomputer.microsoft.com/api/stac/v1/collections/sentinel-1-rtc"
- type "application/json"
1
- rel "parent"
- href "https://planetarycomputer.microsoft.com/api/stac/v1/collections/sentinel-1-rtc"
- type "application/json"
2
- rel "root"
- href "https://planetarycomputer.microsoft.com/api/stac/v1"
- type "application/json"
- title "Microsoft Planetary Computer STAC API"
3
- rel "self"
- href "https://planetarycomputer.microsoft.com/api/stac/v1/collections/sentinel-1-rtc/items/S1A_IW_GRDH_1SDV_20220621T120552_20220621T120617_043761_053978_rtc"
- type "application/geo+json"
4
- rel "license"
- href "https://sentinel.esa.int/documents/247904/690755/Sentinel_Data_Legal_Notice"
5
- rel "derived_from"
- href "https://planetarycomputer.microsoft.com/api/stac/v1/collections/sentinel-1-grd/items/S1A_IW_GRDH_1SDV_20220621T120552_20220621T120617_043761_053978"
- type "application/json"
- title "Sentinel 1 GRD Item"
6
- rel "preview"
- href "https://planetarycomputer.microsoft.com/api/data/v1/item/map?collection=sentinel-1-rtc&item=S1A_IW_GRDH_1SDV_20220621T120552_20220621T120617_043761_053978_rtc"
- type "text/html"
- title "Map of item"
assets
vh
- href "https://sentinel1euwestrtc.blob.core.windows.net/sentinel1-grd-rtc/GRD/2022/6/21/IW/DV/S1A_IW_GRDH_1SDV_20220621T120552_20220621T120617_043761_053978_2F7A/measurement/iw-vh.rtc.tiff"
- type "image/tiff; application=geotiff; profile=cloud-optimized"
- title "VH: vertical transmit, horizontal receive"
- description "Terrain-corrected gamma naught values of signal transmitted with vertical polarization and received with horizontal polarization with radiometric terrain correction applied."
- file:size 1849885174
- file:checksum "f4763e391743697dc59101187273a5d7"
raster:bands [] 1 items
0
- nodata -32768
- data_type "float32"
- spatial_resolution 10.0
roles [] 1 items
- 0 "data"
vv
- href "https://sentinel1euwestrtc.blob.core.windows.net/sentinel1-grd-rtc/GRD/2022/6/21/IW/DV/S1A_IW_GRDH_1SDV_20220621T120552_20220621T120617_043761_053978_2F7A/measurement/iw-vv.rtc.tiff"
- type "image/tiff; application=geotiff; profile=cloud-optimized"
- title "VV: vertical transmit, vertical receive"
- description "Terrain-corrected gamma naught values of signal transmitted with vertical polarization and received with vertical polarization with radiometric terrain correction applied."
- file:size 1857566220
- file:checksum "f7d66e40e99ba15206e705df6d6922ae"
raster:bands [] 1 items
0
- nodata -32768
- data_type "float32"
- spatial_resolution 10.0
roles [] 1 items
- 0 "data"
tilejson
- href "https://planetarycomputer.microsoft.com/api/data/v1/item/tilejson.json?collection=sentinel-1-rtc&item=S1A_IW_GRDH_1SDV_20220621T120552_20220621T120617_043761_053978_rtc&assets=vv&assets=vh&tile_format=png&expression=0.03+%2B+log+%2810e-4+-+log+%280.05+%2F+%280.02+%2B+2+%2A+vv%29%29%29%3B0.05+%2B+exp+%280.25+%2A+%28log+%280.01+%2B+2+%2A+vv%29+%2B+log+%280.02+%2B+5+%2A+vh%29%29%29%3B1+-+log+%280.05+%2F+%280.045+-+0.9+%2A+vv%29%29&asset_as_band=True&rescale=0%2C.8000&rescale=0%2C1.000&rescale=0%2C1.000&format=png"
- type "application/json"
- title "TileJSON with default rendering"
roles [] 1 items
- 0 "tiles"
rendered_preview
- href "https://planetarycomputer.microsoft.com/api/data/v1/item/preview.png?collection=sentinel-1-rtc&item=S1A_IW_GRDH_1SDV_20220621T120552_20220621T120617_043761_053978_rtc&assets=vv&assets=vh&tile_format=png&expression=0.03+%2B+log+%2810e-4+-+log+%280.05+%2F+%280.02+%2B+2+%2A+vv%29%29%29%3B0.05+%2B+exp+%280.25+%2A+%28log+%280.01+%2B+2+%2A+vv%29+%2B+log+%280.02+%2B+5+%2A+vh%29%29%29%3B1+-+log+%280.05+%2F+%280.045+-+0.9+%2A+vv%29%29&asset_as_band=True&rescale=0%2C.8000&rescale=0%2C1.000&rescale=0%2C1.000&format=png"
- type "image/png"
- title "Rendered preview"
- rel "preview"
roles [] 1 items
- 0 "overview"
bbox [] 4 items
- 0 88.21747992
- 1 26.75960507
- 2 90.99333519
- 3 28.68201417
stac_extensions [] 6 items
- 0 "https://stac-extensions.github.io/sar/v1.0.0/schema.json"
- 1 "https://stac-extensions.github.io/sat/v1.0.0/schema.json"
- 2 "https://stac-extensions.github.io/eo/v1.0.0/schema.json"
- 3 "https://stac-extensions.github.io/projection/v1.0.0/schema.json"
- 4 "https://stac-extensions.github.io/file/v2.0.0/schema.json"
- 5 "https://stac-extensions.github.io/raster/v1.1.0/schema.json"
- collection "sentinel-1-rtc"
11
- type "Feature"
- stac_version "1.0.0"
- id "S1A_IW_GRDH_1SDV_20220617T000317_20220617T000342_043695_053770_rtc"
properties
- datetime "2022-06-17T00:03:30.273763Z"
- platform "SENTINEL-1A"
s1:shape [] 2 items
- 0 27524
- 1 21082
proj:bbox [] 4 items
- 0 524590.0
- 1 2980850.0
- 2 799830.0
- 3 3191670.0
- proj:epsg 32645
proj:shape [] 2 items
- 0 21082
- 1 27524
- end_datetime "2022-06-17 00:03:42.773155+00:00"
- constellation "Sentinel-1"
- s1:resolution "high"
proj:transform [] 9 items
- 0 10.0
- 1 0.0
- 2 524590.0
- 3 0.0
- 4 -10.0
- 5 3191670.0
- 6 0.0
- 7 0.0
- 8 1.0
- s1:datatake_id "341872"
- start_datetime "2022-06-17 00:03:17.774371+00:00"
- s1:orbit_source "RESORB"
- s1:slice_number "12"
- s1:total_slices "17"
- sar:looks_range 5
- sat:orbit_state "descending"
- sar:product_type "GRD"
- sar:looks_azimuth 1
sar:polarizations [] 2 items
- 0 "VV"
- 1 "VH"
- sar:frequency_band "C"
- sat:absolute_orbit 43695
- sat:relative_orbit 48
- s1:processing_level "1"
- sar:instrument_mode "IW"
- sar:center_frequency 5.405
- sar:resolution_range 20
- s1:product_timeliness "Fast-24h"
- sar:resolution_azimuth 22
- sar:pixel_spacing_range 10
- sar:observation_direction "right"
- sar:pixel_spacing_azimuth 10
- sar:looks_equivalent_number 4.4
- s1:instrument_configuration_ID "7"
- sat:platform_international_designator "2014-016A"
geometry
- type "Polygon"
coordinates [] 1 items
0 [] 16 items
0 [] 2 items
- 0 89.8054126
- 1 27.0224544
1 [] 2 items
- 0 89.8297935
- 1 27.2745352
2 [] 2 items
- 0 89.9035668
- 1 27.4281906
3 [] 2 items
- 0 89.9235936
- 1 27.6386858
4 [] 2 items
- 0 89.953221
- 1 27.6782004
5 [] 2 items
- 0 89.9319127
- 1 27.8510422
6 [] 2 items
- 0 89.9455014
- 1 27.9517842
7 [] 2 items
- 0 89.9884069
- 1 28.001012
8 [] 2 items
- 0 89.9859715
- 1 28.1884168
9 [] 2 items
- 0 90.0502607
- 1 28.4417624
10 [] 2 items
- 0 87.5591481
- 1 28.8402023
11 [] 2 items
- 0 87.4264053
- 1 28.1943464
12 [] 2 items
- 0 87.3060925
- 1 27.3298305
13 [] 2 items
- 0 89.7850761
- 1 26.922801
14 [] 2 items
- 0 89.7784321
- 1 26.9945244
15 [] 2 items
- 0 89.8054126
- 1 27.0224544
links [] 7 items
0
- rel "collection"
- href "https://planetarycomputer.microsoft.com/api/stac/v1/collections/sentinel-1-rtc"
- type "application/json"
1
- rel "parent"
- href "https://planetarycomputer.microsoft.com/api/stac/v1/collections/sentinel-1-rtc"
- type "application/json"
2
- rel "root"
- href "https://planetarycomputer.microsoft.com/api/stac/v1"
- type "application/json"
- title "Microsoft Planetary Computer STAC API"
3
- rel "self"
- href "https://planetarycomputer.microsoft.com/api/stac/v1/collections/sentinel-1-rtc/items/S1A_IW_GRDH_1SDV_20220617T000317_20220617T000342_043695_053770_rtc"
- type "application/geo+json"
4
- rel "license"
- href "https://sentinel.esa.int/documents/247904/690755/Sentinel_Data_Legal_Notice"
5
- rel "derived_from"
- href "https://planetarycomputer.microsoft.com/api/stac/v1/collections/sentinel-1-grd/items/S1A_IW_GRDH_1SDV_20220617T000317_20220617T000342_043695_053770"
- type "application/json"
- title "Sentinel 1 GRD Item"
6
- rel "preview"
- href "https://planetarycomputer.microsoft.com/api/data/v1/item/map?collection=sentinel-1-rtc&item=S1A_IW_GRDH_1SDV_20220617T000317_20220617T000342_043695_053770_rtc"
- type "text/html"
- title "Map of item"
assets
vh
- href "https://sentinel1euwestrtc.blob.core.windows.net/sentinel1-grd-rtc/GRD/2022/6/17/IW/DV/S1A_IW_GRDH_1SDV_20220617T000317_20220617T000342_043695_053770_DA89/measurement/iw-vh.rtc.tiff"
- type "image/tiff; application=geotiff; profile=cloud-optimized"
- title "VH: vertical transmit, horizontal receive"
- description "Terrain-corrected gamma naught values of signal transmitted with vertical polarization and received with horizontal polarization with radiometric terrain correction applied."
- file:size 1841082070
- file:checksum "c14508997d33fbfac8cd6395a9095acb"
raster:bands [] 1 items
0
- nodata -32768
- data_type "float32"
- spatial_resolution 10.0
roles [] 1 items
- 0 "data"
vv
- href "https://sentinel1euwestrtc.blob.core.windows.net/sentinel1-grd-rtc/GRD/2022/6/17/IW/DV/S1A_IW_GRDH_1SDV_20220617T000317_20220617T000342_043695_053770_DA89/measurement/iw-vv.rtc.tiff"
- type "image/tiff; application=geotiff; profile=cloud-optimized"
- title "VV: vertical transmit, vertical receive"
- description "Terrain-corrected gamma naught values of signal transmitted with vertical polarization and received with vertical polarization with radiometric terrain correction applied."
- file:size 1848322094
- file:checksum "b6c6313bf5e12268b705d01e8515b9a7"
raster:bands [] 1 items
0
- nodata -32768
- data_type "float32"
- spatial_resolution 10.0
roles [] 1 items
- 0 "data"
tilejson
- href "https://planetarycomputer.microsoft.com/api/data/v1/item/tilejson.json?collection=sentinel-1-rtc&item=S1A_IW_GRDH_1SDV_20220617T000317_20220617T000342_043695_053770_rtc&assets=vv&assets=vh&tile_format=png&expression=0.03+%2B+log+%2810e-4+-+log+%280.05+%2F+%280.02+%2B+2+%2A+vv%29%29%29%3B0.05+%2B+exp+%280.25+%2A+%28log+%280.01+%2B+2+%2A+vv%29+%2B+log+%280.02+%2B+5+%2A+vh%29%29%29%3B1+-+log+%280.05+%2F+%280.045+-+0.9+%2A+vv%29%29&asset_as_band=True&rescale=0%2C.8000&rescale=0%2C1.000&rescale=0%2C1.000&format=png"
- type "application/json"
- title "TileJSON with default rendering"
roles [] 1 items
- 0 "tiles"
rendered_preview
- href "https://planetarycomputer.microsoft.com/api/data/v1/item/preview.png?collection=sentinel-1-rtc&item=S1A_IW_GRDH_1SDV_20220617T000317_20220617T000342_043695_053770_rtc&assets=vv&assets=vh&tile_format=png&expression=0.03+%2B+log+%2810e-4+-+log+%280.05+%2F+%280.02+%2B+2+%2A+vv%29%29%29%3B0.05+%2B+exp+%280.25+%2A+%28log+%280.01+%2B+2+%2A+vv%29+%2B+log+%280.02+%2B+5+%2A+vh%29%29%29%3B1+-+log+%280.05+%2F+%280.045+-+0.9+%2A+vv%29%29&asset_as_band=True&rescale=0%2C.8000&rescale=0%2C1.000&rescale=0%2C1.000&format=png"
- type "image/png"
- title "Rendered preview"
- rel "preview"
roles [] 1 items
- 0 "overview"
bbox [] 4 items
- 0 87.30609246
- 1 26.92280096
- 2 90.0502607
- 3 28.84020233
stac_extensions [] 6 items
- 0 "https://stac-extensions.github.io/sar/v1.0.0/schema.json"
- 1 "https://stac-extensions.github.io/sat/v1.0.0/schema.json"
- 2 "https://stac-extensions.github.io/eo/v1.0.0/schema.json"
- 3 "https://stac-extensions.github.io/projection/v1.0.0/schema.json"
- 4 "https://stac-extensions.github.io/file/v2.0.0/schema.json"
- 5 "https://stac-extensions.github.io/raster/v1.1.0/schema.json"
- collection "sentinel-1-rtc"
12
- type "Feature"
- stac_version "1.0.0"
- id "S1A_IW_GRDH_1SDV_20220614T121359_20220614T121424_043659_05365F_rtc"
properties
- datetime "2022-06-14T12:14:11.513880Z"
- platform "SENTINEL-1A"
s1:shape [] 2 items
- 0 28155
- 1 21598
proj:bbox [] 4 items
- 0 421870.0
- 1 2916240.0
- 2 703420.0
- 3 3132220.0
- proj:epsg 32645
proj:shape [] 2 items
- 0 21598
- 1 28155
- end_datetime "2022-06-14 12:14:24.012807+00:00"
- constellation "Sentinel-1"
- s1:resolution "high"
proj:transform [] 9 items
- 0 10.0
- 1 0.0
- 2 421870.0
- 3 0.0
- 4 -10.0
- 5 3132220.0
- 6 0.0
- 7 0.0
- 8 1.0
- s1:datatake_id "341599"
- start_datetime "2022-06-14 12:13:59.014953+00:00"
- s1:orbit_source "RESORB"
- s1:slice_number "6"
- s1:total_slices "20"
- sar:looks_range 5
- sat:orbit_state "ascending"
- sar:product_type "GRD"
- sar:looks_azimuth 1
sar:polarizations [] 2 items
- 0 "VV"
- 1 "VH"
- sar:frequency_band "C"
- sat:absolute_orbit 43659
- sat:relative_orbit 12
- s1:processing_level "1"
- sar:instrument_mode "IW"
- sar:center_frequency 5.405
- sar:resolution_range 20
- s1:product_timeliness "Fast-24h"
- sar:resolution_azimuth 22
- sar:pixel_spacing_range 10
- sar:observation_direction "right"
- sar:pixel_spacing_azimuth 10
- sar:looks_equivalent_number 4.4
- s1:instrument_configuration_ID "7"
- sat:platform_international_designator "2014-016A"
geometry
- type "Polygon"
coordinates [] 1 items
0 [] 15 items
0 [] 2 items
- 0 86.2065215
- 1 27.8444121
1 [] 2 items
- 0 86.2108167
- 1 27.7840909
2 [] 2 items
- 0 86.2352954
- 1 27.7816107
3 [] 2 items
- 0 86.2175146
- 1 27.7558741
4 [] 2 items
- 0 86.2721888
- 1 27.6977664
5 [] 2 items
- 0 86.2791918
- 1 27.4645342
6 [] 2 items
- 0 86.3291104
- 1 27.3768539
7 [] 2 items
- 0 86.3194757
- 1 27.2322716
8 [] 2 items
- 0 86.3731357
- 1 27.082024
9 [] 2 items
- 0 86.4999784
- 1 26.3666887
10 [] 2 items
- 0 88.9854746
- 1 26.7769763
11 [] 2 items
- 0 88.9230516
- 1 27.3280336
12 [] 2 items
- 0 88.7392742
- 1 28.2895938
13 [] 2 items
- 0 86.2116847
- 1 27.8817232
14 [] 2 items
- 0 86.2065215
- 1 27.8444121
links [] 7 items
0
- rel "collection"
- href "https://planetarycomputer.microsoft.com/api/stac/v1/collections/sentinel-1-rtc"
- type "application/json"
1
- rel "parent"
- href "https://planetarycomputer.microsoft.com/api/stac/v1/collections/sentinel-1-rtc"
- type "application/json"
2
- rel "root"
- href "https://planetarycomputer.microsoft.com/api/stac/v1"
- type "application/json"
- title "Microsoft Planetary Computer STAC API"
3
- rel "self"
- href "https://planetarycomputer.microsoft.com/api/stac/v1/collections/sentinel-1-rtc/items/S1A_IW_GRDH_1SDV_20220614T121359_20220614T121424_043659_05365F_rtc"
- type "application/geo+json"
4
- rel "license"
- href "https://sentinel.esa.int/documents/247904/690755/Sentinel_Data_Legal_Notice"
5
- rel "derived_from"
- href "https://planetarycomputer.microsoft.com/api/stac/v1/collections/sentinel-1-grd/items/S1A_IW_GRDH_1SDV_20220614T121359_20220614T121424_043659_05365F"
- type "application/json"
- title "Sentinel 1 GRD Item"
6
- rel "preview"
- href "https://planetarycomputer.microsoft.com/api/data/v1/item/map?collection=sentinel-1-rtc&item=S1A_IW_GRDH_1SDV_20220614T121359_20220614T121424_043659_05365F_rtc"
- type "text/html"
- title "Map of item"
assets
vh
- href "https://sentinel1euwestrtc.blob.core.windows.net/sentinel1-grd-rtc/GRD/2022/6/14/IW/DV/S1A_IW_GRDH_1SDV_20220614T121359_20220614T121424_043659_05365F_0A74/measurement/iw-vh.rtc.tiff"
- type "image/tiff; application=geotiff; profile=cloud-optimized"
- title "VH: vertical transmit, horizontal receive"
- description "Terrain-corrected gamma naught values of signal transmitted with vertical polarization and received with horizontal polarization with radiometric terrain correction applied."
- file:size 1865314824
- file:checksum "fe8622562d9b1dc59b3f7e53b1078981"
raster:bands [] 1 items
0
- nodata -32768
- data_type "float32"
- spatial_resolution 10.0
roles [] 1 items
- 0 "data"
vv
- href "https://sentinel1euwestrtc.blob.core.windows.net/sentinel1-grd-rtc/GRD/2022/6/14/IW/DV/S1A_IW_GRDH_1SDV_20220614T121359_20220614T121424_043659_05365F_0A74/measurement/iw-vv.rtc.tiff"
- type "image/tiff; application=geotiff; profile=cloud-optimized"
- title "VV: vertical transmit, vertical receive"
- description "Terrain-corrected gamma naught values of signal transmitted with vertical polarization and received with vertical polarization with radiometric terrain correction applied."
- file:size 1873669327
- file:checksum "4027204a99723c279f228ef43da341e3"
raster:bands [] 1 items
0
- nodata -32768
- data_type "float32"
- spatial_resolution 10.0
roles [] 1 items
- 0 "data"
tilejson
- href "https://planetarycomputer.microsoft.com/api/data/v1/item/tilejson.json?collection=sentinel-1-rtc&item=S1A_IW_GRDH_1SDV_20220614T121359_20220614T121424_043659_05365F_rtc&assets=vv&assets=vh&tile_format=png&expression=0.03+%2B+log+%2810e-4+-+log+%280.05+%2F+%280.02+%2B+2+%2A+vv%29%29%29%3B0.05+%2B+exp+%280.25+%2A+%28log+%280.01+%2B+2+%2A+vv%29+%2B+log+%280.02+%2B+5+%2A+vh%29%29%29%3B1+-+log+%280.05+%2F+%280.045+-+0.9+%2A+vv%29%29&asset_as_band=True&rescale=0%2C.8000&rescale=0%2C1.000&rescale=0%2C1.000&format=png"
- type "application/json"
- title "TileJSON with default rendering"
roles [] 1 items
- 0 "tiles"
rendered_preview
- href "https://planetarycomputer.microsoft.com/api/data/v1/item/preview.png?collection=sentinel-1-rtc&item=S1A_IW_GRDH_1SDV_20220614T121359_20220614T121424_043659_05365F_rtc&assets=vv&assets=vh&tile_format=png&expression=0.03+%2B+log+%2810e-4+-+log+%280.05+%2F+%280.02+%2B+2+%2A+vv%29%29%29%3B0.05+%2B+exp+%280.25+%2A+%28log+%280.01+%2B+2+%2A+vv%29+%2B+log+%280.02+%2B+5+%2A+vh%29%29%29%3B1+-+log+%280.05+%2F+%280.045+-+0.9+%2A+vv%29%29&asset_as_band=True&rescale=0%2C.8000&rescale=0%2C1.000&rescale=0%2C1.000&format=png"
- type "image/png"
- title "Rendered preview"
- rel "preview"
roles [] 1 items
- 0 "overview"
bbox [] 4 items
- 0 86.20652146
- 1 26.3666887
- 2 88.98547463
- 3 28.28959376
stac_extensions [] 6 items
- 0 "https://stac-extensions.github.io/sar/v1.0.0/schema.json"
- 1 "https://stac-extensions.github.io/sat/v1.0.0/schema.json"
- 2 "https://stac-extensions.github.io/eo/v1.0.0/schema.json"
- 3 "https://stac-extensions.github.io/projection/v1.0.0/schema.json"
- 4 "https://stac-extensions.github.io/file/v2.0.0/schema.json"
- 5 "https://stac-extensions.github.io/raster/v1.1.0/schema.json"
- collection "sentinel-1-rtc"
13
- type "Feature"
- stac_version "1.0.0"
- id "S1A_IW_GRDH_1SDV_20220609T120551_20220609T120616_043586_053436_rtc"
properties
- datetime "2022-06-09T12:06:04.189105Z"
- platform "SENTINEL-1A"
s1:shape [] 2 items
- 0 28427
- 1 21971
proj:bbox [] 4 items
- 0 618110.0
- 1 2960440.0
- 2 902380.0
- 3 3180150.0
- proj:epsg 32645
proj:shape [] 2 items
- 0 21971
- 1 28427
- end_datetime "2022-06-09 12:06:16.688822+00:00"
- constellation "Sentinel-1"
- s1:resolution "high"
proj:transform [] 9 items
- 0 10.0
- 1 0.0
- 2 618110.0
- 3 0.0
- 4 -10.0
- 5 3180150.0
- 6 0.0
- 7 0.0
- 8 1.0
- s1:datatake_id "341046"
- start_datetime "2022-06-09 12:05:51.689387+00:00"
- s1:orbit_source "RESORB"
- s1:slice_number "6"
- s1:total_slices "21"
- sar:looks_range 5
- sat:orbit_state "ascending"
- sar:product_type "GRD"
- sar:looks_azimuth 1
sar:polarizations [] 2 items
- 0 "VV"
- 1 "VH"
- sar:frequency_band "C"
- sat:absolute_orbit 43586
- sat:relative_orbit 114
- s1:processing_level "1"
- sar:instrument_mode "IW"
- sar:center_frequency 5.405
- sar:resolution_range 20
- s1:product_timeliness "Fast-24h"
- sar:resolution_azimuth 22
- sar:pixel_spacing_range 10
- sar:observation_direction "right"
- sar:pixel_spacing_azimuth 10
- sar:looks_equivalent_number 4.4
- s1:instrument_configuration_ID "7"
- sat:platform_international_designator "2014-016A"
geometry
- type "Polygon"
coordinates [] 1 items
0 [] 14 items
0 [] 2 items
- 0 89.9814389
- 1 27.0126096
1 [] 2 items
- 0 90.992731
- 1 27.1728627
2 [] 2 items
- 0 90.7239388
- 1 28.6820311
3 [] 2 items
- 0 88.2168682
- 1 28.27986
4 [] 2 items
- 0 88.3539541
- 1 27.7231174
5 [] 2 items
- 0 88.3291473
- 1 27.5842618
6 [] 2 items
- 0 88.3756785
- 1 27.5218875
7 [] 2 items
- 0 88.357285
- 1 27.4089659
8 [] 2 items
- 0 88.3996598
- 1 27.3363345
9 [] 2 items
- 0 88.3787274
- 1 27.3028733
10 [] 2 items
- 0 88.4157046
- 1 27.2067309
11 [] 2 items
- 0 88.4035362
- 1 27.0894145
12 [] 2 items
- 0 88.474628
- 1 26.7596103
13 [] 2 items
- 0 89.9814389
- 1 27.0126096
links [] 7 items
0
- rel "collection"
- href "https://planetarycomputer.microsoft.com/api/stac/v1/collections/sentinel-1-rtc"
- type "application/json"
1
- rel "parent"
- href "https://planetarycomputer.microsoft.com/api/stac/v1/collections/sentinel-1-rtc"
- type "application/json"
2
- rel "root"
- href "https://planetarycomputer.microsoft.com/api/stac/v1"
- type "application/json"
- title "Microsoft Planetary Computer STAC API"
3
- rel "self"
- href "https://planetarycomputer.microsoft.com/api/stac/v1/collections/sentinel-1-rtc/items/S1A_IW_GRDH_1SDV_20220609T120551_20220609T120616_043586_053436_rtc"
- type "application/geo+json"
4
- rel "license"
- href "https://sentinel.esa.int/documents/247904/690755/Sentinel_Data_Legal_Notice"
5
- rel "derived_from"
- href "https://planetarycomputer.microsoft.com/api/stac/v1/collections/sentinel-1-grd/items/S1A_IW_GRDH_1SDV_20220609T120551_20220609T120616_043586_053436"
- type "application/json"
- title "Sentinel 1 GRD Item"
6
- rel "preview"
- href "https://planetarycomputer.microsoft.com/api/data/v1/item/map?collection=sentinel-1-rtc&item=S1A_IW_GRDH_1SDV_20220609T120551_20220609T120616_043586_053436_rtc"
- type "text/html"
- title "Map of item"
assets
vh
- href "https://sentinel1euwestrtc.blob.core.windows.net/sentinel1-grd-rtc/GRD/2022/6/9/IW/DV/S1A_IW_GRDH_1SDV_20220609T120551_20220609T120616_043586_053436_3A38/measurement/iw-vh.rtc.tiff"
- type "image/tiff; application=geotiff; profile=cloud-optimized"
- title "VH: vertical transmit, horizontal receive"
- description "Terrain-corrected gamma naught values of signal transmitted with vertical polarization and received with horizontal polarization with radiometric terrain correction applied."
- file:size 1849172623
- file:checksum "f3cf342914cb73f3e9e6895d28744b4e"
raster:bands [] 1 items
0
- nodata -32768
- data_type "float32"
- spatial_resolution 10.0
roles [] 1 items
- 0 "data"
vv
- href "https://sentinel1euwestrtc.blob.core.windows.net/sentinel1-grd-rtc/GRD/2022/6/9/IW/DV/S1A_IW_GRDH_1SDV_20220609T120551_20220609T120616_043586_053436_3A38/measurement/iw-vv.rtc.tiff"
- type "image/tiff; application=geotiff; profile=cloud-optimized"
- title "VV: vertical transmit, vertical receive"
- description "Terrain-corrected gamma naught values of signal transmitted with vertical polarization and received with vertical polarization with radiometric terrain correction applied."
- file:size 1856750734
- file:checksum "5fb29759358b5622df056dfcdbcfb31b"
raster:bands [] 1 items
0
- nodata -32768
- data_type "float32"
- spatial_resolution 10.0
roles [] 1 items
- 0 "data"
tilejson
- href "https://planetarycomputer.microsoft.com/api/data/v1/item/tilejson.json?collection=sentinel-1-rtc&item=S1A_IW_GRDH_1SDV_20220609T120551_20220609T120616_043586_053436_rtc&assets=vv&assets=vh&tile_format=png&expression=0.03+%2B+log+%2810e-4+-+log+%280.05+%2F+%280.02+%2B+2+%2A+vv%29%29%29%3B0.05+%2B+exp+%280.25+%2A+%28log+%280.01+%2B+2+%2A+vv%29+%2B+log+%280.02+%2B+5+%2A+vh%29%29%29%3B1+-+log+%280.05+%2F+%280.045+-+0.9+%2A+vv%29%29&asset_as_band=True&rescale=0%2C.8000&rescale=0%2C1.000&rescale=0%2C1.000&format=png"
- type "application/json"
- title "TileJSON with default rendering"
roles [] 1 items
- 0 "tiles"
rendered_preview
- href "https://planetarycomputer.microsoft.com/api/data/v1/item/preview.png?collection=sentinel-1-rtc&item=S1A_IW_GRDH_1SDV_20220609T120551_20220609T120616_043586_053436_rtc&assets=vv&assets=vh&tile_format=png&expression=0.03+%2B+log+%2810e-4+-+log+%280.05+%2F+%280.02+%2B+2+%2A+vv%29%29%29%3B0.05+%2B+exp+%280.25+%2A+%28log+%280.01+%2B+2+%2A+vv%29+%2B+log+%280.02+%2B+5+%2A+vh%29%29%29%3B1+-+log+%280.05+%2F+%280.045+-+0.9+%2A+vv%29%29&asset_as_band=True&rescale=0%2C.8000&rescale=0%2C1.000&rescale=0%2C1.000&format=png"
- type "image/png"
- title "Rendered preview"
- rel "preview"
roles [] 1 items
- 0 "overview"
bbox [] 4 items
- 0 88.21686823
- 1 26.7596103
- 2 90.99273099
- 3 28.68203106
stac_extensions [] 6 items
- 0 "https://stac-extensions.github.io/sar/v1.0.0/schema.json"
- 1 "https://stac-extensions.github.io/sat/v1.0.0/schema.json"
- 2 "https://stac-extensions.github.io/eo/v1.0.0/schema.json"
- 3 "https://stac-extensions.github.io/projection/v1.0.0/schema.json"
- 4 "https://stac-extensions.github.io/file/v2.0.0/schema.json"
- 5 "https://stac-extensions.github.io/raster/v1.1.0/schema.json"
- collection "sentinel-1-rtc"
14
- type "Feature"
- stac_version "1.0.0"
- id "S1A_IW_GRDH_1SDV_20220605T000317_20220605T000342_043520_05323C_rtc"
properties
- datetime "2022-06-05T00:03:29.836741Z"
- platform "SENTINEL-1A"
s1:shape [] 2 items
- 0 27532
- 1 21085
proj:bbox [] 4 items
- 0 524430.0
- 1 2980830.0
- 2 799750.0
- 3 3191680.0
- proj:epsg 32645
proj:shape [] 2 items
- 0 21085
- 1 27532
- end_datetime "2022-06-05 00:03:42.336084+00:00"
- constellation "Sentinel-1"
- s1:resolution "high"
proj:transform [] 9 items
- 0 10.0
- 1 0.0
- 2 524430.0
- 3 0.0
- 4 -10.0
- 5 3191680.0
- 6 0.0
- 7 0.0
- 8 1.0
- s1:datatake_id "340540"
- start_datetime "2022-06-05 00:03:17.337399+00:00"
- s1:orbit_source "RESORB"
- s1:slice_number "12"
- s1:total_slices "17"
- sar:looks_range 5
- sat:orbit_state "descending"
- sar:product_type "GRD"
- sar:looks_azimuth 1
sar:polarizations [] 2 items
- 0 "VV"
- 1 "VH"
- sar:frequency_band "C"
- sat:absolute_orbit 43520
- sat:relative_orbit 48
- s1:processing_level "1"
- sar:instrument_mode "IW"
- sar:center_frequency 5.405
- sar:resolution_range 20
- s1:product_timeliness "Fast-24h"
- sar:resolution_azimuth 22
- sar:pixel_spacing_range 10
- sar:observation_direction "right"
- sar:pixel_spacing_azimuth 10
- sar:looks_equivalent_number 4.4
- s1:instrument_configuration_ID "7"
- sat:platform_international_designator "2014-016A"
geometry
- type "Polygon"
coordinates [] 1 items
0 [] 19 items
0 [] 2 items
- 0 89.8035152
- 1 27.0231237
1 [] 2 items
- 0 89.8288853
- 1 27.2745536
2 [] 2 items
- 0 89.9064227
- 1 27.448429
3 [] 2 items
- 0 89.9211939
- 1 27.6322412
4 [] 2 items
- 0 89.9521143
- 1 27.6784946
5 [] 2 items
- 0 89.9281283
- 1 27.8235189
6 [] 2 items
- 0 89.9438378
- 1 27.9503765
7 [] 2 items
- 0 89.9871338
- 1 28.0027536
8 [] 2 items
- 0 89.9709825
- 1 28.0843779
9 [] 2 items
- 0 89.9972752
- 1 28.1483905
10 [] 2 items
- 0 89.9728269
- 1 28.1916798
11 [] 2 items
- 0 90.0257261
- 1 28.2911827
12 [] 2 items
- 0 90.0494423
- 1 28.4416906
13 [] 2 items
- 0 87.5578155
- 1 28.8402078
14 [] 2 items
- 0 87.4253854
- 1 28.1940788
15 [] 2 items
- 0 87.3048774
- 1 27.3291109
16 [] 2 items
- 0 89.7844681
- 1 26.9226325
17 [] 2 items
- 0 89.7765394
- 1 26.9953737
18 [] 2 items
- 0 89.8035152
- 1 27.0231237
links [] 7 items
0
- rel "collection"
- href "https://planetarycomputer.microsoft.com/api/stac/v1/collections/sentinel-1-rtc"
- type "application/json"
1
- rel "parent"
- href "https://planetarycomputer.microsoft.com/api/stac/v1/collections/sentinel-1-rtc"
- type "application/json"
2
- rel "root"
- href "https://planetarycomputer.microsoft.com/api/stac/v1"
- type "application/json"
- title "Microsoft Planetary Computer STAC API"
3
- rel "self"
- href "https://planetarycomputer.microsoft.com/api/stac/v1/collections/sentinel-1-rtc/items/S1A_IW_GRDH_1SDV_20220605T000317_20220605T000342_043520_05323C_rtc"
- type "application/geo+json"
4
- rel "license"
- href "https://sentinel.esa.int/documents/247904/690755/Sentinel_Data_Legal_Notice"
5
- rel "derived_from"
- href "https://planetarycomputer.microsoft.com/api/stac/v1/collections/sentinel-1-grd/items/S1A_IW_GRDH_1SDV_20220605T000317_20220605T000342_043520_05323C"
- type "application/json"
- title "Sentinel 1 GRD Item"
6
- rel "preview"
- href "https://planetarycomputer.microsoft.com/api/data/v1/item/map?collection=sentinel-1-rtc&item=S1A_IW_GRDH_1SDV_20220605T000317_20220605T000342_043520_05323C_rtc"
- type "text/html"
- title "Map of item"
assets
vh
- href "https://sentinel1euwestrtc.blob.core.windows.net/sentinel1-grd-rtc/GRD/2022/6/5/IW/DV/S1A_IW_GRDH_1SDV_20220605T000317_20220605T000342_043520_05323C_8D59/measurement/iw-vh.rtc.tiff"
- type "image/tiff; application=geotiff; profile=cloud-optimized"
- title "VH: vertical transmit, horizontal receive"
- description "Terrain-corrected gamma naught values of signal transmitted with vertical polarization and received with horizontal polarization with radiometric terrain correction applied."
- file:size 1840514683
- file:checksum "921628446b5df1c85eb2fed15471588d"
raster:bands [] 1 items
0
- nodata -32768
- data_type "float32"
- spatial_resolution 10.0
roles [] 1 items
- 0 "data"
vv
- href "https://sentinel1euwestrtc.blob.core.windows.net/sentinel1-grd-rtc/GRD/2022/6/5/IW/DV/S1A_IW_GRDH_1SDV_20220605T000317_20220605T000342_043520_05323C_8D59/measurement/iw-vv.rtc.tiff"
- type "image/tiff; application=geotiff; profile=cloud-optimized"
- title "VV: vertical transmit, vertical receive"
- description "Terrain-corrected gamma naught values of signal transmitted with vertical polarization and received with vertical polarization with radiometric terrain correction applied."
- file:size 1847526531
- file:checksum "ca11c29d5d33f030432db68a0ca2cb01"
raster:bands [] 1 items
0
- nodata -32768
- data_type "float32"
- spatial_resolution 10.0
roles [] 1 items
- 0 "data"
tilejson
- href "https://planetarycomputer.microsoft.com/api/data/v1/item/tilejson.json?collection=sentinel-1-rtc&item=S1A_IW_GRDH_1SDV_20220605T000317_20220605T000342_043520_05323C_rtc&assets=vv&assets=vh&tile_format=png&expression=0.03+%2B+log+%2810e-4+-+log+%280.05+%2F+%280.02+%2B+2+%2A+vv%29%29%29%3B0.05+%2B+exp+%280.25+%2A+%28log+%280.01+%2B+2+%2A+vv%29+%2B+log+%280.02+%2B+5+%2A+vh%29%29%29%3B1+-+log+%280.05+%2F+%280.045+-+0.9+%2A+vv%29%29&asset_as_band=True&rescale=0%2C.8000&rescale=0%2C1.000&rescale=0%2C1.000&format=png"
- type "application/json"
- title "TileJSON with default rendering"
roles [] 1 items
- 0 "tiles"
rendered_preview
- href "https://planetarycomputer.microsoft.com/api/data/v1/item/preview.png?collection=sentinel-1-rtc&item=S1A_IW_GRDH_1SDV_20220605T000317_20220605T000342_043520_05323C_rtc&assets=vv&assets=vh&tile_format=png&expression=0.03+%2B+log+%2810e-4+-+log+%280.05+%2F+%280.02+%2B+2+%2A+vv%29%29%29%3B0.05+%2B+exp+%280.25+%2A+%28log+%280.01+%2B+2+%2A+vv%29+%2B+log+%280.02+%2B+5+%2A+vh%29%29%29%3B1+-+log+%280.05+%2F+%280.045+-+0.9+%2A+vv%29%29&asset_as_band=True&rescale=0%2C.8000&rescale=0%2C1.000&rescale=0%2C1.000&format=png"
- type "image/png"
- title "Rendered preview"
- rel "preview"
roles [] 1 items
- 0 "overview"
bbox [] 4 items
- 0 87.30487745
- 1 26.92263252
- 2 90.04944227
- 3 28.84020785
stac_extensions [] 6 items
- 0 "https://stac-extensions.github.io/sar/v1.0.0/schema.json"
- 1 "https://stac-extensions.github.io/sat/v1.0.0/schema.json"
- 2 "https://stac-extensions.github.io/eo/v1.0.0/schema.json"
- 3 "https://stac-extensions.github.io/projection/v1.0.0/schema.json"
- 4 "https://stac-extensions.github.io/file/v2.0.0/schema.json"
- 5 "https://stac-extensions.github.io/raster/v1.1.0/schema.json"
- collection "sentinel-1-rtc"
15
- type "Feature"
- stac_version "1.0.0"
- id "S1A_IW_GRDH_1SDV_20220602T121358_20220602T121423_043484_053126_rtc"
properties
- datetime "2022-06-02T12:14:10.897104Z"
- platform "SENTINEL-1A"
s1:shape [] 2 items
- 0 28147
- 1 21599
proj:bbox [] 4 items
- 0 421800.0
- 1 2916210.0
- 2 703270.0
- 3 3132200.0
- proj:epsg 32645
proj:shape [] 2 items
- 0 21599
- 1 28147
- end_datetime "2022-06-02 12:14:23.396823+00:00"
- constellation "Sentinel-1"
- s1:resolution "high"
proj:transform [] 9 items
- 0 10.0
- 1 0.0
- 2 421800.0
- 3 0.0
- 4 -10.0
- 5 3132200.0
- 6 0.0
- 7 0.0
- 8 1.0
- s1:datatake_id "340262"
- start_datetime "2022-06-02 12:13:58.397386+00:00"
- s1:orbit_source "RESORB"
- s1:slice_number "6"
- s1:total_slices "20"
- sar:looks_range 5
- sat:orbit_state "ascending"
- sar:product_type "GRD"
- sar:looks_azimuth 1
sar:polarizations [] 2 items
- 0 "VV"
- 1 "VH"
- sar:frequency_band "C"
- sat:absolute_orbit 43484
- sat:relative_orbit 12
- s1:processing_level "1"
- sar:instrument_mode "IW"
- sar:center_frequency 5.405
- sar:resolution_range 20
- s1:product_timeliness "Fast-24h"
- sar:resolution_azimuth 22
- sar:pixel_spacing_range 10
- sar:observation_direction "right"
- sar:pixel_spacing_azimuth 10
- sar:looks_equivalent_number 4.4
- s1:instrument_configuration_ID "7"
- sat:platform_international_designator "2014-016A"
geometry
- type "Polygon"
coordinates [] 1 items
0 [] 15 items
0 [] 2 items
- 0 86.2058139
- 1 27.8439567
1 [] 2 items
- 0 86.2095097
- 1 27.7823683
2 [] 2 items
- 0 86.2342811
- 1 27.7815148
3 [] 2 items
- 0 86.2158898
- 1 27.7560455
4 [] 2 items
- 0 86.2702649
- 1 27.697305
5 [] 2 items
- 0 86.2769672
- 1 27.4642518
6 [] 2 items
- 0 86.3264828
- 1 27.3765704
7 [] 2 items
- 0 86.3181683
- 1 27.2313625
8 [] 2 items
- 0 86.3549312
- 1 27.1610279
9 [] 2 items
- 0 86.4984761
- 1 26.3664126
10 [] 2 items
- 0 88.984064
- 1 26.7768155
11 [] 2 items
- 0 88.9220304
- 1 27.3274159
12 [] 2 items
- 0 88.7375399
- 1 28.2895256
13 [] 2 items
- 0 86.2107705
- 1 27.881718
14 [] 2 items
- 0 86.2058139
- 1 27.8439567
links [] 7 items
0
- rel "collection"
- href "https://planetarycomputer.microsoft.com/api/stac/v1/collections/sentinel-1-rtc"
- type "application/json"
1
- rel "parent"
- href "https://planetarycomputer.microsoft.com/api/stac/v1/collections/sentinel-1-rtc"
- type "application/json"
2
- rel "root"
- href "https://planetarycomputer.microsoft.com/api/stac/v1"
- type "application/json"
- title "Microsoft Planetary Computer STAC API"
3
- rel "self"
- href "https://planetarycomputer.microsoft.com/api/stac/v1/collections/sentinel-1-rtc/items/S1A_IW_GRDH_1SDV_20220602T121358_20220602T121423_043484_053126_rtc"
- type "application/geo+json"
4
- rel "license"
- href "https://sentinel.esa.int/documents/247904/690755/Sentinel_Data_Legal_Notice"
5
- rel "derived_from"
- href "https://planetarycomputer.microsoft.com/api/stac/v1/collections/sentinel-1-grd/items/S1A_IW_GRDH_1SDV_20220602T121358_20220602T121423_043484_053126"
- type "application/json"
- title "Sentinel 1 GRD Item"
6
- rel "preview"
- href "https://planetarycomputer.microsoft.com/api/data/v1/item/map?collection=sentinel-1-rtc&item=S1A_IW_GRDH_1SDV_20220602T121358_20220602T121423_043484_053126_rtc"
- type "text/html"
- title "Map of item"
assets
vh
- href "https://sentinel1euwestrtc.blob.core.windows.net/sentinel1-grd-rtc/GRD/2022/6/2/IW/DV/S1A_IW_GRDH_1SDV_20220602T121358_20220602T121423_043484_053126_4E1C/measurement/iw-vh.rtc.tiff"
- type "image/tiff; application=geotiff; profile=cloud-optimized"
- title "VH: vertical transmit, horizontal receive"
- description "Terrain-corrected gamma naught values of signal transmitted with vertical polarization and received with horizontal polarization with radiometric terrain correction applied."
- file:size 1865022621
- file:checksum "914372d96022b72155e6136d84a33a38"
raster:bands [] 1 items
0
- nodata -32768
- data_type "float32"
- spatial_resolution 10.0
roles [] 1 items
- 0 "data"
vv
- href "https://sentinel1euwestrtc.blob.core.windows.net/sentinel1-grd-rtc/GRD/2022/6/2/IW/DV/S1A_IW_GRDH_1SDV_20220602T121358_20220602T121423_043484_053126_4E1C/measurement/iw-vv.rtc.tiff"
- type "image/tiff; application=geotiff; profile=cloud-optimized"
- title "VV: vertical transmit, vertical receive"
- description "Terrain-corrected gamma naught values of signal transmitted with vertical polarization and received with vertical polarization with radiometric terrain correction applied."
- file:size 1872655875
- file:checksum "a79077dba129fe886ea3a6d49a13f8fa"
raster:bands [] 1 items
0
- nodata -32768
- data_type "float32"
- spatial_resolution 10.0
roles [] 1 items
- 0 "data"
tilejson
- href "https://planetarycomputer.microsoft.com/api/data/v1/item/tilejson.json?collection=sentinel-1-rtc&item=S1A_IW_GRDH_1SDV_20220602T121358_20220602T121423_043484_053126_rtc&assets=vv&assets=vh&tile_format=png&expression=0.03+%2B+log+%2810e-4+-+log+%280.05+%2F+%280.02+%2B+2+%2A+vv%29%29%29%3B0.05+%2B+exp+%280.25+%2A+%28log+%280.01+%2B+2+%2A+vv%29+%2B+log+%280.02+%2B+5+%2A+vh%29%29%29%3B1+-+log+%280.05+%2F+%280.045+-+0.9+%2A+vv%29%29&asset_as_band=True&rescale=0%2C.8000&rescale=0%2C1.000&rescale=0%2C1.000&format=png"
- type "application/json"
- title "TileJSON with default rendering"
roles [] 1 items
- 0 "tiles"
rendered_preview
- href "https://planetarycomputer.microsoft.com/api/data/v1/item/preview.png?collection=sentinel-1-rtc&item=S1A_IW_GRDH_1SDV_20220602T121358_20220602T121423_043484_053126_rtc&assets=vv&assets=vh&tile_format=png&expression=0.03+%2B+log+%2810e-4+-+log+%280.05+%2F+%280.02+%2B+2+%2A+vv%29%29%29%3B0.05+%2B+exp+%280.25+%2A+%28log+%280.01+%2B+2+%2A+vv%29+%2B+log+%280.02+%2B+5+%2A+vh%29%29%29%3B1+-+log+%280.05+%2F+%280.045+-+0.9+%2A+vv%29%29&asset_as_band=True&rescale=0%2C.8000&rescale=0%2C1.000&rescale=0%2C1.000&format=png"
- type "image/png"
- title "Rendered preview"
- rel "preview"
roles [] 1 items
- 0 "overview"
bbox [] 4 items
- 0 86.20581389
- 1 26.36641257
- 2 88.98406404
- 3 28.28952559
stac_extensions [] 6 items
- 0 "https://stac-extensions.github.io/sar/v1.0.0/schema.json"
- 1 "https://stac-extensions.github.io/sat/v1.0.0/schema.json"
- 2 "https://stac-extensions.github.io/eo/v1.0.0/schema.json"
- 3 "https://stac-extensions.github.io/projection/v1.0.0/schema.json"
- 4 "https://stac-extensions.github.io/file/v2.0.0/schema.json"
- 5 "https://stac-extensions.github.io/raster/v1.1.0/schema.json"
- collection "sentinel-1-rtc"
16
- type "Feature"
- stac_version "1.0.0"
- id "S1A_IW_GRDH_1SDV_20220528T120550_20220528T120615_043411_052F0A_rtc"
properties
- datetime "2022-05-28T12:06:03.110968Z"
- platform "SENTINEL-1A"
s1:shape [] 2 items
- 0 28424
- 1 21971
proj:bbox [] 4 items
- 0 618210.0
- 1 2960440.0
- 2 902450.0
- 3 3180150.0
- proj:epsg 32645
proj:shape [] 2 items
- 0 21971
- 1 28424
- end_datetime "2022-05-28 12:06:15.610707+00:00"
- constellation "Sentinel-1"
- s1:resolution "high"
proj:transform [] 9 items
- 0 10.0
- 1 0.0
- 2 618210.0
- 3 0.0
- 4 -10.0
- 5 3180150.0
- 6 0.0
- 7 0.0
- 8 1.0
- s1:datatake_id "339722"
- start_datetime "2022-05-28 12:05:50.611230+00:00"
- s1:orbit_source "RESORB"
- s1:slice_number "6"
- s1:total_slices "21"
- sar:looks_range 5
- sat:orbit_state "ascending"
- sar:product_type "GRD"
- sar:looks_azimuth 1
sar:polarizations [] 2 items
- 0 "VV"
- 1 "VH"
- sar:frequency_band "C"
- sat:absolute_orbit 43411
- sat:relative_orbit 114
- s1:processing_level "1"
- sar:instrument_mode "IW"
- sar:center_frequency 5.405
- sar:resolution_range 20
- s1:product_timeliness "Fast-24h"
- sar:resolution_azimuth 22
- sar:pixel_spacing_range 10
- sar:observation_direction "right"
- sar:pixel_spacing_azimuth 10
- sar:looks_equivalent_number 4.4
- s1:instrument_configuration_ID "7"
- sat:platform_international_designator "2014-016A"
geometry
- type "Polygon"
coordinates [] 1 items
0 [] 14 items
0 [] 2 items
- 0 89.9800177
- 1 27.0121886
1 [] 2 items
- 0 90.9936373
- 1 27.1728369
2 [] 2 items
- 0 90.7247527
- 1 28.6819185
3 [] 2 items
- 0 88.2178877
- 1 28.2798509
4 [] 2 items
- 0 88.3555779
- 1 27.7231918
5 [] 2 items
- 0 88.3301602
- 1 27.5842521
6 [] 2 items
- 0 88.3766964
- 1 27.5223288
7 [] 2 items
- 0 88.3584964
- 1 27.4087735
8 [] 2 items
- 0 88.4006772
- 1 27.3368659
9 [] 2 items
- 0 88.3794291
- 1 27.302415
10 [] 2 items
- 0 88.4162094
- 1 27.2067258
11 [] 2 items
- 0 88.4045457
- 1 27.0894946
12 [] 2 items
- 0 88.4755329
- 1 26.7596009
13 [] 2 items
- 0 89.9800177
- 1 27.0121886
links [] 7 items
0
- rel "collection"
- href "https://planetarycomputer.microsoft.com/api/stac/v1/collections/sentinel-1-rtc"
- type "application/json"
1
- rel "parent"
- href "https://planetarycomputer.microsoft.com/api/stac/v1/collections/sentinel-1-rtc"
- type "application/json"
2
- rel "root"
- href "https://planetarycomputer.microsoft.com/api/stac/v1"
- type "application/json"
- title "Microsoft Planetary Computer STAC API"
3
- rel "self"
- href "https://planetarycomputer.microsoft.com/api/stac/v1/collections/sentinel-1-rtc/items/S1A_IW_GRDH_1SDV_20220528T120550_20220528T120615_043411_052F0A_rtc"
- type "application/geo+json"
4
- rel "license"
- href "https://sentinel.esa.int/documents/247904/690755/Sentinel_Data_Legal_Notice"
5
- rel "derived_from"
- href "https://planetarycomputer.microsoft.com/api/stac/v1/collections/sentinel-1-grd/items/S1A_IW_GRDH_1SDV_20220528T120550_20220528T120615_043411_052F0A"
- type "application/json"
- title "Sentinel 1 GRD Item"
6
- rel "preview"
- href "https://planetarycomputer.microsoft.com/api/data/v1/item/map?collection=sentinel-1-rtc&item=S1A_IW_GRDH_1SDV_20220528T120550_20220528T120615_043411_052F0A_rtc"
- type "text/html"
- title "Map of item"
assets
vh
- href "https://sentinel1euwestrtc.blob.core.windows.net/sentinel1-grd-rtc/GRD/2022/5/28/IW/DV/S1A_IW_GRDH_1SDV_20220528T120550_20220528T120615_043411_052F0A_0446/measurement/iw-vh.rtc.tiff"
- type "image/tiff; application=geotiff; profile=cloud-optimized"
- title "VH: vertical transmit, horizontal receive"
- description "Terrain-corrected gamma naught values of signal transmitted with vertical polarization and received with horizontal polarization with radiometric terrain correction applied."
- file:size 1850730748
- file:checksum "bc70bafede30bbdf5fb2fb82fb4461ce"
raster:bands [] 1 items
0
- nodata -32768
- data_type "float32"
- spatial_resolution 10.0
roles [] 1 items
- 0 "data"
vv
- href "https://sentinel1euwestrtc.blob.core.windows.net/sentinel1-grd-rtc/GRD/2022/5/28/IW/DV/S1A_IW_GRDH_1SDV_20220528T120550_20220528T120615_043411_052F0A_0446/measurement/iw-vv.rtc.tiff"
- type "image/tiff; application=geotiff; profile=cloud-optimized"
- title "VV: vertical transmit, vertical receive"
- description "Terrain-corrected gamma naught values of signal transmitted with vertical polarization and received with vertical polarization with radiometric terrain correction applied."
- file:size 1858400097
- file:checksum "d582bf5f3ff6999d49eb3460d2db14ea"
raster:bands [] 1 items
0
- nodata -32768
- data_type "float32"
- spatial_resolution 10.0
roles [] 1 items
- 0 "data"
tilejson
- href "https://planetarycomputer.microsoft.com/api/data/v1/item/tilejson.json?collection=sentinel-1-rtc&item=S1A_IW_GRDH_1SDV_20220528T120550_20220528T120615_043411_052F0A_rtc&assets=vv&assets=vh&tile_format=png&expression=0.03+%2B+log+%2810e-4+-+log+%280.05+%2F+%280.02+%2B+2+%2A+vv%29%29%29%3B0.05+%2B+exp+%280.25+%2A+%28log+%280.01+%2B+2+%2A+vv%29+%2B+log+%280.02+%2B+5+%2A+vh%29%29%29%3B1+-+log+%280.05+%2F+%280.045+-+0.9+%2A+vv%29%29&asset_as_band=True&rescale=0%2C.8000&rescale=0%2C1.000&rescale=0%2C1.000&format=png"
- type "application/json"
- title "TileJSON with default rendering"
roles [] 1 items
- 0 "tiles"
rendered_preview
- href "https://planetarycomputer.microsoft.com/api/data/v1/item/preview.png?collection=sentinel-1-rtc&item=S1A_IW_GRDH_1SDV_20220528T120550_20220528T120615_043411_052F0A_rtc&assets=vv&assets=vh&tile_format=png&expression=0.03+%2B+log+%2810e-4+-+log+%280.05+%2F+%280.02+%2B+2+%2A+vv%29%29%29%3B0.05+%2B+exp+%280.25+%2A+%28log+%280.01+%2B+2+%2A+vv%29+%2B+log+%280.02+%2B+5+%2A+vh%29%29%29%3B1+-+log+%280.05+%2F+%280.045+-+0.9+%2A+vv%29%29&asset_as_band=True&rescale=0%2C.8000&rescale=0%2C1.000&rescale=0%2C1.000&format=png"
- type "image/png"
- title "Rendered preview"
- rel "preview"
roles [] 1 items
- 0 "overview"
bbox [] 4 items
- 0 88.21788771
- 1 26.75960088
- 2 90.99363729
- 3 28.68191847
stac_extensions [] 6 items
- 0 "https://stac-extensions.github.io/sar/v1.0.0/schema.json"
- 1 "https://stac-extensions.github.io/sat/v1.0.0/schema.json"
- 2 "https://stac-extensions.github.io/eo/v1.0.0/schema.json"
- 3 "https://stac-extensions.github.io/projection/v1.0.0/schema.json"
- 4 "https://stac-extensions.github.io/file/v2.0.0/schema.json"
- 5 "https://stac-extensions.github.io/raster/v1.1.0/schema.json"
- collection "sentinel-1-rtc"
17
- type "Feature"
- stac_version "1.0.0"
- id "S1A_IW_GRDH_1SDV_20220521T121357_20220521T121422_043309_052C00_rtc"
properties
- datetime "2022-05-21T12:14:09.786375Z"
- platform "SENTINEL-1A"
s1:shape [] 2 items
- 0 28153
- 1 21599
proj:bbox [] 4 items
- 0 421860.0
- 1 2916220.0
- 2 703390.0
- 3 3132210.0
- proj:epsg 32645
proj:shape [] 2 items
- 0 21599
- 1 28153
- end_datetime "2022-05-21 12:14:22.285304+00:00"
- constellation "Sentinel-1"
- s1:resolution "high"
proj:transform [] 9 items
- 0 10.0
- 1 0.0
- 2 421860.0
- 3 0.0
- 4 -10.0
- 5 3132210.0
- 6 0.0
- 7 0.0
- 8 1.0
- s1:datatake_id "338944"
- start_datetime "2022-05-21 12:13:57.287447+00:00"
- s1:orbit_source "RESORB"
- s1:slice_number "6"
- s1:total_slices "20"
- sar:looks_range 5
- sat:orbit_state "ascending"
- sar:product_type "GRD"
- sar:looks_azimuth 1
sar:polarizations [] 2 items
- 0 "VV"
- 1 "VH"
- sar:frequency_band "C"
- sat:absolute_orbit 43309
- sat:relative_orbit 12
- s1:processing_level "1"
- sar:instrument_mode "IW"
- sar:center_frequency 5.405
- sar:resolution_range 20
- s1:product_timeliness "Fast-24h"
- sar:resolution_azimuth 22
- sar:pixel_spacing_range 10
- sar:observation_direction "right"
- sar:pixel_spacing_azimuth 10
- sar:looks_equivalent_number 4.4
- s1:instrument_configuration_ID "7"
- sat:platform_international_designator "2014-016A"
geometry
- type "Polygon"
coordinates [] 1 items
0 [] 15 items
0 [] 2 items
- 0 86.2064206
- 1 27.8443213
1 [] 2 items
- 0 86.210615
- 1 27.7839092
2 [] 2 items
- 0 86.2351945
- 1 27.7815198
3 [] 2 items
- 0 86.2173116
- 1 27.755873
4 [] 2 items
- 0 86.2718852
- 1 27.6976746
5 [] 2 items
- 0 86.2789888
- 1 27.4646234
6 [] 2 items
- 0 86.3289065
- 1 27.3771237
7 [] 2 items
- 0 86.3192737
- 1 27.2322706
8 [] 2 items
- 0 86.372935
- 1 27.0818426
9 [] 2 items
- 0 86.4998786
- 1 26.3665981
10 [] 2 items
- 0 88.9852736
- 1 26.7769791
11 [] 2 items
- 0 88.9228496
- 1 27.3280364
12 [] 2 items
- 0 88.7390703
- 1 28.2895964
13 [] 2 items
- 0 86.2114822
- 1 27.8816318
14 [] 2 items
- 0 86.2064206
- 1 27.8443213
links [] 7 items
0
- rel "collection"
- href "https://planetarycomputer.microsoft.com/api/stac/v1/collections/sentinel-1-rtc"
- type "application/json"
1
- rel "parent"
- href "https://planetarycomputer.microsoft.com/api/stac/v1/collections/sentinel-1-rtc"
- type "application/json"
2
- rel "root"
- href "https://planetarycomputer.microsoft.com/api/stac/v1"
- type "application/json"
- title "Microsoft Planetary Computer STAC API"
3
- rel "self"
- href "https://planetarycomputer.microsoft.com/api/stac/v1/collections/sentinel-1-rtc/items/S1A_IW_GRDH_1SDV_20220521T121357_20220521T121422_043309_052C00_rtc"
- type "application/geo+json"
4
- rel "license"
- href "https://sentinel.esa.int/documents/247904/690755/Sentinel_Data_Legal_Notice"
5
- rel "derived_from"
- href "https://planetarycomputer.microsoft.com/api/stac/v1/collections/sentinel-1-grd/items/S1A_IW_GRDH_1SDV_20220521T121357_20220521T121422_043309_052C00"
- type "application/json"
- title "Sentinel 1 GRD Item"
6
- rel "preview"
- href "https://planetarycomputer.microsoft.com/api/data/v1/item/map?collection=sentinel-1-rtc&item=S1A_IW_GRDH_1SDV_20220521T121357_20220521T121422_043309_052C00_rtc"
- type "text/html"
- title "Map of item"
assets
vh
- href "https://sentinel1euwestrtc.blob.core.windows.net/sentinel1-grd-rtc/GRD/2022/5/21/IW/DV/S1A_IW_GRDH_1SDV_20220521T121357_20220521T121422_043309_052C00_4F15/measurement/iw-vh.rtc.tiff"
- type "image/tiff; application=geotiff; profile=cloud-optimized"
- title "VH: vertical transmit, horizontal receive"
- description "Terrain-corrected gamma naught values of signal transmitted with vertical polarization and received with horizontal polarization with radiometric terrain correction applied."
- file:size 1865470343
- file:checksum "9a148c01c3d76af29f239998b25907ad"
raster:bands [] 1 items
0
- nodata -32768
- data_type "float32"
- spatial_resolution 10.0
roles [] 1 items
- 0 "data"
vv
- href "https://sentinel1euwestrtc.blob.core.windows.net/sentinel1-grd-rtc/GRD/2022/5/21/IW/DV/S1A_IW_GRDH_1SDV_20220521T121357_20220521T121422_043309_052C00_4F15/measurement/iw-vv.rtc.tiff"
- type "image/tiff; application=geotiff; profile=cloud-optimized"
- title "VV: vertical transmit, vertical receive"
- description "Terrain-corrected gamma naught values of signal transmitted with vertical polarization and received with vertical polarization with radiometric terrain correction applied."
- file:size 1872975938
- file:checksum "0ee0d8b9d3d0e4f4c1864942a0b56c0f"
raster:bands [] 1 items
0
- nodata -32768
- data_type "float32"
- spatial_resolution 10.0
roles [] 1 items
- 0 "data"
tilejson
- href "https://planetarycomputer.microsoft.com/api/data/v1/item/tilejson.json?collection=sentinel-1-rtc&item=S1A_IW_GRDH_1SDV_20220521T121357_20220521T121422_043309_052C00_rtc&assets=vv&assets=vh&tile_format=png&expression=0.03+%2B+log+%2810e-4+-+log+%280.05+%2F+%280.02+%2B+2+%2A+vv%29%29%29%3B0.05+%2B+exp+%280.25+%2A+%28log+%280.01+%2B+2+%2A+vv%29+%2B+log+%280.02+%2B+5+%2A+vh%29%29%29%3B1+-+log+%280.05+%2F+%280.045+-+0.9+%2A+vv%29%29&asset_as_band=True&rescale=0%2C.8000&rescale=0%2C1.000&rescale=0%2C1.000&format=png"
- type "application/json"
- title "TileJSON with default rendering"
roles [] 1 items
- 0 "tiles"
rendered_preview
- href "https://planetarycomputer.microsoft.com/api/data/v1/item/preview.png?collection=sentinel-1-rtc&item=S1A_IW_GRDH_1SDV_20220521T121357_20220521T121422_043309_052C00_rtc&assets=vv&assets=vh&tile_format=png&expression=0.03+%2B+log+%2810e-4+-+log+%280.05+%2F+%280.02+%2B+2+%2A+vv%29%29%29%3B0.05+%2B+exp+%280.25+%2A+%28log+%280.01+%2B+2+%2A+vv%29+%2B+log+%280.02+%2B+5+%2A+vh%29%29%29%3B1+-+log+%280.05+%2F+%280.045+-+0.9+%2A+vv%29%29&asset_as_band=True&rescale=0%2C.8000&rescale=0%2C1.000&rescale=0%2C1.000&format=png"
- type "image/png"
- title "Rendered preview"
- rel "preview"
roles [] 1 items
- 0 "overview"
bbox [] 4 items
- 0 86.20642056
- 1 26.36659805
- 2 88.98527357
- 3 28.28959635
stac_extensions [] 6 items
- 0 "https://stac-extensions.github.io/sar/v1.0.0/schema.json"
- 1 "https://stac-extensions.github.io/sat/v1.0.0/schema.json"
- 2 "https://stac-extensions.github.io/eo/v1.0.0/schema.json"
- 3 "https://stac-extensions.github.io/projection/v1.0.0/schema.json"
- 4 "https://stac-extensions.github.io/file/v2.0.0/schema.json"
- 5 "https://stac-extensions.github.io/raster/v1.1.0/schema.json"
- collection "sentinel-1-rtc"
18
- type "Feature"
- stac_version "1.0.0"
- id "S1A_IW_GRDH_1SDV_20220516T120549_20220516T120614_043236_0529DD_rtc"
properties
- datetime "2022-05-16T12:06:02.314833Z"
- platform "SENTINEL-1A"
s1:shape [] 2 items
- 0 28422
- 1 21971
proj:bbox [] 4 items
- 0 618240.0
- 1 2960440.0
- 2 902460.0
- 3 3180150.0
- proj:epsg 32645
proj:shape [] 2 items
- 0 21971
- 1 28422
- end_datetime "2022-05-16 12:06:14.814536+00:00"
- constellation "Sentinel-1"
- s1:resolution "high"
proj:transform [] 9 items
- 0 10.0
- 1 0.0
- 2 618240.0
- 3 0.0
- 4 -10.0
- 5 3180150.0
- 6 0.0
- 7 0.0
- 8 1.0
- s1:datatake_id "338397"
- start_datetime "2022-05-16 12:05:49.815129+00:00"
- s1:orbit_source "RESORB"
- s1:slice_number "6"
- s1:total_slices "21"
- sar:looks_range 5
- sat:orbit_state "ascending"
- sar:product_type "GRD"
- sar:looks_azimuth 1
sar:polarizations [] 2 items
- 0 "VV"
- 1 "VH"
- sar:frequency_band "C"
- sat:absolute_orbit 43236
- sat:relative_orbit 114
- s1:processing_level "1"
- sar:instrument_mode "IW"
- sar:center_frequency 5.405
- sar:resolution_range 20
- s1:product_timeliness "Fast-24h"
- sar:resolution_azimuth 22
- sar:pixel_spacing_range 10
- sar:observation_direction "right"
- sar:pixel_spacing_azimuth 10
- sar:looks_equivalent_number 4.4
- s1:instrument_configuration_ID "7"
- sat:platform_international_designator "2014-016A"
geometry
- type "Polygon"
coordinates [] 1 items
0 [] 14 items
0 [] 2 items
- 0 89.980219
- 1 27.0121844
1 [] 2 items
- 0 90.993738
- 1 27.172834
2 [] 2 items
- 0 90.7250591
- 1 28.68191
3 [] 2 items
- 0 88.2181946
- 1 28.2799384
4 [] 2 items
- 0 88.356085
- 1 27.7231868
5 [] 2 items
- 0 88.330365
- 1 27.5844306
6 [] 2 items
- 0 88.3771013
- 1 27.5223248
7 [] 2 items
- 0 88.3588031
- 1 27.4090413
8 [] 2 items
- 0 88.4009815
- 1 27.3369532
9 [] 2 items
- 0 88.3795301
- 1 27.302414
10 [] 2 items
- 0 88.4165065
- 1 27.2062715
11 [] 2 items
- 0 88.4048493
- 1 27.0895819
12 [] 2 items
- 0 88.4758345
- 1 26.7595977
13 [] 2 items
- 0 89.980219
- 1 27.0121844
links [] 7 items
0
- rel "collection"
- href "https://planetarycomputer.microsoft.com/api/stac/v1/collections/sentinel-1-rtc"
- type "application/json"
1
- rel "parent"
- href "https://planetarycomputer.microsoft.com/api/stac/v1/collections/sentinel-1-rtc"
- type "application/json"
2
- rel "root"
- href "https://planetarycomputer.microsoft.com/api/stac/v1"
- type "application/json"
- title "Microsoft Planetary Computer STAC API"
3
- rel "self"
- href "https://planetarycomputer.microsoft.com/api/stac/v1/collections/sentinel-1-rtc/items/S1A_IW_GRDH_1SDV_20220516T120549_20220516T120614_043236_0529DD_rtc"
- type "application/geo+json"
4
- rel "license"
- href "https://sentinel.esa.int/documents/247904/690755/Sentinel_Data_Legal_Notice"
5
- rel "derived_from"
- href "https://planetarycomputer.microsoft.com/api/stac/v1/collections/sentinel-1-grd/items/S1A_IW_GRDH_1SDV_20220516T120549_20220516T120614_043236_0529DD"
- type "application/json"
- title "Sentinel 1 GRD Item"
6
- rel "preview"
- href "https://planetarycomputer.microsoft.com/api/data/v1/item/map?collection=sentinel-1-rtc&item=S1A_IW_GRDH_1SDV_20220516T120549_20220516T120614_043236_0529DD_rtc"
- type "text/html"
- title "Map of item"
assets
vh
- href "https://sentinel1euwestrtc.blob.core.windows.net/sentinel1-grd-rtc/GRD/2022/5/16/IW/DV/S1A_IW_GRDH_1SDV_20220516T120549_20220516T120614_043236_0529DD_A510/measurement/iw-vh.rtc.tiff"
- type "image/tiff; application=geotiff; profile=cloud-optimized"
- title "VH: vertical transmit, horizontal receive"
- description "Terrain-corrected gamma naught values of signal transmitted with vertical polarization and received with horizontal polarization with radiometric terrain correction applied."
- file:size 1850677121
- file:checksum "e6dd6168ee38d3a32f27a2a65775aece"
raster:bands [] 1 items
0
- nodata -32768
- data_type "float32"
- spatial_resolution 10.0
roles [] 1 items
- 0 "data"
vv
- href "https://sentinel1euwestrtc.blob.core.windows.net/sentinel1-grd-rtc/GRD/2022/5/16/IW/DV/S1A_IW_GRDH_1SDV_20220516T120549_20220516T120614_043236_0529DD_A510/measurement/iw-vv.rtc.tiff"
- type "image/tiff; application=geotiff; profile=cloud-optimized"
- title "VV: vertical transmit, vertical receive"
- description "Terrain-corrected gamma naught values of signal transmitted with vertical polarization and received with vertical polarization with radiometric terrain correction applied."
- file:size 1858485456
- file:checksum "ed2e0e07f98c2a3e458fe81168d0f149"
raster:bands [] 1 items
0
- nodata -32768
- data_type "float32"
- spatial_resolution 10.0
roles [] 1 items
- 0 "data"
tilejson
- href "https://planetarycomputer.microsoft.com/api/data/v1/item/tilejson.json?collection=sentinel-1-rtc&item=S1A_IW_GRDH_1SDV_20220516T120549_20220516T120614_043236_0529DD_rtc&assets=vv&assets=vh&tile_format=png&expression=0.03+%2B+log+%2810e-4+-+log+%280.05+%2F+%280.02+%2B+2+%2A+vv%29%29%29%3B0.05+%2B+exp+%280.25+%2A+%28log+%280.01+%2B+2+%2A+vv%29+%2B+log+%280.02+%2B+5+%2A+vh%29%29%29%3B1+-+log+%280.05+%2F+%280.045+-+0.9+%2A+vv%29%29&asset_as_band=True&rescale=0%2C.8000&rescale=0%2C1.000&rescale=0%2C1.000&format=png"
- type "application/json"
- title "TileJSON with default rendering"
roles [] 1 items
- 0 "tiles"
rendered_preview
- href "https://planetarycomputer.microsoft.com/api/data/v1/item/preview.png?collection=sentinel-1-rtc&item=S1A_IW_GRDH_1SDV_20220516T120549_20220516T120614_043236_0529DD_rtc&assets=vv&assets=vh&tile_format=png&expression=0.03+%2B+log+%2810e-4+-+log+%280.05+%2F+%280.02+%2B+2+%2A+vv%29%29%29%3B0.05+%2B+exp+%280.25+%2A+%28log+%280.01+%2B+2+%2A+vv%29+%2B+log+%280.02+%2B+5+%2A+vh%29%29%29%3B1+-+log+%280.05+%2F+%280.045+-+0.9+%2A+vv%29%29&asset_as_band=True&rescale=0%2C.8000&rescale=0%2C1.000&rescale=0%2C1.000&format=png"
- type "image/png"
- title "Rendered preview"
- rel "preview"
roles [] 1 items
- 0 "overview"
bbox [] 4 items
- 0 88.21819458
- 1 26.75959774
- 2 90.99373799
- 3 28.68191003
stac_extensions [] 6 items
- 0 "https://stac-extensions.github.io/sar/v1.0.0/schema.json"
- 1 "https://stac-extensions.github.io/sat/v1.0.0/schema.json"
- 2 "https://stac-extensions.github.io/eo/v1.0.0/schema.json"
- 3 "https://stac-extensions.github.io/projection/v1.0.0/schema.json"
- 4 "https://stac-extensions.github.io/file/v2.0.0/schema.json"
- 5 "https://stac-extensions.github.io/raster/v1.1.0/schema.json"
- collection "sentinel-1-rtc"
19
- type "Feature"
- stac_version "1.0.0"
- id "S1A_IW_GRDH_1SDV_20220509T121356_20220509T121421_043134_0526C4_rtc"
properties
- datetime "2022-05-09T12:14:08.980398Z"
- platform "SENTINEL-1A"
s1:shape [] 2 items
- 0 28152
- 1 21599
proj:bbox [] 4 items
- 0 421850.0
- 1 2916220.0
- 2 703370.0
- 3 3132210.0
- proj:epsg 32645
proj:shape [] 2 items
- 0 21599
- 1 28152
- end_datetime "2022-05-09 12:14:21.479341+00:00"
- constellation "Sentinel-1"
- s1:resolution "high"
proj:transform [] 9 items
- 0 10.0
- 1 0.0
- 2 421850.0
- 3 0.0
- 4 -10.0
- 5 3132210.0
- 6 0.0
- 7 0.0
- 8 1.0
- s1:datatake_id "337604"
- start_datetime "2022-05-09 12:13:56.481455+00:00"
- s1:orbit_source "RESORB"
- s1:slice_number "6"
- s1:total_slices "20"
- sar:looks_range 5
- sat:orbit_state "ascending"
- sar:product_type "GRD"
- sar:looks_azimuth 1
sar:polarizations [] 2 items
- 0 "VV"
- 1 "VH"
- sar:frequency_band "C"
- sat:absolute_orbit 43134
- sat:relative_orbit 12
- s1:processing_level "1"
- sar:instrument_mode "IW"
- sar:center_frequency 5.405
- sar:resolution_range 20
- s1:product_timeliness "Fast-24h"
- sar:resolution_azimuth 22
- sar:pixel_spacing_range 10
- sar:observation_direction "right"
- sar:pixel_spacing_azimuth 10
- sar:looks_equivalent_number 4.4
- s1:instrument_configuration_ID "7"
- sat:platform_international_designator "2014-016A"
geometry
- type "Polygon"
coordinates [] 1 items
0 [] 15 items
0 [] 2 items
- 0 86.2063197
- 1 27.8442304
1 [] 2 items
- 0 86.210414
- 1 27.7836373
2 [] 2 items
- 0 86.2349909
- 1 27.781609
3 [] 2 items
- 0 86.2170066
- 1 27.7559615
4 [] 2 items
- 0 86.2715809
- 1 27.697673
5 [] 2 items
- 0 86.2783816
- 1 27.4646203
6 [] 2 items
- 0 86.3287048
- 1 27.3770325
7 [] 2 items
- 0 86.3190728
- 1 27.2320891
8 [] 2 items
- 0 86.3725311
- 1 27.0819311
9 [] 2 items
- 0 86.4995783
- 1 26.3665067
10 [] 2 items
- 0 88.9850709
- 1 26.7768917
11 [] 2 items
- 0 88.922747
- 1 27.3279475
12 [] 2 items
- 0 88.7387631
- 1 28.28951
13 [] 2 items
- 0 86.2114822
- 1 27.8816318
14 [] 2 items
- 0 86.2063197
- 1 27.8442304
links [] 7 items
0
- rel "collection"
- href "https://planetarycomputer.microsoft.com/api/stac/v1/collections/sentinel-1-rtc"
- type "application/json"
1
- rel "parent"
- href "https://planetarycomputer.microsoft.com/api/stac/v1/collections/sentinel-1-rtc"
- type "application/json"
2
- rel "root"
- href "https://planetarycomputer.microsoft.com/api/stac/v1"
- type "application/json"
- title "Microsoft Planetary Computer STAC API"
3
- rel "self"
- href "https://planetarycomputer.microsoft.com/api/stac/v1/collections/sentinel-1-rtc/items/S1A_IW_GRDH_1SDV_20220509T121356_20220509T121421_043134_0526C4_rtc"
- type "application/geo+json"
4
- rel "license"
- href "https://sentinel.esa.int/documents/247904/690755/Sentinel_Data_Legal_Notice"
5
- rel "derived_from"
- href "https://planetarycomputer.microsoft.com/api/stac/v1/collections/sentinel-1-grd/items/S1A_IW_GRDH_1SDV_20220509T121356_20220509T121421_043134_0526C4"
- type "application/json"
- title "Sentinel 1 GRD Item"
6
- rel "preview"
- href "https://planetarycomputer.microsoft.com/api/data/v1/item/map?collection=sentinel-1-rtc&item=S1A_IW_GRDH_1SDV_20220509T121356_20220509T121421_043134_0526C4_rtc"
- type "text/html"
- title "Map of item"
assets
vh
- href "https://sentinel1euwestrtc.blob.core.windows.net/sentinel1-grd-rtc/GRD/2022/5/9/IW/DV/S1A_IW_GRDH_1SDV_20220509T121356_20220509T121421_043134_0526C4_1BB0/measurement/iw-vh.rtc.tiff"
- type "image/tiff; application=geotiff; profile=cloud-optimized"
- title "VH: vertical transmit, horizontal receive"
- description "Terrain-corrected gamma naught values of signal transmitted with vertical polarization and received with horizontal polarization with radiometric terrain correction applied."
- file:size 1868079463
- file:checksum "b3074f61b4988670e771e990168f53cb"
raster:bands [] 1 items
0
- nodata -32768
- data_type "float32"
- spatial_resolution 10.0
roles [] 1 items
- 0 "data"
vv
- href "https://sentinel1euwestrtc.blob.core.windows.net/sentinel1-grd-rtc/GRD/2022/5/9/IW/DV/S1A_IW_GRDH_1SDV_20220509T121356_20220509T121421_043134_0526C4_1BB0/measurement/iw-vv.rtc.tiff"
- type "image/tiff; application=geotiff; profile=cloud-optimized"
- title "VV: vertical transmit, vertical receive"
- description "Terrain-corrected gamma naught values of signal transmitted with vertical polarization and received with vertical polarization with radiometric terrain correction applied."
- file:size 1876182996
- file:checksum "29cda12e618752246a1e3f509920bec6"
raster:bands [] 1 items
0
- nodata -32768
- data_type "float32"
- spatial_resolution 10.0
roles [] 1 items
- 0 "data"
tilejson
- href "https://planetarycomputer.microsoft.com/api/data/v1/item/tilejson.json?collection=sentinel-1-rtc&item=S1A_IW_GRDH_1SDV_20220509T121356_20220509T121421_043134_0526C4_rtc&assets=vv&assets=vh&tile_format=png&expression=0.03+%2B+log+%2810e-4+-+log+%280.05+%2F+%280.02+%2B+2+%2A+vv%29%29%29%3B0.05+%2B+exp+%280.25+%2A+%28log+%280.01+%2B+2+%2A+vv%29+%2B+log+%280.02+%2B+5+%2A+vh%29%29%29%3B1+-+log+%280.05+%2F+%280.045+-+0.9+%2A+vv%29%29&asset_as_band=True&rescale=0%2C.8000&rescale=0%2C1.000&rescale=0%2C1.000&format=png"
- type "application/json"
- title "TileJSON with default rendering"
roles [] 1 items
- 0 "tiles"
rendered_preview
- href "https://planetarycomputer.microsoft.com/api/data/v1/item/preview.png?collection=sentinel-1-rtc&item=S1A_IW_GRDH_1SDV_20220509T121356_20220509T121421_043134_0526C4_rtc&assets=vv&assets=vh&tile_format=png&expression=0.03+%2B+log+%2810e-4+-+log+%280.05+%2F+%280.02+%2B+2+%2A+vv%29%29%29%3B0.05+%2B+exp+%280.25+%2A+%28log+%280.01+%2B+2+%2A+vv%29+%2B+log+%280.02+%2B+5+%2A+vh%29%29%29%3B1+-+log+%280.05+%2F+%280.045+-+0.9+%2A+vv%29%29&asset_as_band=True&rescale=0%2C.8000&rescale=0%2C1.000&rescale=0%2C1.000&format=png"
- type "image/png"
- title "Rendered preview"
- rel "preview"
roles [] 1 items
- 0 "overview"
bbox [] 4 items
- 0 86.20631967
- 1 26.36650671
- 2 88.98507093
- 3 28.28951002
stac_extensions [] 6 items
- 0 "https://stac-extensions.github.io/sar/v1.0.0/schema.json"
- 1 "https://stac-extensions.github.io/sat/v1.0.0/schema.json"
- 2 "https://stac-extensions.github.io/eo/v1.0.0/schema.json"
- 3 "https://stac-extensions.github.io/projection/v1.0.0/schema.json"
- 4 "https://stac-extensions.github.io/file/v2.0.0/schema.json"
- 5 "https://stac-extensions.github.io/raster/v1.1.0/schema.json"
- collection "sentinel-1-rtc"
20
- type "Feature"
- stac_version "1.0.0"
- id "S1A_IW_GRDH_1SDV_20220504T120548_20220504T120613_043061_05245F_rtc"
properties
- datetime "2022-05-04T12:06:01.122366Z"
- platform "SENTINEL-1A"
s1:shape [] 2 items
- 0 28428
- 1 21971
proj:bbox [] 4 items
- 0 619630.0
- 1 2960660.0
- 2 895970.0
- 3 3178430.0
- proj:epsg 32645
proj:shape [] 2 items
- 0 28428
- 1 21971
- end_datetime "2022-05-04 12:06:13.622093+00:00"
- constellation "Sentinel-1"
- s1:resolution "high"
proj:transform [] 9 items
- 0 10.0
- 1 0.0
- 2 618410.0
- 3 0.0
- 4 -10.0
- 5 3180150.0
- 6 0.0
- 7 0.0
- 8 1.0
- s1:datatake_id "336991"
- start_datetime "2022-05-04 12:05:48.622638+00:00"
- s1:orbit_source "RESORB"
- s1:slice_number "6"
- s1:total_slices "21"
- sar:looks_range 5
- sat:orbit_state "ascending"
- sar:product_type "GRD"
- sar:looks_azimuth 1
sar:polarizations [] 2 items
- 0 "VV"
- 1 "VH"
- sar:frequency_band "C"
- sat:absolute_orbit 43061
- sat:relative_orbit 114
- s1:processing_level "1"
- sar:instrument_mode "IW"
- sar:center_frequency 5.405
- sar:resolution_range 20
- s1:product_timeliness "Fast-24h"
- sar:resolution_azimuth 22
- sar:pixel_spacing_range 10
- sar:observation_direction "right"
- sar:pixel_spacing_azimuth 10
- sar:looks_equivalent_number 4.4
- s1:instrument_configuration_ID "7"
- sat:platform_international_designator "2014-016A"
geometry
- type "Polygon"
coordinates [] 1 items
0 [] 14 items
0 [] 2 items
- 0 89.9842575
- 1 27.0125498
1 [] 2 items
- 0 90.9952485
- 1 27.1727909
2 [] 2 items
- 0 90.726387
- 1 28.6818734
3 [] 2 items
- 0 88.2198247
- 1 28.2798336
4 [] 2 items
- 0 88.3575016
- 1 27.7229022
5 [] 2 items
- 0 88.3318833
- 1 27.5843258
6 [] 2 items
- 0 88.378522
- 1 27.5225815
7 [] 2 items
- 0 88.3603234
- 1 27.4092973
8 [] 2 items
- 0 88.4027019
- 1 27.3371164
9 [] 2 items
- 0 88.3834428
- 1 27.2675323
10 [] 2 items
- 0 88.4181193
- 1 27.2060746
11 [] 2 items
- 0 88.4066611
- 1 27.0892929
12 [] 2 items
- 0 88.4776443
- 1 26.7595789
13 [] 2 items
- 0 89.9842575
- 1 27.0125498
links [] 7 items
0
- rel "collection"
- href "https://planetarycomputer.microsoft.com/api/stac/v1/collections/sentinel-1-rtc"
- type "application/json"
1
- rel "parent"
- href "https://planetarycomputer.microsoft.com/api/stac/v1/collections/sentinel-1-rtc"
- type "application/json"
2
- rel "root"
- href "https://planetarycomputer.microsoft.com/api/stac/v1"
- type "application/json"
- title "Microsoft Planetary Computer STAC API"
3
- rel "self"
- href "https://planetarycomputer.microsoft.com/api/stac/v1/collections/sentinel-1-rtc/items/S1A_IW_GRDH_1SDV_20220504T120548_20220504T120613_043061_05245F_rtc"
- type "application/geo+json"
4
- rel "license"
- href "https://sentinel.esa.int/documents/247904/690755/Sentinel_Data_Legal_Notice"
5
- rel "derived_from"
- href "https://planetarycomputer.microsoft.com/api/stac/v1/collections/sentinel-1-grd/items/S1A_IW_GRDH_1SDV_20220504T120548_20220504T120613_043061_05245F"
- type "application/json"
- title "Sentinel 1 GRD Item"
6
- rel "preview"
- href "https://planetarycomputer.microsoft.com/api/data/v1/item/map?collection=sentinel-1-rtc&item=S1A_IW_GRDH_1SDV_20220504T120548_20220504T120613_043061_05245F_rtc"
- type "text/html"
- title "Map of item"
assets
vh
- href "https://sentinel1euwestrtc.blob.core.windows.net/sentinel1-grd-rtc/GRD/2022/5/4/IW/DV/S1A_IW_GRDH_1SDV_20220504T120548_20220504T120613_043061_05245F_2C7A/measurement/iw-vh.rtc.tiff"
- type "image/tiff; application=geotiff; profile=cloud-optimized"
- title "VH: vertical transmit, horizontal receive"
- description "Terrain-corrected gamma naught values of signal transmitted with vertical polarization and received with horizontal polarization with radiometric terrain correction applied."
- file:size 1851161483
- file:checksum "dfdb50fb74a2317d861eae6cb7bed13e"
raster:bands [] 1 items
0
- nodata -32768
- data_type "float32"
- spatial_resolution 10.0
roles [] 1 items
- 0 "data"
vv
- href "https://sentinel1euwestrtc.blob.core.windows.net/sentinel1-grd-rtc/GRD/2022/5/4/IW/DV/S1A_IW_GRDH_1SDV_20220504T120548_20220504T120613_043061_05245F_2C7A/measurement/iw-vv.rtc.tiff"
- type "image/tiff; application=geotiff; profile=cloud-optimized"
- title "VV: vertical transmit, vertical receive"
- description "Terrain-corrected gamma naught values of signal transmitted with vertical polarization and received with vertical polarization with radiometric terrain correction applied."
- file:size 1859839915
- file:checksum "0438d66c18ccb3f2cebf117c2d812d54"
raster:bands [] 1 items
0
- nodata -32768
- data_type "float32"
- spatial_resolution 10.0
roles [] 1 items
- 0 "data"
tilejson
- href "https://planetarycomputer.microsoft.com/api/data/v1/item/tilejson.json?collection=sentinel-1-rtc&item=S1A_IW_GRDH_1SDV_20220504T120548_20220504T120613_043061_05245F_rtc&assets=vv&assets=vh&tile_format=png&expression=0.03+%2B+log+%2810e-4+-+log+%280.05+%2F+%280.02+%2B+2+%2A+vv%29%29%29%3B0.05+%2B+exp+%280.25+%2A+%28log+%280.01+%2B+2+%2A+vv%29+%2B+log+%280.02+%2B+5+%2A+vh%29%29%29%3B1+-+log+%280.05+%2F+%280.045+-+0.9+%2A+vv%29%29&asset_as_band=True&rescale=0%2C.8000&rescale=0%2C1.000&rescale=0%2C1.000&format=png"
- type "application/json"
- title "TileJSON with default rendering"
roles [] 1 items
- 0 "tiles"
rendered_preview
- href "https://planetarycomputer.microsoft.com/api/data/v1/item/preview.png?collection=sentinel-1-rtc&item=S1A_IW_GRDH_1SDV_20220504T120548_20220504T120613_043061_05245F_rtc&assets=vv&assets=vh&tile_format=png&expression=0.03+%2B+log+%2810e-4+-+log+%280.05+%2F+%280.02+%2B+2+%2A+vv%29%29%29%3B0.05+%2B+exp+%280.25+%2A+%28log+%280.01+%2B+2+%2A+vv%29+%2B+log+%280.02+%2B+5+%2A+vh%29%29%29%3B1+-+log+%280.05+%2F+%280.045+-+0.9+%2A+vv%29%29&asset_as_band=True&rescale=0%2C.8000&rescale=0%2C1.000&rescale=0%2C1.000&format=png"
- type "image/png"
- title "Rendered preview"
- rel "preview"
roles [] 1 items
- 0 "overview"
bbox [] 4 items
- 0 88.21982471
- 1 26.75957888
- 2 90.99524848
- 3 28.68187343
stac_extensions [] 6 items
- 0 "https://stac-extensions.github.io/sar/v1.0.0/schema.json"
- 1 "https://stac-extensions.github.io/sat/v1.0.0/schema.json"
- 2 "https://stac-extensions.github.io/eo/v1.0.0/schema.json"
- 3 "https://stac-extensions.github.io/projection/v1.0.0/schema.json"
- 4 "https://stac-extensions.github.io/file/v2.0.0/schema.json"
- 5 "https://stac-extensions.github.io/raster/v1.0.0/schema.json"
- collection "sentinel-1-rtc"
21
- type "Feature"
- stac_version "1.0.0"
- id "S1A_IW_GRDH_1SDV_20220430T000314_20220430T000339_042995_05221E_rtc"
properties
- datetime "2022-04-30T00:03:27.201903Z"
- platform "SENTINEL-1A"
s1:shape [] 2 items
- 0 27531
- 1 21084
proj:bbox [] 4 items
- 0 524470.0
- 1 2980840.0
- 2 799780.0
- 3 3191680.0
- proj:epsg 32645
proj:shape [] 2 items
- 0 21084
- 1 27531
- end_datetime "2022-04-30 00:03:39.701264+00:00"
- constellation "Sentinel-1"
- s1:resolution "high"
proj:transform [] 9 items
- 0 10.0
- 1 0.0
- 2 524470.0
- 3 0.0
- 4 -10.0
- 5 3191680.0
- 6 0.0
- 7 0.0
- 8 1.0
- s1:datatake_id "336414"
- start_datetime "2022-04-30 00:03:14.702542+00:00"
- s1:orbit_source "RESORB"
- s1:slice_number "12"
- s1:total_slices "17"
- sar:looks_range 5
- sat:orbit_state "descending"
- sar:product_type "GRD"
- sar:looks_azimuth 1
sar:polarizations [] 2 items
- 0 "VV"
- 1 "VH"
- sar:frequency_band "C"
- sat:absolute_orbit 42995
- sat:relative_orbit 48
- s1:processing_level "1"
- sar:instrument_mode "IW"
- sar:center_frequency 5.405
- sar:resolution_range 20
- s1:product_timeliness "Fast-24h"
- sar:resolution_azimuth 22
- sar:pixel_spacing_range 10
- sar:observation_direction "right"
- sar:pixel_spacing_azimuth 10
- sar:looks_equivalent_number 4.4
- s1:instrument_configuration_ID "7"
- sat:platform_international_designator "2014-016A"
geometry
- type "Polygon"
coordinates [] 1 items
0 [] 19 items
0 [] 2 items
- 0 89.8039135
- 1 27.0229353
1 [] 2 items
- 0 89.8289793
- 1 27.274281
2 [] 2 items
- 0 89.9023405
- 1 27.4315541
3 [] 2 items
- 0 89.9215
- 1 27.632325
4 [] 2 items
- 0 89.9524181
- 1 27.6784882
5 [] 2 items
- 0 89.9283287
- 1 27.8234245
6 [] 2 items
- 0 89.9440409
- 1 27.9503721
7 [] 2 items
- 0 89.987441
- 1 28.0028371
8 [] 2 items
- 0 89.9710817
- 1 28.0842856
9 [] 2 items
- 0 89.9975753
- 1 28.1482035
10 [] 2 items
- 0 89.9730329
- 1 28.1917655
11 [] 2 items
- 0 90.0259221
- 1 28.2909078
12 [] 2 items
- 0 90.0495442
- 1 28.4416883
13 [] 2 items
- 0 87.5580205
- 1 28.840207
14 [] 2 items
- 0 87.4256917
- 1 28.1942584
15 [] 2 items
- 0 87.3050801
- 1 27.3292911
16 [] 2 items
- 0 89.7843697
- 1 26.9227247
17 [] 2 items
- 0 89.7768392
- 1 26.9952776
18 [] 2 items
- 0 89.8039135
- 1 27.0229353
links [] 7 items
0
- rel "collection"
- href "https://planetarycomputer.microsoft.com/api/stac/v1/collections/sentinel-1-rtc"
- type "application/json"
1
- rel "parent"
- href "https://planetarycomputer.microsoft.com/api/stac/v1/collections/sentinel-1-rtc"
- type "application/json"
2
- rel "root"
- href "https://planetarycomputer.microsoft.com/api/stac/v1"
- type "application/json"
- title "Microsoft Planetary Computer STAC API"
3
- rel "self"
- href "https://planetarycomputer.microsoft.com/api/stac/v1/collections/sentinel-1-rtc/items/S1A_IW_GRDH_1SDV_20220430T000314_20220430T000339_042995_05221E_rtc"
- type "application/geo+json"
4
- rel "license"
- href "https://sentinel.esa.int/documents/247904/690755/Sentinel_Data_Legal_Notice"
5
- rel "derived_from"
- href "https://planetarycomputer.microsoft.com/api/stac/v1/collections/sentinel-1-grd/items/S1A_IW_GRDH_1SDV_20220430T000314_20220430T000339_042995_05221E"
- type "application/json"
- title "Sentinel 1 GRD Item"
6
- rel "preview"
- href "https://planetarycomputer.microsoft.com/api/data/v1/item/map?collection=sentinel-1-rtc&item=S1A_IW_GRDH_1SDV_20220430T000314_20220430T000339_042995_05221E_rtc"
- type "text/html"
- title "Map of item"
assets
vh
- href "https://sentinel1euwestrtc.blob.core.windows.net/sentinel1-grd-rtc/GRD/2022/4/30/IW/DV/S1A_IW_GRDH_1SDV_20220430T000314_20220430T000339_042995_05221E_C8B3/measurement/iw-vh.rtc.tiff"
- type "image/tiff; application=geotiff; profile=cloud-optimized"
- title "VH: vertical transmit, horizontal receive"
- description "Terrain-corrected gamma naught values of signal transmitted with vertical polarization and received with horizontal polarization with radiometric terrain correction applied."
- file:size 1835294264
- file:checksum "2f8f8b859427c913f4c5f4f5a14da8eb"
raster:bands [] 1 items
0
- nodata -32768
- data_type "float32"
- spatial_resolution 10.0
roles [] 1 items
- 0 "data"
vv
- href "https://sentinel1euwestrtc.blob.core.windows.net/sentinel1-grd-rtc/GRD/2022/4/30/IW/DV/S1A_IW_GRDH_1SDV_20220430T000314_20220430T000339_042995_05221E_C8B3/measurement/iw-vv.rtc.tiff"
- type "image/tiff; application=geotiff; profile=cloud-optimized"
- title "VV: vertical transmit, vertical receive"
- description "Terrain-corrected gamma naught values of signal transmitted with vertical polarization and received with vertical polarization with radiometric terrain correction applied."
- file:size 1845659694
- file:checksum "82b4dd2b219fbae5f965e5cf5d82e3b6"
raster:bands [] 1 items
0
- nodata -32768
- data_type "float32"
- spatial_resolution 10.0
roles [] 1 items
- 0 "data"
tilejson
- href "https://planetarycomputer.microsoft.com/api/data/v1/item/tilejson.json?collection=sentinel-1-rtc&item=S1A_IW_GRDH_1SDV_20220430T000314_20220430T000339_042995_05221E_rtc&assets=vv&assets=vh&tile_format=png&expression=0.03+%2B+log+%2810e-4+-+log+%280.05+%2F+%280.02+%2B+2+%2A+vv%29%29%29%3B0.05+%2B+exp+%280.25+%2A+%28log+%280.01+%2B+2+%2A+vv%29+%2B+log+%280.02+%2B+5+%2A+vh%29%29%29%3B1+-+log+%280.05+%2F+%280.045+-+0.9+%2A+vv%29%29&asset_as_band=True&rescale=0%2C.8000&rescale=0%2C1.000&rescale=0%2C1.000&format=png"
- type "application/json"
- title "TileJSON with default rendering"
roles [] 1 items
- 0 "tiles"
rendered_preview
- href "https://planetarycomputer.microsoft.com/api/data/v1/item/preview.png?collection=sentinel-1-rtc&item=S1A_IW_GRDH_1SDV_20220430T000314_20220430T000339_042995_05221E_rtc&assets=vv&assets=vh&tile_format=png&expression=0.03+%2B+log+%2810e-4+-+log+%280.05+%2F+%280.02+%2B+2+%2A+vv%29%29%29%3B0.05+%2B+exp+%280.25+%2A+%28log+%280.01+%2B+2+%2A+vv%29+%2B+log+%280.02+%2B+5+%2A+vh%29%29%29%3B1+-+log+%280.05+%2F+%280.045+-+0.9+%2A+vv%29%29&asset_as_band=True&rescale=0%2C.8000&rescale=0%2C1.000&rescale=0%2C1.000&format=png"
- type "image/png"
- title "Rendered preview"
- rel "preview"
roles [] 1 items
- 0 "overview"
bbox [] 4 items
- 0 87.30508012
- 1 26.92272468
- 2 90.04954425
- 3 28.840207
stac_extensions [] 6 items
- 0 "https://stac-extensions.github.io/sar/v1.0.0/schema.json"
- 1 "https://stac-extensions.github.io/sat/v1.0.0/schema.json"
- 2 "https://stac-extensions.github.io/eo/v1.0.0/schema.json"
- 3 "https://stac-extensions.github.io/projection/v1.0.0/schema.json"
- 4 "https://stac-extensions.github.io/file/v2.0.0/schema.json"
- 5 "https://stac-extensions.github.io/raster/v1.1.0/schema.json"
- collection "sentinel-1-rtc"
22
- type "Feature"
- stac_version "1.0.0"
- id "S1A_IW_GRDH_1SDV_20220427T121355_20220427T121420_042959_0520EE_rtc"
properties
- datetime "2022-04-27T12:14:08.426000Z"
- platform "SENTINEL-1A"
s1:shape [] 2 items
- 0 28151
- 1 21598
proj:bbox [] 4 items
- 0 421840.0
- 1 2916220.0
- 2 703350.0
- 3 3132200.0
- proj:epsg 32645
proj:shape [] 2 items
- 0 21598
- 1 28151
- end_datetime "2022-04-27 12:14:20.924939+00:00"
- constellation "Sentinel-1"
- s1:resolution "high"
proj:transform [] 9 items
- 0 10.0
- 1 0.0
- 2 421840.0
- 3 0.0
- 4 -10.0
- 5 3132200.0
- 6 0.0
- 7 0.0
- 8 1.0
- s1:datatake_id "336110"
- start_datetime "2022-04-27 12:13:55.927061+00:00"
- s1:orbit_source "RESORB"
- s1:slice_number "6"
- s1:total_slices "20"
- sar:looks_range 5
- sat:orbit_state "ascending"
- sar:product_type "GRD"
- sar:looks_azimuth 1
sar:polarizations [] 2 items
- 0 "VV"
- 1 "VH"
- sar:frequency_band "C"
- sat:absolute_orbit 42959
- sat:relative_orbit 12
- s1:processing_level "1"
- sar:instrument_mode "IW"
- sar:center_frequency 5.405
- sar:resolution_range 20
- s1:product_timeliness "Fast-24h"
- sar:resolution_azimuth 22
- sar:pixel_spacing_range 10
- sar:observation_direction "right"
- sar:pixel_spacing_azimuth 10
- sar:looks_equivalent_number 4.4
- s1:instrument_configuration_ID "7"
- sat:platform_international_designator "2014-016A"
geometry
- type "Polygon"
coordinates [] 1 items
0 [] 15 items
0 [] 2 items
- 0 86.2062188
- 1 27.8441396
1 [] 2 items
- 0 86.2103164
- 1 27.7830951
2 [] 2 items
- 0 86.2348913
- 1 27.7813376
3 [] 2 items
- 0 86.2165981
- 1 27.7563203
4 [] 2 items
- 0 86.2712767
- 1 27.6976714
5 [] 2 items
- 0 86.2777744
- 1 27.4646171
6 [] 2 items
- 0 86.3280981
- 1 27.3770295
7 [] 2 items
- 0 86.3187682
- 1 27.2323585
8 [] 2 items
- 0 86.3555352
- 1 27.1613015
9 [] 2 items
- 0 86.4992776
- 1 26.3665057
10 [] 2 items
- 0 88.9847693
- 1 26.7768959
11 [] 2 items
- 0 88.9225403
- 1 27.3276796
12 [] 2 items
- 0 88.7384558
- 1 28.2894237
13 [] 2 items
- 0 86.211279
- 1 27.8816306
14 [] 2 items
- 0 86.2062188
- 1 27.8441396
links [] 7 items
0
- rel "collection"
- href "https://planetarycomputer.microsoft.com/api/stac/v1/collections/sentinel-1-rtc"
- type "application/json"
1
- rel "parent"
- href "https://planetarycomputer.microsoft.com/api/stac/v1/collections/sentinel-1-rtc"
- type "application/json"
2
- rel "root"
- href "https://planetarycomputer.microsoft.com/api/stac/v1"
- type "application/json"
- title "Microsoft Planetary Computer STAC API"
3
- rel "self"
- href "https://planetarycomputer.microsoft.com/api/stac/v1/collections/sentinel-1-rtc/items/S1A_IW_GRDH_1SDV_20220427T121355_20220427T121420_042959_0520EE_rtc"
- type "application/geo+json"
4
- rel "license"
- href "https://sentinel.esa.int/documents/247904/690755/Sentinel_Data_Legal_Notice"
5
- rel "derived_from"
- href "https://planetarycomputer.microsoft.com/api/stac/v1/collections/sentinel-1-grd/items/S1A_IW_GRDH_1SDV_20220427T121355_20220427T121420_042959_0520EE"
- type "application/json"
- title "Sentinel 1 GRD Item"
6
- rel "preview"
- href "https://planetarycomputer.microsoft.com/api/data/v1/item/map?collection=sentinel-1-rtc&item=S1A_IW_GRDH_1SDV_20220427T121355_20220427T121420_042959_0520EE_rtc"
- type "text/html"
- title "Map of item"
assets
vh
- href "https://sentinel1euwestrtc.blob.core.windows.net/sentinel1-grd-rtc/GRD/2022/4/27/IW/DV/S1A_IW_GRDH_1SDV_20220427T121355_20220427T121420_042959_0520EE_BAEB/measurement/iw-vh.rtc.tiff"
- type "image/tiff; application=geotiff; profile=cloud-optimized"
- title "VH: vertical transmit, horizontal receive"
- description "Terrain-corrected gamma naught values of signal transmitted with vertical polarization and received with horizontal polarization with radiometric terrain correction applied."
- file:size 1868139780
- file:checksum "9c144ab1a19de08a087a8cee8f9f2f58"
raster:bands [] 1 items
0
- nodata -32768
- data_type "float32"
- spatial_resolution 10.0
roles [] 1 items
- 0 "data"
vv
- href "https://sentinel1euwestrtc.blob.core.windows.net/sentinel1-grd-rtc/GRD/2022/4/27/IW/DV/S1A_IW_GRDH_1SDV_20220427T121355_20220427T121420_042959_0520EE_BAEB/measurement/iw-vv.rtc.tiff"
- type "image/tiff; application=geotiff; profile=cloud-optimized"
- title "VV: vertical transmit, vertical receive"
- description "Terrain-corrected gamma naught values of signal transmitted with vertical polarization and received with vertical polarization with radiometric terrain correction applied."
- file:size 1875904277
- file:checksum "8932f2fd6be19668190bac38047629e4"
raster:bands [] 1 items
0
- nodata -32768
- data_type "float32"
- spatial_resolution 10.0
roles [] 1 items
- 0 "data"
tilejson
- href "https://planetarycomputer.microsoft.com/api/data/v1/item/tilejson.json?collection=sentinel-1-rtc&item=S1A_IW_GRDH_1SDV_20220427T121355_20220427T121420_042959_0520EE_rtc&assets=vv&assets=vh&tile_format=png&expression=0.03+%2B+log+%2810e-4+-+log+%280.05+%2F+%280.02+%2B+2+%2A+vv%29%29%29%3B0.05+%2B+exp+%280.25+%2A+%28log+%280.01+%2B+2+%2A+vv%29+%2B+log+%280.02+%2B+5+%2A+vh%29%29%29%3B1+-+log+%280.05+%2F+%280.045+-+0.9+%2A+vv%29%29&asset_as_band=True&rescale=0%2C.8000&rescale=0%2C1.000&rescale=0%2C1.000&format=png"
- type "application/json"
- title "TileJSON with default rendering"
roles [] 1 items
- 0 "tiles"
rendered_preview
- href "https://planetarycomputer.microsoft.com/api/data/v1/item/preview.png?collection=sentinel-1-rtc&item=S1A_IW_GRDH_1SDV_20220427T121355_20220427T121420_042959_0520EE_rtc&assets=vv&assets=vh&tile_format=png&expression=0.03+%2B+log+%2810e-4+-+log+%280.05+%2F+%280.02+%2B+2+%2A+vv%29%29%29%3B0.05+%2B+exp+%280.25+%2A+%28log+%280.01+%2B+2+%2A+vv%29+%2B+log+%280.02+%2B+5+%2A+vh%29%29%29%3B1+-+log+%280.05+%2F+%280.045+-+0.9+%2A+vv%29%29&asset_as_band=True&rescale=0%2C.8000&rescale=0%2C1.000&rescale=0%2C1.000&format=png"
- type "image/png"
- title "Rendered preview"
- rel "preview"
roles [] 1 items
- 0 "overview"
bbox [] 4 items
- 0 86.20621878
- 1 26.36650566
- 2 88.98476934
- 3 28.28942369
stac_extensions [] 6 items
- 0 "https://stac-extensions.github.io/sar/v1.0.0/schema.json"
- 1 "https://stac-extensions.github.io/sat/v1.0.0/schema.json"
- 2 "https://stac-extensions.github.io/eo/v1.0.0/schema.json"
- 3 "https://stac-extensions.github.io/projection/v1.0.0/schema.json"
- 4 "https://stac-extensions.github.io/file/v2.0.0/schema.json"
- 5 "https://stac-extensions.github.io/raster/v1.1.0/schema.json"
- collection "sentinel-1-rtc"
23
- type "Feature"
- stac_version "1.0.0"
- id "S1A_IW_GRDH_1SDV_20220422T120548_20220422T120613_042886_051E96_rtc"
properties
- datetime "2022-04-22T12:06:01.051309Z"
- platform "SENTINEL-1A"
s1:shape [] 2 items
- 0 28425
- 1 21971
proj:bbox [] 4 items
- 0 618170.0
- 1 2960440.0
- 2 902420.0
- 3 3180150.0
- proj:epsg 32645
proj:shape [] 2 items
- 0 21971
- 1 28425
- end_datetime "2022-04-22 12:06:13.551041+00:00"
- constellation "Sentinel-1"
- s1:resolution "high"
proj:transform [] 9 items
- 0 10.0
- 1 0.0
- 2 618170.0
- 3 0.0
- 4 -10.0
- 5 3180150.0
- 6 0.0
- 7 0.0
- 8 1.0
- s1:datatake_id "335510"
- start_datetime "2022-04-22 12:05:48.551577+00:00"
- s1:orbit_source "RESORB"
- s1:slice_number "6"
- s1:total_slices "21"
- sar:looks_range 5
- sat:orbit_state "ascending"
- sar:product_type "GRD"
- sar:looks_azimuth 1
sar:polarizations [] 2 items
- 0 "VV"
- 1 "VH"
- sar:frequency_band "C"
- sat:absolute_orbit 42886
- sat:relative_orbit 114
- s1:processing_level "1"
- sar:instrument_mode "IW"
- sar:center_frequency 5.405
- sar:resolution_range 20
- s1:product_timeliness "Fast-24h"
- sar:resolution_azimuth 22
- sar:pixel_spacing_range 10
- sar:observation_direction "right"
- sar:pixel_spacing_azimuth 10
- sar:looks_equivalent_number 4.4
- s1:instrument_configuration_ID "7"
- sat:platform_international_designator "2014-016A"
geometry
- type "Polygon"
coordinates [] 1 items
0 [] 14 items
0 [] 2 items
- 0 89.9823449
- 1 27.0125904
1 [] 2 items
- 0 90.9933352
- 1 27.1728455
2 [] 2 items
- 0 90.7244463
- 1 28.6819269
3 [] 2 items
- 0 88.2174799
- 1 28.2798545
4 [] 2 items
- 0 88.3547666
- 1 27.7231997
5 [] 2 items
- 0 88.3296559
- 1 27.5844374
6 [] 2 items
- 0 88.376188
- 1 27.5221533
7 [] 2 items
- 0 88.3578918
- 1 27.40896
8 [] 2 items
- 0 88.4002661
- 1 27.3363285
9 [] 2 items
- 0 88.3791271
- 1 27.3025083
10 [] 2 items
- 0 88.4160063
- 1 27.2066376
11 [] 2 items
- 0 88.4041401
- 1 27.0893182
12 [] 2 items
- 0 88.4752301
- 1 26.7595138
13 [] 2 items
- 0 89.9823449
- 1 27.0125904
links [] 7 items
0
- rel "collection"
- href "https://planetarycomputer.microsoft.com/api/stac/v1/collections/sentinel-1-rtc"
- type "application/json"
1
- rel "parent"
- href "https://planetarycomputer.microsoft.com/api/stac/v1/collections/sentinel-1-rtc"
- type "application/json"
2
- rel "root"
- href "https://planetarycomputer.microsoft.com/api/stac/v1"
- type "application/json"
- title "Microsoft Planetary Computer STAC API"
3
- rel "self"
- href "https://planetarycomputer.microsoft.com/api/stac/v1/collections/sentinel-1-rtc/items/S1A_IW_GRDH_1SDV_20220422T120548_20220422T120613_042886_051E96_rtc"
- type "application/geo+json"
4
- rel "license"
- href "https://sentinel.esa.int/documents/247904/690755/Sentinel_Data_Legal_Notice"
5
- rel "derived_from"
- href "https://planetarycomputer.microsoft.com/api/stac/v1/collections/sentinel-1-grd/items/S1A_IW_GRDH_1SDV_20220422T120548_20220422T120613_042886_051E96"
- type "application/json"
- title "Sentinel 1 GRD Item"
6
- rel "preview"
- href "https://planetarycomputer.microsoft.com/api/data/v1/item/map?collection=sentinel-1-rtc&item=S1A_IW_GRDH_1SDV_20220422T120548_20220422T120613_042886_051E96_rtc"
- type "text/html"
- title "Map of item"
assets
vh
- href "https://sentinel1euwestrtc.blob.core.windows.net/sentinel1-grd-rtc/GRD/2022/4/22/IW/DV/S1A_IW_GRDH_1SDV_20220422T120548_20220422T120613_042886_051E96_444A/measurement/iw-vh.rtc.tiff"
- type "image/tiff; application=geotiff; profile=cloud-optimized"
- title "VH: vertical transmit, horizontal receive"
- description "Terrain-corrected gamma naught values of signal transmitted with vertical polarization and received with horizontal polarization with radiometric terrain correction applied."
- file:size 1850079888
- file:checksum "1d388c296cd34b01d4c4deca99f1422e"
raster:bands [] 1 items
0
- nodata -32768
- data_type "float32"
- spatial_resolution 10.0
roles [] 1 items
- 0 "data"
vv
- href "https://sentinel1euwestrtc.blob.core.windows.net/sentinel1-grd-rtc/GRD/2022/4/22/IW/DV/S1A_IW_GRDH_1SDV_20220422T120548_20220422T120613_042886_051E96_444A/measurement/iw-vv.rtc.tiff"
- type "image/tiff; application=geotiff; profile=cloud-optimized"
- title "VV: vertical transmit, vertical receive"
- description "Terrain-corrected gamma naught values of signal transmitted with vertical polarization and received with vertical polarization with radiometric terrain correction applied."
- file:size 1858496026
- file:checksum "6f266efcc7f69222e48d20697f7ae5fa"
raster:bands [] 1 items
0
- nodata -32768
- data_type "float32"
- spatial_resolution 10.0
roles [] 1 items
- 0 "data"
tilejson
- href "https://planetarycomputer.microsoft.com/api/data/v1/item/tilejson.json?collection=sentinel-1-rtc&item=S1A_IW_GRDH_1SDV_20220422T120548_20220422T120613_042886_051E96_rtc&assets=vv&assets=vh&tile_format=png&expression=0.03+%2B+log+%2810e-4+-+log+%280.05+%2F+%280.02+%2B+2+%2A+vv%29%29%29%3B0.05+%2B+exp+%280.25+%2A+%28log+%280.01+%2B+2+%2A+vv%29+%2B+log+%280.02+%2B+5+%2A+vh%29%29%29%3B1+-+log+%280.05+%2F+%280.045+-+0.9+%2A+vv%29%29&asset_as_band=True&rescale=0%2C.8000&rescale=0%2C1.000&rescale=0%2C1.000&format=png"
- type "application/json"
- title "TileJSON with default rendering"
roles [] 1 items
- 0 "tiles"
rendered_preview
- href "https://planetarycomputer.microsoft.com/api/data/v1/item/preview.png?collection=sentinel-1-rtc&item=S1A_IW_GRDH_1SDV_20220422T120548_20220422T120613_042886_051E96_rtc&assets=vv&assets=vh&tile_format=png&expression=0.03+%2B+log+%2810e-4+-+log+%280.05+%2F+%280.02+%2B+2+%2A+vv%29%29%29%3B0.05+%2B+exp+%280.25+%2A+%28log+%280.01+%2B+2+%2A+vv%29+%2B+log+%280.02+%2B+5+%2A+vh%29%29%29%3B1+-+log+%280.05+%2F+%280.045+-+0.9+%2A+vv%29%29&asset_as_band=True&rescale=0%2C.8000&rescale=0%2C1.000&rescale=0%2C1.000&format=png"
- type "image/png"
- title "Rendered preview"
- rel "preview"
roles [] 1 items
- 0 "overview"
bbox [] 4 items
- 0 88.21747992
- 1 26.75951376
- 2 90.99333519
- 3 28.68192691
stac_extensions [] 6 items
- 0 "https://stac-extensions.github.io/sar/v1.0.0/schema.json"
- 1 "https://stac-extensions.github.io/sat/v1.0.0/schema.json"
- 2 "https://stac-extensions.github.io/eo/v1.0.0/schema.json"
- 3 "https://stac-extensions.github.io/projection/v1.0.0/schema.json"
- 4 "https://stac-extensions.github.io/file/v2.0.0/schema.json"
- 5 "https://stac-extensions.github.io/raster/v1.1.0/schema.json"
- collection "sentinel-1-rtc"
24
- type "Feature"
- stac_version "1.0.0"
- id "S1A_IW_GRDH_1SDV_20220418T000314_20220418T000339_042820_051C63_rtc"
properties
- datetime "2022-04-18T00:03:26.603587Z"
- platform "SENTINEL-1A"
s1:shape [] 2 items
- 0 27531
- 1 21084
proj:bbox [] 4 items
- 0 524460.0
- 1 2980840.0
- 2 799770.0
- 3 3191680.0
- proj:epsg 32645
proj:shape [] 2 items
- 0 21084
- 1 27531
- end_datetime "2022-04-18 00:03:39.102936+00:00"
- constellation "Sentinel-1"
- s1:resolution "high"
proj:transform [] 9 items
- 0 10.0
- 1 0.0
- 2 524460.0
- 3 0.0
- 4 -10.0
- 5 3191680.0
- 6 0.0
- 7 0.0
- 8 1.0
- s1:datatake_id "334947"
- start_datetime "2022-04-18 00:03:14.104239+00:00"
- s1:orbit_source "RESORB"
- s1:slice_number "12"
- s1:total_slices "17"
- sar:looks_range 5
- sat:orbit_state "descending"
- sar:product_type "GRD"
- sar:looks_azimuth 1
sar:polarizations [] 2 items
- 0 "VV"
- 1 "VH"
- sar:frequency_band "C"
- sat:absolute_orbit 42820
- sat:relative_orbit 48
- s1:processing_level "1"
- sar:instrument_mode "IW"
- sar:center_frequency 5.405
- sar:resolution_range 20
- s1:product_timeliness "Fast-24h"
- sar:resolution_azimuth 22
- sar:pixel_spacing_range 10
- sar:observation_direction "right"
- sar:pixel_spacing_azimuth 10
- sar:looks_equivalent_number 4.4
- s1:instrument_configuration_ID "7"
- sat:platform_international_designator "2014-016A"
geometry
- type "Polygon"
coordinates [] 1 items
0 [] 19 items
0 [] 2 items
- 0 89.8039135
- 1 27.0229353
1 [] 2 items
- 0 89.8289793
- 1 27.274281
2 [] 2 items
- 0 89.9022371
- 1 27.431466
3 [] 2 items
- 0 89.9215
- 1 27.632325
4 [] 2 items
- 0 89.9524181
- 1 27.6784882
5 [] 2 items
- 0 89.9282249
- 1 27.8233365
6 [] 2 items
- 0 89.9440409
- 1 27.9503721
7 [] 2 items
- 0 89.9874435
- 1 28.0029273
8 [] 2 items
- 0 89.9710842
- 1 28.0843757
9 [] 2 items
- 0 89.9975753
- 1 28.1482035
10 [] 2 items
- 0 89.9730329
- 1 28.1917655
11 [] 2 items
- 0 90.0259247
- 1 28.2909979
12 [] 2 items
- 0 90.0495442
- 1 28.4416883
13 [] 2 items
- 0 87.5580205
- 1 28.840207
14 [] 2 items
- 0 87.4255884
- 1 28.1938976
15 [] 2 items
- 0 87.3050804
- 1 27.3293813
16 [] 2 items
- 0 89.7843697
- 1 26.9227247
17 [] 2 items
- 0 89.7767341
- 1 26.9950992
18 [] 2 items
- 0 89.8039135
- 1 27.0229353
links [] 7 items
0
- rel "collection"
- href "https://planetarycomputer.microsoft.com/api/stac/v1/collections/sentinel-1-rtc"
- type "application/json"
1
- rel "parent"
- href "https://planetarycomputer.microsoft.com/api/stac/v1/collections/sentinel-1-rtc"
- type "application/json"
2
- rel "root"
- href "https://planetarycomputer.microsoft.com/api/stac/v1"
- type "application/json"
- title "Microsoft Planetary Computer STAC API"
3
- rel "self"
- href "https://planetarycomputer.microsoft.com/api/stac/v1/collections/sentinel-1-rtc/items/S1A_IW_GRDH_1SDV_20220418T000314_20220418T000339_042820_051C63_rtc"
- type "application/geo+json"
4
- rel "license"
- href "https://sentinel.esa.int/documents/247904/690755/Sentinel_Data_Legal_Notice"
5
- rel "derived_from"
- href "https://planetarycomputer.microsoft.com/api/stac/v1/collections/sentinel-1-grd/items/S1A_IW_GRDH_1SDV_20220418T000314_20220418T000339_042820_051C63"
- type "application/json"
- title "Sentinel 1 GRD Item"
6
- rel "preview"
- href "https://planetarycomputer.microsoft.com/api/data/v1/item/map?collection=sentinel-1-rtc&item=S1A_IW_GRDH_1SDV_20220418T000314_20220418T000339_042820_051C63_rtc"
- type "text/html"
- title "Map of item"
assets
vh
- href "https://sentinel1euwestrtc.blob.core.windows.net/sentinel1-grd-rtc/GRD/2022/4/18/IW/DV/S1A_IW_GRDH_1SDV_20220418T000314_20220418T000339_042820_051C63_0160/measurement/iw-vh.rtc.tiff"
- type "image/tiff; application=geotiff; profile=cloud-optimized"
- title "VH: vertical transmit, horizontal receive"
- description "Terrain-corrected gamma naught values of signal transmitted with vertical polarization and received with horizontal polarization with radiometric terrain correction applied."
- file:size 1840376768
- file:checksum "8aa1c6a10a3619840885a31755c0d068"
raster:bands [] 1 items
0
- nodata -32768
- data_type "float32"
- spatial_resolution 10.0
roles [] 1 items
- 0 "data"
vv
- href "https://sentinel1euwestrtc.blob.core.windows.net/sentinel1-grd-rtc/GRD/2022/4/18/IW/DV/S1A_IW_GRDH_1SDV_20220418T000314_20220418T000339_042820_051C63_0160/measurement/iw-vv.rtc.tiff"
- type "image/tiff; application=geotiff; profile=cloud-optimized"
- title "VV: vertical transmit, vertical receive"
- description "Terrain-corrected gamma naught values of signal transmitted with vertical polarization and received with vertical polarization with radiometric terrain correction applied."
- file:size 1847060143
- file:checksum "91fc0952c59fc0dafca55cb2f1e38f83"
raster:bands [] 1 items
0
- nodata -32768
- data_type "float32"
- spatial_resolution 10.0
roles [] 1 items
- 0 "data"
tilejson
- href "https://planetarycomputer.microsoft.com/api/data/v1/item/tilejson.json?collection=sentinel-1-rtc&item=S1A_IW_GRDH_1SDV_20220418T000314_20220418T000339_042820_051C63_rtc&assets=vv&assets=vh&tile_format=png&expression=0.03+%2B+log+%2810e-4+-+log+%280.05+%2F+%280.02+%2B+2+%2A+vv%29%29%29%3B0.05+%2B+exp+%280.25+%2A+%28log+%280.01+%2B+2+%2A+vv%29+%2B+log+%280.02+%2B+5+%2A+vh%29%29%29%3B1+-+log+%280.05+%2F+%280.045+-+0.9+%2A+vv%29%29&asset_as_band=True&rescale=0%2C.8000&rescale=0%2C1.000&rescale=0%2C1.000&format=png"
- type "application/json"
- title "TileJSON with default rendering"
roles [] 1 items
- 0 "tiles"
rendered_preview
- href "https://planetarycomputer.microsoft.com/api/data/v1/item/preview.png?collection=sentinel-1-rtc&item=S1A_IW_GRDH_1SDV_20220418T000314_20220418T000339_042820_051C63_rtc&assets=vv&assets=vh&tile_format=png&expression=0.03+%2B+log+%2810e-4+-+log+%280.05+%2F+%280.02+%2B+2+%2A+vv%29%29%29%3B0.05+%2B+exp+%280.25+%2A+%28log+%280.01+%2B+2+%2A+vv%29+%2B+log+%280.02+%2B+5+%2A+vh%29%29%29%3B1+-+log+%280.05+%2F+%280.045+-+0.9+%2A+vv%29%29&asset_as_band=True&rescale=0%2C.8000&rescale=0%2C1.000&rescale=0%2C1.000&format=png"
- type "image/png"
- title "Rendered preview"
- rel "preview"
roles [] 1 items
- 0 "overview"
bbox [] 4 items
- 0 87.30508036
- 1 26.92272468
- 2 90.04954425
- 3 28.840207
stac_extensions [] 6 items
- 0 "https://stac-extensions.github.io/sar/v1.0.0/schema.json"
- 1 "https://stac-extensions.github.io/sat/v1.0.0/schema.json"
- 2 "https://stac-extensions.github.io/eo/v1.0.0/schema.json"
- 3 "https://stac-extensions.github.io/projection/v1.0.0/schema.json"
- 4 "https://stac-extensions.github.io/file/v2.0.0/schema.json"
- 5 "https://stac-extensions.github.io/raster/v1.1.0/schema.json"
- collection "sentinel-1-rtc"
25
- type "Feature"
- stac_version "1.0.0"
- id "S1A_IW_GRDH_1SDV_20220415T121355_20220415T121420_042784_051B30_rtc"
properties
- datetime "2022-04-15T12:14:07.711367Z"
- platform "SENTINEL-1A"
s1:shape [] 2 items
- 0 28152
- 1 21598
proj:bbox [] 4 items
- 0 421850.0
- 1 2916220.0
- 2 703370.0
- 3 3132200.0
- proj:epsg 32645
proj:shape [] 2 items
- 0 21598
- 1 28152
- end_datetime "2022-04-15 12:14:20.210307+00:00"
- constellation "Sentinel-1"
- s1:resolution "high"
proj:transform [] 9 items
- 0 10.0
- 1 0.0
- 2 421850.0
- 3 0.0
- 4 -10.0
- 5 3132200.0
- 6 0.0
- 7 0.0
- 8 1.0
- s1:datatake_id "334640"
- start_datetime "2022-04-15 12:13:55.212427+00:00"
- s1:orbit_source "RESORB"
- s1:slice_number "6"
- s1:total_slices "20"
- sar:looks_range 5
- sat:orbit_state "ascending"
- sar:product_type "GRD"
- sar:looks_azimuth 1
sar:polarizations [] 2 items
- 0 "VV"
- 1 "VH"
- sar:frequency_band "C"
- sat:absolute_orbit 42784
- sat:relative_orbit 12
- s1:processing_level "1"
- sar:instrument_mode "IW"
- sar:center_frequency 5.405
- sar:resolution_range 20
- s1:product_timeliness "Fast-24h"
- sar:resolution_azimuth 22
- sar:pixel_spacing_range 10
- sar:observation_direction "right"
- sar:pixel_spacing_azimuth 10
- sar:looks_equivalent_number 4.4
- s1:instrument_configuration_ID "7"
- sat:platform_international_designator "2014-016A"
geometry
- type "Polygon"
coordinates [] 1 items
0 [] 15 items
0 [] 2 items
- 0 86.2063197
- 1 27.8442304
1 [] 2 items
- 0 86.2104153
- 1 27.7834567
2 [] 2 items
- 0 86.2349915
- 1 27.7815187
3 [] 2 items
- 0 86.2169045
- 1 27.7560512
4 [] 2 items
- 0 86.2714795
- 1 27.6976724
5 [] 2 items
- 0 86.2781792
- 1 27.4646192
6 [] 2 items
- 0 86.3286037
- 1 27.377032
7 [] 2 items
- 0 86.3189707
- 1 27.2322692
8 [] 2 items
- 0 86.3724302
- 1 27.0819306
9 [] 2 items
- 0 86.4994781
- 1 26.3665064
10 [] 2 items
- 0 88.9849704
- 1 26.7768931
11 [] 2 items
- 0 88.922646
- 1 27.3279489
12 [] 2 items
- 0 88.7386597
- 1 28.2894211
13 [] 2 items
- 0 86.2109749
- 1 27.8815386
14 [] 2 items
- 0 86.2063197
- 1 27.8442304
links [] 7 items
0
- rel "collection"
- href "https://planetarycomputer.microsoft.com/api/stac/v1/collections/sentinel-1-rtc"
- type "application/json"
1
- rel "parent"
- href "https://planetarycomputer.microsoft.com/api/stac/v1/collections/sentinel-1-rtc"
- type "application/json"
2
- rel "root"
- href "https://planetarycomputer.microsoft.com/api/stac/v1"
- type "application/json"
- title "Microsoft Planetary Computer STAC API"
3
- rel "self"
- href "https://planetarycomputer.microsoft.com/api/stac/v1/collections/sentinel-1-rtc/items/S1A_IW_GRDH_1SDV_20220415T121355_20220415T121420_042784_051B30_rtc"
- type "application/geo+json"
4
- rel "license"
- href "https://sentinel.esa.int/documents/247904/690755/Sentinel_Data_Legal_Notice"
5
- rel "derived_from"
- href "https://planetarycomputer.microsoft.com/api/stac/v1/collections/sentinel-1-grd/items/S1A_IW_GRDH_1SDV_20220415T121355_20220415T121420_042784_051B30"
- type "application/json"
- title "Sentinel 1 GRD Item"
6
- rel "preview"
- href "https://planetarycomputer.microsoft.com/api/data/v1/item/map?collection=sentinel-1-rtc&item=S1A_IW_GRDH_1SDV_20220415T121355_20220415T121420_042784_051B30_rtc"
- type "text/html"
- title "Map of item"
assets
vh
- href "https://sentinel1euwestrtc.blob.core.windows.net/sentinel1-grd-rtc/GRD/2022/4/15/IW/DV/S1A_IW_GRDH_1SDV_20220415T121355_20220415T121420_042784_051B30_D3FE/measurement/iw-vh.rtc.tiff"
- type "image/tiff; application=geotiff; profile=cloud-optimized"
- title "VH: vertical transmit, horizontal receive"
- description "Terrain-corrected gamma naught values of signal transmitted with vertical polarization and received with horizontal polarization with radiometric terrain correction applied."
- file:size 1868892861
- file:checksum "3b619cfd2807f46ff13e861a03429313"
raster:bands [] 1 items
0
- nodata -32768
- data_type "float32"
- spatial_resolution 10.0
roles [] 1 items
- 0 "data"
vv
- href "https://sentinel1euwestrtc.blob.core.windows.net/sentinel1-grd-rtc/GRD/2022/4/15/IW/DV/S1A_IW_GRDH_1SDV_20220415T121355_20220415T121420_042784_051B30_D3FE/measurement/iw-vv.rtc.tiff"
- type "image/tiff; application=geotiff; profile=cloud-optimized"
- title "VV: vertical transmit, vertical receive"
- description "Terrain-corrected gamma naught values of signal transmitted with vertical polarization and received with vertical polarization with radiometric terrain correction applied."
- file:size 1877116298
- file:checksum "9a7de98b5c6ef5fe03e5bfb454343326"
raster:bands [] 1 items
0
- nodata -32768
- data_type "float32"
- spatial_resolution 10.0
roles [] 1 items
- 0 "data"
tilejson
- href "https://planetarycomputer.microsoft.com/api/data/v1/item/tilejson.json?collection=sentinel-1-rtc&item=S1A_IW_GRDH_1SDV_20220415T121355_20220415T121420_042784_051B30_rtc&assets=vv&assets=vh&tile_format=png&expression=0.03+%2B+log+%2810e-4+-+log+%280.05+%2F+%280.02+%2B+2+%2A+vv%29%29%29%3B0.05+%2B+exp+%280.25+%2A+%28log+%280.01+%2B+2+%2A+vv%29+%2B+log+%280.02+%2B+5+%2A+vh%29%29%29%3B1+-+log+%280.05+%2F+%280.045+-+0.9+%2A+vv%29%29&asset_as_band=True&rescale=0%2C.8000&rescale=0%2C1.000&rescale=0%2C1.000&format=png"
- type "application/json"
- title "TileJSON with default rendering"
roles [] 1 items
- 0 "tiles"
rendered_preview
- href "https://planetarycomputer.microsoft.com/api/data/v1/item/preview.png?collection=sentinel-1-rtc&item=S1A_IW_GRDH_1SDV_20220415T121355_20220415T121420_042784_051B30_rtc&assets=vv&assets=vh&tile_format=png&expression=0.03+%2B+log+%2810e-4+-+log+%280.05+%2F+%280.02+%2B+2+%2A+vv%29%29%29%3B0.05+%2B+exp+%280.25+%2A+%28log+%280.01+%2B+2+%2A+vv%29+%2B+log+%280.02+%2B+5+%2A+vh%29%29%29%3B1+-+log+%280.05+%2F+%280.045+-+0.9+%2A+vv%29%29&asset_as_band=True&rescale=0%2C.8000&rescale=0%2C1.000&rescale=0%2C1.000&format=png"
- type "image/png"
- title "Rendered preview"
- rel "preview"
roles [] 1 items
- 0 "overview"
bbox [] 4 items
- 0 86.20631967
- 1 26.36650636
- 2 88.9849704
- 3 28.28942109
stac_extensions [] 6 items
- 0 "https://stac-extensions.github.io/sar/v1.0.0/schema.json"
- 1 "https://stac-extensions.github.io/sat/v1.0.0/schema.json"
- 2 "https://stac-extensions.github.io/eo/v1.0.0/schema.json"
- 3 "https://stac-extensions.github.io/projection/v1.0.0/schema.json"
- 4 "https://stac-extensions.github.io/file/v2.0.0/schema.json"
- 5 "https://stac-extensions.github.io/raster/v1.1.0/schema.json"
- collection "sentinel-1-rtc"
26
- type "Feature"
- stac_version "1.0.0"
- id "S1A_IW_GRDH_1SDV_20220410T120547_20220410T120612_042711_0518C0_rtc"
properties
- datetime "2022-04-10T12:06:00.398442Z"
- platform "SENTINEL-1A"
s1:shape [] 2 items
- 0 28425
- 1 21971
proj:bbox [] 4 items
- 0 618210.0
- 1 2960420.0
- 2 902460.0
- 3 3180130.0
- proj:epsg 32645
proj:shape [] 2 items
- 0 21971
- 1 28425
- end_datetime "2022-04-10 12:06:12.897487+00:00"
- constellation "Sentinel-1"
- s1:resolution "high"
proj:transform [] 9 items
- 0 10.0
- 1 0.0
- 2 618210.0
- 3 0.0
- 4 -10.0
- 5 3180130.0
- 6 0.0
- 7 0.0
- 8 1.0
- s1:datatake_id "334016"
- start_datetime "2022-04-10 12:05:47.899396+00:00"
- s1:orbit_source "RESORB"
- s1:slice_number "6"
- s1:total_slices "21"
- sar:looks_range 5
- sat:orbit_state "ascending"
- sar:product_type "GRD"
- sar:looks_azimuth 1
sar:polarizations [] 2 items
- 0 "VV"
- 1 "VH"
- sar:frequency_band "C"
- sat:absolute_orbit 42711
- sat:relative_orbit 114
- s1:processing_level "1"
- sar:instrument_mode "IW"
- sar:center_frequency 5.405
- sar:resolution_range 20
- s1:product_timeliness "Fast-24h"
- sar:resolution_azimuth 22
- sar:pixel_spacing_range 10
- sar:observation_direction "right"
- sar:pixel_spacing_azimuth 10
- sar:looks_equivalent_number 4.4
- s1:instrument_configuration_ID "7"
- sat:platform_international_designator "2014-016A"
geometry
- type "Polygon"
coordinates [] 1 items
0 [] 14 items
0 [] 2 items
- 0 89.9820381
- 1 27.0124165
1 [] 2 items
- 0 90.9937348
- 1 27.172744
2 [] 2 items
- 0 90.7249506
- 1 28.6817327
3 [] 2 items
- 0 88.2178857
- 1 28.2796704
4 [] 2 items
- 0 88.3554765
- 1 27.7231928
5 [] 2 items
- 0 88.3300611
- 1 27.5844335
6 [] 2 items
- 0 88.3766953
- 1 27.5222385
7 [] 2 items
- 0 88.3583975
- 1 27.408955
8 [] 2 items
- 0 88.4006749
- 1 27.3366854
9 [] 2 items
- 0 88.379428
- 1 27.3023248
10 [] 2 items
- 0 88.4162082
- 1 27.2066355
11 [] 2 items
- 0 88.4045434
- 1 27.0893141
12 [] 2 items
- 0 88.4755317
- 1 26.7595106
13 [] 2 items
- 0 89.9820381
- 1 27.0124165
links [] 7 items
0
- rel "collection"
- href "https://planetarycomputer.microsoft.com/api/stac/v1/collections/sentinel-1-rtc"
- type "application/json"
1
- rel "parent"
- href "https://planetarycomputer.microsoft.com/api/stac/v1/collections/sentinel-1-rtc"
- type "application/json"
2
- rel "root"
- href "https://planetarycomputer.microsoft.com/api/stac/v1"
- type "application/json"
- title "Microsoft Planetary Computer STAC API"
3
- rel "self"
- href "https://planetarycomputer.microsoft.com/api/stac/v1/collections/sentinel-1-rtc/items/S1A_IW_GRDH_1SDV_20220410T120547_20220410T120612_042711_0518C0_rtc"
- type "application/geo+json"
4
- rel "license"
- href "https://sentinel.esa.int/documents/247904/690755/Sentinel_Data_Legal_Notice"
5
- rel "derived_from"
- href "https://planetarycomputer.microsoft.com/api/stac/v1/collections/sentinel-1-grd/items/S1A_IW_GRDH_1SDV_20220410T120547_20220410T120612_042711_0518C0"
- type "application/json"
- title "Sentinel 1 GRD Item"
6
- rel "preview"
- href "https://planetarycomputer.microsoft.com/api/data/v1/item/map?collection=sentinel-1-rtc&item=S1A_IW_GRDH_1SDV_20220410T120547_20220410T120612_042711_0518C0_rtc"
- type "text/html"
- title "Map of item"
assets
vh
- href "https://sentinel1euwestrtc.blob.core.windows.net/sentinel1-grd-rtc/GRD/2022/4/10/IW/DV/S1A_IW_GRDH_1SDV_20220410T120547_20220410T120612_042711_0518C0_AD57/measurement/iw-vh.rtc.tiff"
- type "image/tiff; application=geotiff; profile=cloud-optimized"
- title "VH: vertical transmit, horizontal receive"
- description "Terrain-corrected gamma naught values of signal transmitted with vertical polarization and received with horizontal polarization with radiometric terrain correction applied."
- file:size 1849248469
- file:checksum "dc4ded4cc868bfd7bdbf128b40755c07"
raster:bands [] 1 items
0
- nodata -32768
- data_type "float32"
- spatial_resolution 10.0
roles [] 1 items
- 0 "data"
vv
- href "https://sentinel1euwestrtc.blob.core.windows.net/sentinel1-grd-rtc/GRD/2022/4/10/IW/DV/S1A_IW_GRDH_1SDV_20220410T120547_20220410T120612_042711_0518C0_AD57/measurement/iw-vv.rtc.tiff"
- type "image/tiff; application=geotiff; profile=cloud-optimized"
- title "VV: vertical transmit, vertical receive"
- description "Terrain-corrected gamma naught values of signal transmitted with vertical polarization and received with vertical polarization with radiometric terrain correction applied."
- file:size 1857800450
- file:checksum "370dbbe6800649f6dab0845d3b3b5d3b"
raster:bands [] 1 items
0
- nodata -32768
- data_type "float32"
- spatial_resolution 10.0
roles [] 1 items
- 0 "data"
tilejson
- href "https://planetarycomputer.microsoft.com/api/data/v1/item/tilejson.json?collection=sentinel-1-rtc&item=S1A_IW_GRDH_1SDV_20220410T120547_20220410T120612_042711_0518C0_rtc&assets=vv&assets=vh&tile_format=png&expression=0.03+%2B+log+%2810e-4+-+log+%280.05+%2F+%280.02+%2B+2+%2A+vv%29%29%29%3B0.05+%2B+exp+%280.25+%2A+%28log+%280.01+%2B+2+%2A+vv%29+%2B+log+%280.02+%2B+5+%2A+vh%29%29%29%3B1+-+log+%280.05+%2F+%280.045+-+0.9+%2A+vv%29%29&asset_as_band=True&rescale=0%2C.8000&rescale=0%2C1.000&rescale=0%2C1.000&format=png"
- type "application/json"
- title "TileJSON with default rendering"
roles [] 1 items
- 0 "tiles"
rendered_preview
- href "https://planetarycomputer.microsoft.com/api/data/v1/item/preview.png?collection=sentinel-1-rtc&item=S1A_IW_GRDH_1SDV_20220410T120547_20220410T120612_042711_0518C0_rtc&assets=vv&assets=vh&tile_format=png&expression=0.03+%2B+log+%2810e-4+-+log+%280.05+%2F+%280.02+%2B+2+%2A+vv%29%29%29%3B0.05+%2B+exp+%280.25+%2A+%28log+%280.01+%2B+2+%2A+vv%29+%2B+log+%280.02+%2B+5+%2A+vh%29%29%29%3B1+-+log+%280.05+%2F+%280.045+-+0.9+%2A+vv%29%29&asset_as_band=True&rescale=0%2C.8000&rescale=0%2C1.000&rescale=0%2C1.000&format=png"
- type "image/png"
- title "Rendered preview"
- rel "preview"
roles [] 1 items
- 0 "overview"
bbox [] 4 items
- 0 88.21788565
- 1 26.75951062
- 2 90.99373478
- 3 28.6817327
stac_extensions [] 6 items
- 0 "https://stac-extensions.github.io/sar/v1.0.0/schema.json"
- 1 "https://stac-extensions.github.io/sat/v1.0.0/schema.json"
- 2 "https://stac-extensions.github.io/eo/v1.0.0/schema.json"
- 3 "https://stac-extensions.github.io/projection/v1.0.0/schema.json"
- 4 "https://stac-extensions.github.io/file/v2.0.0/schema.json"
- 5 "https://stac-extensions.github.io/raster/v1.1.0/schema.json"
- collection "sentinel-1-rtc"
27
- type "Feature"
- stac_version "1.0.0"
- id "S1A_IW_GRDH_1SDV_20220406T000313_20220406T000338_042645_051682_rtc"
properties
- datetime "2022-04-06T00:03:26.181999Z"
- platform "SENTINEL-1A"
s1:shape [] 2 items
- 0 27529
- 1 21083
proj:bbox [] 4 items
- 0 524490.0
- 1 2980850.0
- 2 799780.0
- 3 3191680.0
- proj:epsg 32645
proj:shape [] 2 items
- 0 21083
- 1 27529
- end_datetime "2022-04-06 00:03:38.681256+00:00"
- constellation "Sentinel-1"
- s1:resolution "high"
proj:transform [] 9 items
- 0 10.0
- 1 0.0
- 2 524490.0
- 3 0.0
- 4 -10.0
- 5 3191680.0
- 6 0.0
- 7 0.0
- 8 1.0
- s1:datatake_id "333442"
- start_datetime "2022-04-06 00:03:13.682743+00:00"
- s1:orbit_source "RESORB"
- s1:slice_number "12"
- s1:total_slices "17"
- sar:looks_range 5
- sat:orbit_state "descending"
- sar:product_type "GRD"
- sar:looks_azimuth 1
sar:polarizations [] 2 items
- 0 "VV"
- 1 "VH"
- sar:frequency_band "C"
- sat:absolute_orbit 42645
- sat:relative_orbit 48
- s1:processing_level "1"
- sar:instrument_mode "IW"
- sar:center_frequency 5.405
- sar:resolution_range 20
- s1:product_timeliness "Fast-24h"
- sar:resolution_azimuth 22
- sar:pixel_spacing_range 10
- sar:observation_direction "right"
- sar:pixel_spacing_azimuth 10
- sar:looks_equivalent_number 4.4
- s1:instrument_configuration_ID "7"
- sat:platform_international_designator "2014-016A"
geometry
- type "Polygon"
coordinates [] 1 items
0 [] 19 items
0 [] 2 items
- 0 89.8039112
- 1 27.0228452
1 [] 2 items
- 0 89.8290894
- 1 27.2746397
2 [] 2 items
- 0 89.9023381
- 1 27.4314639
3 [] 2 items
- 0 89.9214952
- 1 27.6321447
4 [] 2 items
- 0 89.9524157
- 1 27.678398
5 [] 2 items
- 0 89.9283287
- 1 27.8234245
6 [] 2 items
- 0 89.9441448
- 1 27.9504601
7 [] 2 items
- 0 89.9874385
- 1 28.002747
8 [] 2 items
- 0 89.9710817
- 1 28.0842856
9 [] 2 items
- 0 89.9975778
- 1 28.1482937
10 [] 2 items
- 0 89.9730304
- 1 28.1916754
11 [] 2 items
- 0 90.0260316
- 1 28.2911759
12 [] 2 items
- 0 90.0495468
- 1 28.4417784
13 [] 2 items
- 0 87.5584305
- 1 28.8402053
14 [] 2 items
- 0 87.4257925
- 1 28.1939872
15 [] 2 items
- 0 87.3052825
- 1 27.3293809
16 [] 2 items
- 0 89.7846715
- 1 26.9227187
17 [] 2 items
- 0 89.7768369
- 1 26.9951874
18 [] 2 items
- 0 89.8039112
- 1 27.0228452
links [] 7 items
0
- rel "collection"
- href "https://planetarycomputer.microsoft.com/api/stac/v1/collections/sentinel-1-rtc"
- type "application/json"
1
- rel "parent"
- href "https://planetarycomputer.microsoft.com/api/stac/v1/collections/sentinel-1-rtc"
- type "application/json"
2
- rel "root"
- href "https://planetarycomputer.microsoft.com/api/stac/v1"
- type "application/json"
- title "Microsoft Planetary Computer STAC API"
3
- rel "self"
- href "https://planetarycomputer.microsoft.com/api/stac/v1/collections/sentinel-1-rtc/items/S1A_IW_GRDH_1SDV_20220406T000313_20220406T000338_042645_051682_rtc"
- type "application/geo+json"
4
- rel "license"
- href "https://sentinel.esa.int/documents/247904/690755/Sentinel_Data_Legal_Notice"
5
- rel "derived_from"
- href "https://planetarycomputer.microsoft.com/api/stac/v1/collections/sentinel-1-grd/items/S1A_IW_GRDH_1SDV_20220406T000313_20220406T000338_042645_051682"
- type "application/json"
- title "Sentinel 1 GRD Item"
6
- rel "preview"
- href "https://planetarycomputer.microsoft.com/api/data/v1/item/map?collection=sentinel-1-rtc&item=S1A_IW_GRDH_1SDV_20220406T000313_20220406T000338_042645_051682_rtc"
- type "text/html"
- title "Map of item"
assets
vh
- href "https://sentinel1euwestrtc.blob.core.windows.net/sentinel1-grd-rtc/GRD/2022/4/6/IW/DV/S1A_IW_GRDH_1SDV_20220406T000313_20220406T000338_042645_051682_FF5D/measurement/iw-vh.rtc.tiff"
- type "image/tiff; application=geotiff; profile=cloud-optimized"
- title "VH: vertical transmit, horizontal receive"
- description "Terrain-corrected gamma naught values of signal transmitted with vertical polarization and received with horizontal polarization with radiometric terrain correction applied."
- file:size 1839808152
- file:checksum "74d860c0f0de2a006b6e029b8f6773e3"
raster:bands [] 1 items
0
- nodata -32768
- data_type "float32"
- spatial_resolution 10.0
roles [] 1 items
- 0 "data"
vv
- href "https://sentinel1euwestrtc.blob.core.windows.net/sentinel1-grd-rtc/GRD/2022/4/6/IW/DV/S1A_IW_GRDH_1SDV_20220406T000313_20220406T000338_042645_051682_FF5D/measurement/iw-vv.rtc.tiff"
- type "image/tiff; application=geotiff; profile=cloud-optimized"
- title "VV: vertical transmit, vertical receive"
- description "Terrain-corrected gamma naught values of signal transmitted with vertical polarization and received with vertical polarization with radiometric terrain correction applied."
- file:size 1846408660
- file:checksum "8a0842501473ea58f12928031b306a93"
raster:bands [] 1 items
0
- nodata -32768
- data_type "float32"
- spatial_resolution 10.0
roles [] 1 items
- 0 "data"
tilejson
- href "https://planetarycomputer.microsoft.com/api/data/v1/item/tilejson.json?collection=sentinel-1-rtc&item=S1A_IW_GRDH_1SDV_20220406T000313_20220406T000338_042645_051682_rtc&assets=vv&assets=vh&tile_format=png&expression=0.03+%2B+log+%2810e-4+-+log+%280.05+%2F+%280.02+%2B+2+%2A+vv%29%29%29%3B0.05+%2B+exp+%280.25+%2A+%28log+%280.01+%2B+2+%2A+vv%29+%2B+log+%280.02+%2B+5+%2A+vh%29%29%29%3B1+-+log+%280.05+%2F+%280.045+-+0.9+%2A+vv%29%29&asset_as_band=True&rescale=0%2C.8000&rescale=0%2C1.000&rescale=0%2C1.000&format=png"
- type "application/json"
- title "TileJSON with default rendering"
roles [] 1 items
- 0 "tiles"
rendered_preview
- href "https://planetarycomputer.microsoft.com/api/data/v1/item/preview.png?collection=sentinel-1-rtc&item=S1A_IW_GRDH_1SDV_20220406T000313_20220406T000338_042645_051682_rtc&assets=vv&assets=vh&tile_format=png&expression=0.03+%2B+log+%2810e-4+-+log+%280.05+%2F+%280.02+%2B+2+%2A+vv%29%29%29%3B0.05+%2B+exp+%280.25+%2A+%28log+%280.01+%2B+2+%2A+vv%29+%2B+log+%280.02+%2B+5+%2A+vh%29%29%29%3B1+-+log+%280.05+%2F+%280.045+-+0.9+%2A+vv%29%29&asset_as_band=True&rescale=0%2C.8000&rescale=0%2C1.000&rescale=0%2C1.000&format=png"
- type "image/png"
- title "Rendered preview"
- rel "preview"
roles [] 1 items
- 0 "overview"
bbox [] 4 items
- 0 87.30528253
- 1 26.92271872
- 2 90.04954684
- 3 28.8402053
stac_extensions [] 6 items
- 0 "https://stac-extensions.github.io/sar/v1.0.0/schema.json"
- 1 "https://stac-extensions.github.io/sat/v1.0.0/schema.json"
- 2 "https://stac-extensions.github.io/eo/v1.0.0/schema.json"
- 3 "https://stac-extensions.github.io/projection/v1.0.0/schema.json"
- 4 "https://stac-extensions.github.io/file/v2.0.0/schema.json"
- 5 "https://stac-extensions.github.io/raster/v1.1.0/schema.json"
- collection "sentinel-1-rtc"
28
- type "Feature"
- stac_version "1.0.0"
- id "S1A_IW_GRDH_1SDV_20220403T121355_20220403T121420_042609_05154A_rtc"
properties
- datetime "2022-04-03T12:14:07.585924Z"
- platform "SENTINEL-1A"
s1:shape [] 2 items
- 0 28170
- 1 21598
proj:bbox [] 4 items
- 0 421570.0
- 1 2916200.0
- 2 703270.0
- 3 3132180.0
- proj:epsg 32645
proj:shape [] 2 items
- 0 21598
- 1 28170
- end_datetime "2022-04-03 12:14:20.084951+00:00"
- constellation "Sentinel-1"
- s1:resolution "high"
proj:transform [] 9 items
- 0 10.0
- 1 0.0
- 2 421570.0
- 3 0.0
- 4 -10.0
- 5 3132180.0
- 6 0.0
- 7 0.0
- 8 1.0
- s1:datatake_id "333130"
- start_datetime "2022-04-03 12:13:55.086898+00:00"
- s1:orbit_source "PREORB"
- s1:slice_number "6"
- s1:total_slices "20"
- sar:looks_range 5
- sat:orbit_state "ascending"
- sar:product_type "GRD"
- sar:looks_azimuth 1
sar:polarizations [] 2 items
- 0 "VV"
- 1 "VH"
- sar:frequency_band "C"
- sat:absolute_orbit 42609
- sat:relative_orbit 12
- s1:processing_level "1"
- sar:instrument_mode "IW"
- sar:center_frequency 5.405
- sar:resolution_range 20
- s1:product_timeliness "Fast-24h"
- sar:resolution_azimuth 22
- sar:pixel_spacing_range 10
- sar:observation_direction "right"
- sar:pixel_spacing_azimuth 10
- sar:looks_equivalent_number 4.4
- s1:instrument_configuration_ID "7"
- sat:platform_international_designator "2014-016A"
geometry
- type "Polygon"
coordinates [] 1 items
0 [] 15 items
0 [] 2 items
- 0 86.2034604
- 1 27.8463805
1 [] 2 items
- 0 86.2093067
- 1 27.7823671
2 [] 2 items
- 0 86.2341796
- 1 27.7815142
3 [] 2 items
- 0 86.2156862
- 1 27.7561346
4 [] 2 items
- 0 86.2700615
- 1 27.6973942
5 [] 2 items
- 0 86.2768677
- 1 27.4639805
6 [] 2 items
- 0 86.3263828
- 1 27.3763893
7 [] 2 items
- 0 86.3179652
- 1 27.231542
8 [] 2 items
- 0 86.3547288
- 1 27.1611172
9 [] 2 items
- 0 86.4983763
- 1 26.3663219
10 [] 2 items
- 0 88.9839619
- 1 26.7767267
11 [] 2 items
- 0 88.922032
- 1 27.3275061
12 [] 2 items
- 0 88.7374335
- 1 28.2892562
13 [] 2 items
- 0 86.2107718
- 1 27.8815375
14 [] 2 items
- 0 86.2034604
- 1 27.8463805
links [] 7 items
0
- rel "collection"
- href "https://planetarycomputer.microsoft.com/api/stac/v1/collections/sentinel-1-rtc"
- type "application/json"
1
- rel "parent"
- href "https://planetarycomputer.microsoft.com/api/stac/v1/collections/sentinel-1-rtc"
- type "application/json"
2
- rel "root"
- href "https://planetarycomputer.microsoft.com/api/stac/v1"
- type "application/json"
- title "Microsoft Planetary Computer STAC API"
3
- rel "self"
- href "https://planetarycomputer.microsoft.com/api/stac/v1/collections/sentinel-1-rtc/items/S1A_IW_GRDH_1SDV_20220403T121355_20220403T121420_042609_05154A_rtc"
- type "application/geo+json"
4
- rel "license"
- href "https://sentinel.esa.int/documents/247904/690755/Sentinel_Data_Legal_Notice"
5
- rel "derived_from"
- href "https://planetarycomputer.microsoft.com/api/stac/v1/collections/sentinel-1-grd/items/S1A_IW_GRDH_1SDV_20220403T121355_20220403T121420_042609_05154A"
- type "application/json"
- title "Sentinel 1 GRD Item"
6
- rel "preview"
- href "https://planetarycomputer.microsoft.com/api/data/v1/item/map?collection=sentinel-1-rtc&item=S1A_IW_GRDH_1SDV_20220403T121355_20220403T121420_042609_05154A_rtc"
- type "text/html"
- title "Map of item"
assets
vh
- href "https://sentinel1euwestrtc.blob.core.windows.net/sentinel1-grd-rtc/GRD/2022/4/3/IW/DV/S1A_IW_GRDH_1SDV_20220403T121355_20220403T121420_042609_05154A_A72B/measurement/iw-vh.rtc.tiff"
- type "image/tiff; application=geotiff; profile=cloud-optimized"
- title "VH: vertical transmit, horizontal receive"
- description "Terrain-corrected gamma naught values of signal transmitted with vertical polarization and received with horizontal polarization with radiometric terrain correction applied."
- file:size 1868994854
- file:checksum "0083767d8612852440a827fee64becb3"
raster:bands [] 1 items
0
- nodata -32768
- data_type "float32"
- spatial_resolution 10.0
roles [] 1 items
- 0 "data"
vv
- href "https://sentinel1euwestrtc.blob.core.windows.net/sentinel1-grd-rtc/GRD/2022/4/3/IW/DV/S1A_IW_GRDH_1SDV_20220403T121355_20220403T121420_042609_05154A_A72B/measurement/iw-vv.rtc.tiff"
- type "image/tiff; application=geotiff; profile=cloud-optimized"
- title "VV: vertical transmit, vertical receive"
- description "Terrain-corrected gamma naught values of signal transmitted with vertical polarization and received with vertical polarization with radiometric terrain correction applied."
- file:size 1877132508
- file:checksum "d65e427c9d9cd02d63735ed3dcf51796"
raster:bands [] 1 items
0
- nodata -32768
- data_type "float32"
- spatial_resolution 10.0
roles [] 1 items
- 0 "data"
tilejson
- href "https://planetarycomputer.microsoft.com/api/data/v1/item/tilejson.json?collection=sentinel-1-rtc&item=S1A_IW_GRDH_1SDV_20220403T121355_20220403T121420_042609_05154A_rtc&assets=vv&assets=vh&tile_format=png&expression=0.03+%2B+log+%2810e-4+-+log+%280.05+%2F+%280.02+%2B+2+%2A+vv%29%29%29%3B0.05+%2B+exp+%280.25+%2A+%28log+%280.01+%2B+2+%2A+vv%29+%2B+log+%280.02+%2B+5+%2A+vh%29%29%29%3B1+-+log+%280.05+%2F+%280.045+-+0.9+%2A+vv%29%29&asset_as_band=True&rescale=0%2C.8000&rescale=0%2C1.000&rescale=0%2C1.000&format=png"
- type "application/json"
- title "TileJSON with default rendering"
roles [] 1 items
- 0 "tiles"
rendered_preview
- href "https://planetarycomputer.microsoft.com/api/data/v1/item/preview.png?collection=sentinel-1-rtc&item=S1A_IW_GRDH_1SDV_20220403T121355_20220403T121420_042609_05154A_rtc&assets=vv&assets=vh&tile_format=png&expression=0.03+%2B+log+%2810e-4+-+log+%280.05+%2F+%280.02+%2B+2+%2A+vv%29%29%29%3B0.05+%2B+exp+%280.25+%2A+%28log+%280.01+%2B+2+%2A+vv%29+%2B+log+%280.02+%2B+5+%2A+vh%29%29%29%3B1+-+log+%280.05+%2F+%280.045+-+0.9+%2A+vv%29%29&asset_as_band=True&rescale=0%2C.8000&rescale=0%2C1.000&rescale=0%2C1.000&format=png"
- type "image/png"
- title "Rendered preview"
- rel "preview"
roles [] 1 items
- 0 "overview"
bbox [] 4 items
- 0 86.20346043
- 1 26.36632192
- 2 88.98396194
- 3 28.28925621
stac_extensions [] 6 items
- 0 "https://stac-extensions.github.io/sar/v1.0.0/schema.json"
- 1 "https://stac-extensions.github.io/sat/v1.0.0/schema.json"
- 2 "https://stac-extensions.github.io/eo/v1.0.0/schema.json"
- 3 "https://stac-extensions.github.io/projection/v1.0.0/schema.json"
- 4 "https://stac-extensions.github.io/file/v2.0.0/schema.json"
- 5 "https://stac-extensions.github.io/raster/v1.1.0/schema.json"
- collection "sentinel-1-rtc"
29
- type "Feature"
- stac_version "1.0.0"
- id "S1A_IW_GRDH_1SDV_20220329T120547_20220329T120612_042536_0512D7_rtc"
properties
- datetime "2022-03-29T12:06:00.140262Z"
- platform "SENTINEL-1A"
s1:shape [] 2 items
- 0 28426
- 1 21971
proj:bbox [] 4 items
- 0 618160.0
- 1 2960420.0
- 2 902420.0
- 3 3180130.0
- proj:epsg 32645
proj:shape [] 2 items
- 0 21971
- 1 28426
- end_datetime "2022-03-29 12:06:12.640119+00:00"
- constellation "Sentinel-1"
- s1:resolution "high"
proj:transform [] 9 items
- 0 10.0
- 1 0.0
- 2 618160.0
- 3 0.0
- 4 -10.0
- 5 3180130.0
- 6 0.0
- 7 0.0
- 8 1.0
- s1:datatake_id "332503"
- start_datetime "2022-03-29 12:05:47.640405+00:00"
- s1:orbit_source "PREORB"
- s1:slice_number "6"
- s1:total_slices "21"
- sar:looks_range 5
- sat:orbit_state "ascending"
- sar:product_type "GRD"
- sar:looks_azimuth 1
sar:polarizations [] 2 items
- 0 "VV"
- 1 "VH"
- sar:frequency_band "C"
- sat:absolute_orbit 42536
- sat:relative_orbit 114
- s1:processing_level "1"
- sar:instrument_mode "IW"
- sar:center_frequency 5.405
- sar:resolution_range 20
- s1:product_timeliness "Fast-24h"
- sar:resolution_azimuth 22
- sar:pixel_spacing_range 10
- sar:observation_direction "right"
- sar:pixel_spacing_azimuth 10
- sar:looks_equivalent_number 4.4
- s1:instrument_configuration_ID "7"
- sat:platform_international_designator "2014-016A"
geometry
- type "Polygon"
coordinates [] 1 items
0 [] 14 items
0 [] 2 items
- 0 89.9823401
- 1 27.0124101
1 [] 2 items
- 0 90.9934295
- 1 27.1726625
2 [] 2 items
- 0 90.7245421
- 1 28.681744
3 [] 2 items
- 0 88.2173759
- 1 28.2796749
4 [] 2 items
- 0 88.3545637
- 1 27.7232017
5 [] 2 items
- 0 88.3295524
- 1 27.5842579
6 [] 2 items
- 0 88.3760845
- 1 27.5219738
7 [] 2 items
- 0 88.3576895
- 1 27.4089619
8 [] 2 items
- 0 88.4000652
- 1 27.3364208
9 [] 2 items
- 0 88.3790272
- 1 27.3025995
10 [] 2 items
- 0 88.4159077
- 1 27.2068191
11 [] 2 items
- 0 88.4039384
- 1 27.0893202
12 [] 2 items
- 0 88.4750267
- 1 26.7593353
13 [] 2 items
- 0 89.9823401
- 1 27.0124101
links [] 7 items
0
- rel "collection"
- href "https://planetarycomputer.microsoft.com/api/stac/v1/collections/sentinel-1-rtc"
- type "application/json"
1
- rel "parent"
- href "https://planetarycomputer.microsoft.com/api/stac/v1/collections/sentinel-1-rtc"
- type "application/json"
2
- rel "root"
- href "https://planetarycomputer.microsoft.com/api/stac/v1"
- type "application/json"
- title "Microsoft Planetary Computer STAC API"
3
- rel "self"
- href "https://planetarycomputer.microsoft.com/api/stac/v1/collections/sentinel-1-rtc/items/S1A_IW_GRDH_1SDV_20220329T120547_20220329T120612_042536_0512D7_rtc"
- type "application/geo+json"
4
- rel "license"
- href "https://sentinel.esa.int/documents/247904/690755/Sentinel_Data_Legal_Notice"
5
- rel "derived_from"
- href "https://planetarycomputer.microsoft.com/api/stac/v1/collections/sentinel-1-grd/items/S1A_IW_GRDH_1SDV_20220329T120547_20220329T120612_042536_0512D7"
- type "application/json"
- title "Sentinel 1 GRD Item"
6
- rel "preview"
- href "https://planetarycomputer.microsoft.com/api/data/v1/item/map?collection=sentinel-1-rtc&item=S1A_IW_GRDH_1SDV_20220329T120547_20220329T120612_042536_0512D7_rtc"
- type "text/html"
- title "Map of item"
assets
vh
- href "https://sentinel1euwestrtc.blob.core.windows.net/sentinel1-grd-rtc/GRD/2022/3/29/IW/DV/S1A_IW_GRDH_1SDV_20220329T120547_20220329T120612_042536_0512D7_2F9F/measurement/iw-vh.rtc.tiff"
- type "image/tiff; application=geotiff; profile=cloud-optimized"
- title "VH: vertical transmit, horizontal receive"
- description "Terrain-corrected gamma naught values of signal transmitted with vertical polarization and received with horizontal polarization with radiometric terrain correction applied."
- file:size 1851366425
- file:checksum "e0ae64a9ff78467d090c853e5ad141b3"
raster:bands [] 1 items
0
- nodata -32768
- data_type "float32"
- spatial_resolution 10.0
roles [] 1 items
- 0 "data"
vv
- href "https://sentinel1euwestrtc.blob.core.windows.net/sentinel1-grd-rtc/GRD/2022/3/29/IW/DV/S1A_IW_GRDH_1SDV_20220329T120547_20220329T120612_042536_0512D7_2F9F/measurement/iw-vv.rtc.tiff"
- type "image/tiff; application=geotiff; profile=cloud-optimized"
- title "VV: vertical transmit, vertical receive"
- description "Terrain-corrected gamma naught values of signal transmitted with vertical polarization and received with vertical polarization with radiometric terrain correction applied."
- file:size 1859964499
- file:checksum "b6be367b82761770f77554a188f62277"
raster:bands [] 1 items
0
- nodata -32768
- data_type "float32"
- spatial_resolution 10.0
roles [] 1 items
- 0 "data"
tilejson
- href "https://planetarycomputer.microsoft.com/api/data/v1/item/tilejson.json?collection=sentinel-1-rtc&item=S1A_IW_GRDH_1SDV_20220329T120547_20220329T120612_042536_0512D7_rtc&assets=vv&assets=vh&tile_format=png&expression=0.03+%2B+log+%2810e-4+-+log+%280.05+%2F+%280.02+%2B+2+%2A+vv%29%29%29%3B0.05+%2B+exp+%280.25+%2A+%28log+%280.01+%2B+2+%2A+vv%29+%2B+log+%280.02+%2B+5+%2A+vh%29%29%29%3B1+-+log+%280.05+%2F+%280.045+-+0.9+%2A+vv%29%29&asset_as_band=True&rescale=0%2C.8000&rescale=0%2C1.000&rescale=0%2C1.000&format=png"
- type "application/json"
- title "TileJSON with default rendering"
roles [] 1 items
- 0 "tiles"
rendered_preview
- href "https://planetarycomputer.microsoft.com/api/data/v1/item/preview.png?collection=sentinel-1-rtc&item=S1A_IW_GRDH_1SDV_20220329T120547_20220329T120612_042536_0512D7_rtc&assets=vv&assets=vh&tile_format=png&expression=0.03+%2B+log+%2810e-4+-+log+%280.05+%2F+%280.02+%2B+2+%2A+vv%29%29%29%3B0.05+%2B+exp+%280.25+%2A+%28log+%280.01+%2B+2+%2A+vv%29+%2B+log+%280.02+%2B+5+%2A+vh%29%29%29%3B1+-+log+%280.05+%2F+%280.045+-+0.9+%2A+vv%29%29&asset_as_band=True&rescale=0%2C.8000&rescale=0%2C1.000&rescale=0%2C1.000&format=png"
- type "image/png"
- title "Rendered preview"
- rel "preview"
roles [] 1 items
- 0 "overview"
bbox [] 4 items
- 0 88.21737592
- 1 26.75933533
- 2 90.99342947
- 3 28.68174395
stac_extensions [] 6 items
- 0 "https://stac-extensions.github.io/sar/v1.0.0/schema.json"
- 1 "https://stac-extensions.github.io/sat/v1.0.0/schema.json"
- 2 "https://stac-extensions.github.io/eo/v1.0.0/schema.json"
- 3 "https://stac-extensions.github.io/projection/v1.0.0/schema.json"
- 4 "https://stac-extensions.github.io/file/v2.0.0/schema.json"
- 5 "https://stac-extensions.github.io/raster/v1.1.0/schema.json"
- collection "sentinel-1-rtc"
30
- type "Feature"
- stac_version "1.0.0"
- id "S1A_IW_GRDH_1SDV_20220325T000313_20220325T000338_042470_051096_rtc"
properties
- datetime "2022-03-25T00:03:26.139523Z"
- platform "SENTINEL-1A"
s1:shape [] 2 items
- 0 27531
- 1 21084
proj:bbox [] 4 items
- 0 524460.0
- 1 2980840.0
- 2 799770.0
- 3 3191680.0
- proj:epsg 32645
proj:shape [] 2 items
- 0 21084
- 1 27531
- end_datetime "2022-03-25 00:03:38.638828+00:00"
- constellation "Sentinel-1"
- s1:resolution "high"
proj:transform [] 9 items
- 0 10.0
- 1 0.0
- 2 524460.0
- 3 0.0
- 4 -10.0
- 5 3191680.0
- 6 0.0
- 7 0.0
- 8 1.0
- s1:datatake_id "331926"
- start_datetime "2022-03-25 00:03:13.640217+00:00"
- s1:orbit_source "RESORB"
- s1:slice_number "12"
- s1:total_slices "17"
- sar:looks_range 5
- sat:orbit_state "descending"
- sar:product_type "GRD"
- sar:looks_azimuth 1
sar:polarizations [] 2 items
- 0 "VV"
- 1 "VH"
- sar:frequency_band "C"
- sat:absolute_orbit 42470
- sat:relative_orbit 48
- s1:processing_level "1"
- sar:instrument_mode "IW"
- sar:center_frequency 5.405
- sar:resolution_range 20
- s1:product_timeliness "Fast-24h"
- sar:resolution_azimuth 22
- sar:pixel_spacing_range 10
- sar:observation_direction "right"
- sar:pixel_spacing_azimuth 10
- sar:looks_equivalent_number 4.4
- s1:instrument_configuration_ID "7"
- sat:platform_international_designator "2014-016A"
geometry
- type "Polygon"
coordinates [] 1 items
0 [] 19 items
0 [] 2 items
- 0 89.8037166
- 1 27.0231197
1 [] 2 items
- 0 89.8289885
- 1 27.2746417
2 [] 2 items
- 0 89.9017413
- 1 27.4318372
3 [] 2 items
- 0 89.9212903
- 1 27.6320588
4 [] 2 items
- 0 89.9522131
- 1 27.6784023
5 [] 2 items
- 0 89.9281235
- 1 27.8233386
6 [] 2 items
- 0 89.9439393
- 1 27.9503743
7 [] 2 items
- 0 89.9873419
- 1 28.0029295
8 [] 2 items
- 0 89.97098
- 1 28.0842878
9 [] 2 items
- 0 89.9974736
- 1 28.1482058
10 [] 2 items
- 0 89.9729286
- 1 28.1916776
11 [] 2 items
- 0 90.0258228
- 1 28.2910002
12 [] 2 items
- 0 90.0494423
- 1 28.4416906
13 [] 2 items
- 0 87.558123
- 1 28.8402066
14 [] 2 items
- 0 87.4255888
- 1 28.1939879
15 [] 2 items
- 0 87.3050794
- 1 27.3290202
16 [] 2 items
- 0 89.7846693
- 1 26.9226285
17 [] 2 items
- 0 89.7766356
- 1 26.9951914
18 [] 2 items
- 0 89.8037166
- 1 27.0231197
links [] 7 items
0
- rel "collection"
- href "https://planetarycomputer.microsoft.com/api/stac/v1/collections/sentinel-1-rtc"
- type "application/json"
1
- rel "parent"
- href "https://planetarycomputer.microsoft.com/api/stac/v1/collections/sentinel-1-rtc"
- type "application/json"
2
- rel "root"
- href "https://planetarycomputer.microsoft.com/api/stac/v1"
- type "application/json"
- title "Microsoft Planetary Computer STAC API"
3
- rel "self"
- href "https://planetarycomputer.microsoft.com/api/stac/v1/collections/sentinel-1-rtc/items/S1A_IW_GRDH_1SDV_20220325T000313_20220325T000338_042470_051096_rtc"
- type "application/geo+json"
4
- rel "license"
- href "https://sentinel.esa.int/documents/247904/690755/Sentinel_Data_Legal_Notice"
5
- rel "derived_from"
- href "https://planetarycomputer.microsoft.com/api/stac/v1/collections/sentinel-1-grd/items/S1A_IW_GRDH_1SDV_20220325T000313_20220325T000338_042470_051096"
- type "application/json"
- title "Sentinel 1 GRD Item"
6
- rel "preview"
- href "https://planetarycomputer.microsoft.com/api/data/v1/item/map?collection=sentinel-1-rtc&item=S1A_IW_GRDH_1SDV_20220325T000313_20220325T000338_042470_051096_rtc"
- type "text/html"
- title "Map of item"
assets
vh
- href "https://sentinel1euwestrtc.blob.core.windows.net/sentinel1-grd-rtc/GRD/2022/3/25/IW/DV/S1A_IW_GRDH_1SDV_20220325T000313_20220325T000338_042470_051096_641B/measurement/iw-vh.rtc.tiff"
- type "image/tiff; application=geotiff; profile=cloud-optimized"
- title "VH: vertical transmit, horizontal receive"
- description "Terrain-corrected gamma naught values of signal transmitted with vertical polarization and received with horizontal polarization with radiometric terrain correction applied."
- file:size 1840024425
- file:checksum "dd1040a5ba0bc5403371612d33d75372"
raster:bands [] 1 items
0
- nodata -32768
- data_type "float32"
- spatial_resolution 10.0
roles [] 1 items
- 0 "data"
vv
- href "https://sentinel1euwestrtc.blob.core.windows.net/sentinel1-grd-rtc/GRD/2022/3/25/IW/DV/S1A_IW_GRDH_1SDV_20220325T000313_20220325T000338_042470_051096_641B/measurement/iw-vv.rtc.tiff"
- type "image/tiff; application=geotiff; profile=cloud-optimized"
- title "VV: vertical transmit, vertical receive"
- description "Terrain-corrected gamma naught values of signal transmitted with vertical polarization and received with vertical polarization with radiometric terrain correction applied."
- file:size 1847064110
- file:checksum "90f6b3a91a5b5573933ad33ea10f1c46"
raster:bands [] 1 items
0
- nodata -32768
- data_type "float32"
- spatial_resolution 10.0
roles [] 1 items
- 0 "data"
tilejson
- href "https://planetarycomputer.microsoft.com/api/data/v1/item/tilejson.json?collection=sentinel-1-rtc&item=S1A_IW_GRDH_1SDV_20220325T000313_20220325T000338_042470_051096_rtc&assets=vv&assets=vh&tile_format=png&expression=0.03+%2B+log+%2810e-4+-+log+%280.05+%2F+%280.02+%2B+2+%2A+vv%29%29%29%3B0.05+%2B+exp+%280.25+%2A+%28log+%280.01+%2B+2+%2A+vv%29+%2B+log+%280.02+%2B+5+%2A+vh%29%29%29%3B1+-+log+%280.05+%2F+%280.045+-+0.9+%2A+vv%29%29&asset_as_band=True&rescale=0%2C.8000&rescale=0%2C1.000&rescale=0%2C1.000&format=png"
- type "application/json"
- title "TileJSON with default rendering"
roles [] 1 items
- 0 "tiles"
rendered_preview
- href "https://planetarycomputer.microsoft.com/api/data/v1/item/preview.png?collection=sentinel-1-rtc&item=S1A_IW_GRDH_1SDV_20220325T000313_20220325T000338_042470_051096_rtc&assets=vv&assets=vh&tile_format=png&expression=0.03+%2B+log+%2810e-4+-+log+%280.05+%2F+%280.02+%2B+2+%2A+vv%29%29%29%3B0.05+%2B+exp+%280.25+%2A+%28log+%280.01+%2B+2+%2A+vv%29+%2B+log+%280.02+%2B+5+%2A+vh%29%29%29%3B1+-+log+%280.05+%2F+%280.045+-+0.9+%2A+vv%29%29&asset_as_band=True&rescale=0%2C.8000&rescale=0%2C1.000&rescale=0%2C1.000&format=png"
- type "image/png"
- title "Rendered preview"
- rel "preview"
roles [] 1 items
- 0 "overview"
bbox [] 4 items
- 0 87.30507937
- 1 26.92262854
- 2 90.04944227
- 3 28.84020658
stac_extensions [] 6 items
- 0 "https://stac-extensions.github.io/sar/v1.0.0/schema.json"
- 1 "https://stac-extensions.github.io/sat/v1.0.0/schema.json"
- 2 "https://stac-extensions.github.io/eo/v1.0.0/schema.json"
- 3 "https://stac-extensions.github.io/projection/v1.0.0/schema.json"
- 4 "https://stac-extensions.github.io/file/v2.0.0/schema.json"
- 5 "https://stac-extensions.github.io/raster/v1.1.0/schema.json"
- collection "sentinel-1-rtc"
31
- type "Feature"
- stac_version "1.0.0"
- id "S1A_IW_GRDH_1SDV_20220322T121354_20220322T121419_042434_050F59_rtc"
properties
- datetime "2022-03-22T12:14:07.362180Z"
- platform "SENTINEL-1A"
s1:shape [] 2 items
- 0 28172
- 1 21598
proj:bbox [] 4 items
- 0 421480.0
- 1 2916200.0
- 2 703200.0
- 3 3132180.0
- proj:epsg 32645
proj:shape [] 2 items
- 0 21598
- 1 28172
- end_datetime "2022-03-22 12:14:19.861261+00:00"
- constellation "Sentinel-1"
- s1:resolution "high"
proj:transform [] 9 items
- 0 10.0
- 1 0.0
- 2 421480.0
- 3 0.0
- 4 -10.0
- 5 3132180.0
- 6 0.0
- 7 0.0
- 8 1.0
- s1:datatake_id "331609"
- start_datetime "2022-03-22 12:13:54.863098+00:00"
- s1:orbit_source "PREORB"
- s1:slice_number "6"
- s1:total_slices "20"
- sar:looks_range 5
- sat:orbit_state "ascending"
- sar:product_type "GRD"
- sar:looks_azimuth 1
sar:polarizations [] 2 items
- 0 "VV"
- 1 "VH"
- sar:frequency_band "C"
- sat:absolute_orbit 42434
- sat:relative_orbit 12
- s1:processing_level "1"
- sar:instrument_mode "IW"
- sar:center_frequency 5.405
- sar:resolution_range 20
- s1:product_timeliness "Fast-24h"
- sar:resolution_azimuth 22
- sar:pixel_spacing_range 10
- sar:observation_direction "right"
- sar:pixel_spacing_azimuth 10
- sar:looks_equivalent_number 4.4
- s1:instrument_configuration_ID "7"
- sat:platform_international_designator "2014-016A"
geometry
- type "Polygon"
coordinates [] 1 items
0 [] 15 items
0 [] 2 items
- 0 86.2025445
- 1 27.846646
1 [] 2 items
- 0 86.2083952
- 1 27.7820911
2 [] 2 items
- 0 86.2335694
- 1 27.7816914
3 [] 2 items
- 0 86.2147723
- 1 27.7562197
4 [] 2 items
- 0 86.2692514
- 1 27.6972093
5 [] 2 items
- 0 86.2760599
- 1 27.4637055
6 [] 2 items
- 0 86.3256755
- 1 27.3762956
7 [] 2 items
- 0 86.3172594
- 1 27.231358
8 [] 2 items
- 0 86.3540244
- 1 27.1607529
9 [] 2 items
- 0 86.4975744
- 1 26.3663191
10 [] 2 items
- 0 88.9833587
- 1 26.7767352
11 [] 2 items
- 0 88.9215238
- 1 27.3273326
12 [] 2 items
- 0 88.7366181
- 1 28.2892666
13 [] 2 items
- 0 86.2102638
- 1 27.8815345
14 [] 2 items
- 0 86.2025445
- 1 27.846646
links [] 7 items
0
- rel "collection"
- href "https://planetarycomputer.microsoft.com/api/stac/v1/collections/sentinel-1-rtc"
- type "application/json"
1
- rel "parent"
- href "https://planetarycomputer.microsoft.com/api/stac/v1/collections/sentinel-1-rtc"
- type "application/json"
2
- rel "root"
- href "https://planetarycomputer.microsoft.com/api/stac/v1"
- type "application/json"
- title "Microsoft Planetary Computer STAC API"
3
- rel "self"
- href "https://planetarycomputer.microsoft.com/api/stac/v1/collections/sentinel-1-rtc/items/S1A_IW_GRDH_1SDV_20220322T121354_20220322T121419_042434_050F59_rtc"
- type "application/geo+json"
4
- rel "license"
- href "https://sentinel.esa.int/documents/247904/690755/Sentinel_Data_Legal_Notice"
5
- rel "derived_from"
- href "https://planetarycomputer.microsoft.com/api/stac/v1/collections/sentinel-1-grd/items/S1A_IW_GRDH_1SDV_20220322T121354_20220322T121419_042434_050F59"
- type "application/json"
- title "Sentinel 1 GRD Item"
6
- rel "preview"
- href "https://planetarycomputer.microsoft.com/api/data/v1/item/map?collection=sentinel-1-rtc&item=S1A_IW_GRDH_1SDV_20220322T121354_20220322T121419_042434_050F59_rtc"
- type "text/html"
- title "Map of item"
assets
vh
- href "https://sentinel1euwestrtc.blob.core.windows.net/sentinel1-grd-rtc/GRD/2022/3/22/IW/DV/S1A_IW_GRDH_1SDV_20220322T121354_20220322T121419_042434_050F59_968C/measurement/iw-vh.rtc.tiff"
- type "image/tiff; application=geotiff; profile=cloud-optimized"
- title "VH: vertical transmit, horizontal receive"
- description "Terrain-corrected gamma naught values of signal transmitted with vertical polarization and received with horizontal polarization with radiometric terrain correction applied."
- file:size 1869306173
- file:checksum "d11fd850f9744ea7da8e4e7fcb6155b8"
raster:bands [] 1 items
0
- nodata -32768
- data_type "float32"
- spatial_resolution 10.0
roles [] 1 items
- 0 "data"
vv
- href "https://sentinel1euwestrtc.blob.core.windows.net/sentinel1-grd-rtc/GRD/2022/3/22/IW/DV/S1A_IW_GRDH_1SDV_20220322T121354_20220322T121419_042434_050F59_968C/measurement/iw-vv.rtc.tiff"
- type "image/tiff; application=geotiff; profile=cloud-optimized"
- title "VV: vertical transmit, vertical receive"
- description "Terrain-corrected gamma naught values of signal transmitted with vertical polarization and received with vertical polarization with radiometric terrain correction applied."
- file:size 1877602462
- file:checksum "d684920e0ed910d98662306fda9af136"
raster:bands [] 1 items
0
- nodata -32768
- data_type "float32"
- spatial_resolution 10.0
roles [] 1 items
- 0 "data"
tilejson
- href "https://planetarycomputer.microsoft.com/api/data/v1/item/tilejson.json?collection=sentinel-1-rtc&item=S1A_IW_GRDH_1SDV_20220322T121354_20220322T121419_042434_050F59_rtc&assets=vv&assets=vh&tile_format=png&expression=0.03+%2B+log+%2810e-4+-+log+%280.05+%2F+%280.02+%2B+2+%2A+vv%29%29%29%3B0.05+%2B+exp+%280.25+%2A+%28log+%280.01+%2B+2+%2A+vv%29+%2B+log+%280.02+%2B+5+%2A+vh%29%29%29%3B1+-+log+%280.05+%2F+%280.045+-+0.9+%2A+vv%29%29&asset_as_band=True&rescale=0%2C.8000&rescale=0%2C1.000&rescale=0%2C1.000&format=png"
- type "application/json"
- title "TileJSON with default rendering"
roles [] 1 items
- 0 "tiles"
rendered_preview
- href "https://planetarycomputer.microsoft.com/api/data/v1/item/preview.png?collection=sentinel-1-rtc&item=S1A_IW_GRDH_1SDV_20220322T121354_20220322T121419_042434_050F59_rtc&assets=vv&assets=vh&tile_format=png&expression=0.03+%2B+log+%2810e-4+-+log+%280.05+%2F+%280.02+%2B+2+%2A+vv%29%29%29%3B0.05+%2B+exp+%280.25+%2A+%28log+%280.01+%2B+2+%2A+vv%29+%2B+log+%280.02+%2B+5+%2A+vh%29%29%29%3B1+-+log+%280.05+%2F+%280.045+-+0.9+%2A+vv%29%29&asset_as_band=True&rescale=0%2C.8000&rescale=0%2C1.000&rescale=0%2C1.000&format=png"
- type "image/png"
- title "Rendered preview"
- rel "preview"
roles [] 1 items
- 0 "overview"
bbox [] 4 items
- 0 86.20254447
- 1 26.36631911
- 2 88.98335874
- 3 28.28926658
stac_extensions [] 6 items
- 0 "https://stac-extensions.github.io/sar/v1.0.0/schema.json"
- 1 "https://stac-extensions.github.io/sat/v1.0.0/schema.json"
- 2 "https://stac-extensions.github.io/eo/v1.0.0/schema.json"
- 3 "https://stac-extensions.github.io/projection/v1.0.0/schema.json"
- 4 "https://stac-extensions.github.io/file/v2.0.0/schema.json"
- 5 "https://stac-extensions.github.io/raster/v1.1.0/schema.json"
- collection "sentinel-1-rtc"
32
- type "Feature"
- stac_version "1.0.0"
- id "S1A_IW_GRDH_1SDV_20220317T120547_20220317T120612_042361_050CE5_rtc"
properties
- datetime "2022-03-17T12:05:59.706124Z"
- platform "SENTINEL-1A"
s1:shape [] 2 items
- 0 28426
- 1 21971
proj:bbox [] 4 items
- 0 618200.0
- 1 2960410.0
- 2 902460.0
- 3 3180120.0
- proj:epsg 32645
proj:shape [] 2 items
- 0 21971
- 1 28426
- end_datetime "2022-03-17 12:06:12.205265+00:00"
- constellation "Sentinel-1"
- s1:resolution "high"
proj:transform [] 9 items
- 0 10.0
- 1 0.0
- 2 618200.0
- 3 0.0
- 4 -10.0
- 5 3180120.0
- 6 0.0
- 7 0.0
- 8 1.0
- s1:datatake_id "330981"
- start_datetime "2022-03-17 12:05:47.206984+00:00"
- s1:orbit_source "PREORB"
- s1:slice_number "6"
- s1:total_slices "21"
- sar:looks_range 5
- sat:orbit_state "ascending"
- sar:product_type "GRD"
- sar:looks_azimuth 1
sar:polarizations [] 2 items
- 0 "VV"
- 1 "VH"
- sar:frequency_band "C"
- sat:absolute_orbit 42361
- sat:relative_orbit 114
- s1:processing_level "1"
- sar:instrument_mode "IW"
- sar:center_frequency 5.405
- sar:resolution_range 20
- s1:product_timeliness "Fast-24h"
- sar:resolution_azimuth 22
- sar:pixel_spacing_range 10
- sar:observation_direction "right"
- sar:pixel_spacing_azimuth 10
- sar:looks_equivalent_number 4.4
- s1:instrument_configuration_ID "7"
- sat:platform_international_designator "2014-016A"
geometry
- type "Polygon"
coordinates [] 1 items
0 [] 14 items
0 [] 2 items
- 0 89.9822371
- 1 27.012322
1 [] 2 items
- 0 90.9938323
- 1 27.172651
2 [] 2 items
- 0 90.7249474
- 1 28.6816426
3 [] 2 items
- 0 88.2177827
- 1 28.279581
4 [] 2 items
- 0 88.3552737
- 1 27.7231948
5 [] 2 items
- 0 88.3299565
- 1 27.5841637
6 [] 2 items
- 0 88.3764917
- 1 27.5221503
7 [] 2 items
- 0 88.3581952
- 1 27.408957
8 [] 2 items
- 0 88.4004728
- 1 27.3366875
9 [] 2 items
- 0 88.3792292
- 1 27.3025975
10 [] 2 items
- 0 88.4161084
- 1 27.2067268
11 [] 2 items
- 0 88.4043417
- 1 27.0893161
12 [] 2 items
- 0 88.4754288
- 1 26.7593311
13 [] 2 items
- 0 89.9822371
- 1 27.012322
links [] 7 items
0
- rel "collection"
- href "https://planetarycomputer.microsoft.com/api/stac/v1/collections/sentinel-1-rtc"
- type "application/json"
1
- rel "parent"
- href "https://planetarycomputer.microsoft.com/api/stac/v1/collections/sentinel-1-rtc"
- type "application/json"
2
- rel "root"
- href "https://planetarycomputer.microsoft.com/api/stac/v1"
- type "application/json"
- title "Microsoft Planetary Computer STAC API"
3
- rel "self"
- href "https://planetarycomputer.microsoft.com/api/stac/v1/collections/sentinel-1-rtc/items/S1A_IW_GRDH_1SDV_20220317T120547_20220317T120612_042361_050CE5_rtc"
- type "application/geo+json"
4
- rel "license"
- href "https://sentinel.esa.int/documents/247904/690755/Sentinel_Data_Legal_Notice"
5
- rel "derived_from"
- href "https://planetarycomputer.microsoft.com/api/stac/v1/collections/sentinel-1-grd/items/S1A_IW_GRDH_1SDV_20220317T120547_20220317T120612_042361_050CE5"
- type "application/json"
- title "Sentinel 1 GRD Item"
6
- rel "preview"
- href "https://planetarycomputer.microsoft.com/api/data/v1/item/map?collection=sentinel-1-rtc&item=S1A_IW_GRDH_1SDV_20220317T120547_20220317T120612_042361_050CE5_rtc"
- type "text/html"
- title "Map of item"
assets
vh
- href "https://sentinel1euwestrtc.blob.core.windows.net/sentinel1-grd-rtc/GRD/2022/3/17/IW/DV/S1A_IW_GRDH_1SDV_20220317T120547_20220317T120612_042361_050CE5_229B/measurement/iw-vh.rtc.tiff"
- type "image/tiff; application=geotiff; profile=cloud-optimized"
- title "VH: vertical transmit, horizontal receive"
- description "Terrain-corrected gamma naught values of signal transmitted with vertical polarization and received with horizontal polarization with radiometric terrain correction applied."
- file:size 1851157188
- file:checksum "cc0f1cd0417f3ab7a9ca4497a27bffa1"
raster:bands [] 1 items
0
- nodata -32768
- data_type "float32"
- spatial_resolution 10.0
roles [] 1 items
- 0 "data"
vv
- href "https://sentinel1euwestrtc.blob.core.windows.net/sentinel1-grd-rtc/GRD/2022/3/17/IW/DV/S1A_IW_GRDH_1SDV_20220317T120547_20220317T120612_042361_050CE5_229B/measurement/iw-vv.rtc.tiff"
- type "image/tiff; application=geotiff; profile=cloud-optimized"
- title "VV: vertical transmit, vertical receive"
- description "Terrain-corrected gamma naught values of signal transmitted with vertical polarization and received with vertical polarization with radiometric terrain correction applied."
- file:size 1859445680
- file:checksum "5832380899429b9885dda85acae1b97b"
raster:bands [] 1 items
0
- nodata -32768
- data_type "float32"
- spatial_resolution 10.0
roles [] 1 items
- 0 "data"
tilejson
- href "https://planetarycomputer.microsoft.com/api/data/v1/item/tilejson.json?collection=sentinel-1-rtc&item=S1A_IW_GRDH_1SDV_20220317T120547_20220317T120612_042361_050CE5_rtc&assets=vv&assets=vh&tile_format=png&expression=0.03+%2B+log+%2810e-4+-+log+%280.05+%2F+%280.02+%2B+2+%2A+vv%29%29%29%3B0.05+%2B+exp+%280.25+%2A+%28log+%280.01+%2B+2+%2A+vv%29+%2B+log+%280.02+%2B+5+%2A+vh%29%29%29%3B1+-+log+%280.05+%2F+%280.045+-+0.9+%2A+vv%29%29&asset_as_band=True&rescale=0%2C.8000&rescale=0%2C1.000&rescale=0%2C1.000&format=png"
- type "application/json"
- title "TileJSON with default rendering"
roles [] 1 items
- 0 "tiles"
rendered_preview
- href "https://planetarycomputer.microsoft.com/api/data/v1/item/preview.png?collection=sentinel-1-rtc&item=S1A_IW_GRDH_1SDV_20220317T120547_20220317T120612_042361_050CE5_rtc&assets=vv&assets=vh&tile_format=png&expression=0.03+%2B+log+%2810e-4+-+log+%280.05+%2F+%280.02+%2B+2+%2A+vv%29%29%29%3B0.05+%2B+exp+%280.25+%2A+%28log+%280.01+%2B+2+%2A+vv%29+%2B+log+%280.02+%2B+5+%2A+vh%29%29%29%3B1+-+log+%280.05+%2F+%280.045+-+0.9+%2A+vv%29%29&asset_as_band=True&rescale=0%2C.8000&rescale=0%2C1.000&rescale=0%2C1.000&format=png"
- type "image/png"
- title "Rendered preview"
- rel "preview"
roles [] 1 items
- 0 "overview"
bbox [] 4 items
- 0 88.21778268
- 1 26.75933115
- 2 90.99383227
- 3 28.68164262
stac_extensions [] 6 items
- 0 "https://stac-extensions.github.io/sar/v1.0.0/schema.json"
- 1 "https://stac-extensions.github.io/sat/v1.0.0/schema.json"
- 2 "https://stac-extensions.github.io/eo/v1.0.0/schema.json"
- 3 "https://stac-extensions.github.io/projection/v1.0.0/schema.json"
- 4 "https://stac-extensions.github.io/file/v2.0.0/schema.json"
- 5 "https://stac-extensions.github.io/raster/v1.1.0/schema.json"
- collection "sentinel-1-rtc"
33
- type "Feature"
- stac_version "1.0.0"
- id "S1A_IW_GRDH_1SDV_20220313T000313_20220313T000338_042295_050AA2_rtc"
properties
- datetime "2022-03-13T00:03:25.744897Z"
- platform "SENTINEL-1A"
s1:shape [] 2 items
- 0 27528
- 1 21083
proj:bbox [] 4 items
- 0 524520.0
- 1 2980850.0
- 2 799800.0
- 3 3191680.0
- proj:epsg 32645
proj:shape [] 2 items
- 0 21083
- 1 27528
- end_datetime "2022-03-13 00:03:38.244245+00:00"
- constellation "Sentinel-1"
- s1:resolution "high"
proj:transform [] 9 items
- 0 10.0
- 1 0.0
- 2 524520.0
- 3 0.0
- 4 -10.0
- 5 3191680.0
- 6 0.0
- 7 0.0
- 8 1.0
- s1:datatake_id "330402"
- start_datetime "2022-03-13 00:03:13.245549+00:00"
- s1:orbit_source "RESORB"
- s1:slice_number "12"
- s1:total_slices "17"
- sar:looks_range 5
- sat:orbit_state "descending"
- sar:product_type "GRD"
- sar:looks_azimuth 1
sar:polarizations [] 2 items
- 0 "VV"
- 1 "VH"
- sar:frequency_band "C"
- sat:absolute_orbit 42295
- sat:relative_orbit 48
- s1:processing_level "1"
- sar:instrument_mode "IW"
- sar:center_frequency 5.405
- sar:resolution_range 20
- s1:product_timeliness "Fast-24h"
- sar:resolution_azimuth 22
- sar:pixel_spacing_range 10
- sar:observation_direction "right"
- sar:pixel_spacing_azimuth 10
- sar:looks_equivalent_number 4.4
- s1:instrument_configuration_ID "7"
- sat:platform_international_designator "2014-016A"
geometry
- type "Polygon"
coordinates [] 1 items
0 [] 19 items
0 [] 2 items
- 0 89.8044147
- 1 27.0228351
1 [] 2 items
- 0 89.8292866
- 1 27.2744552
2 [] 2 items
- 0 89.9034426
- 1 27.4311703
3 [] 2 items
- 0 89.9220229
- 1 27.6329455
4 [] 2 items
- 0 89.9528305
- 1 27.67875
5 [] 2 items
- 0 89.9295723
- 1 27.8243904
6 [] 2 items
- 0 89.9445509
- 1 27.9504514
7 [] 2 items
- 0 89.9878149
- 1 28.0016563
8 [] 2 items
- 0 89.971285
- 1 28.0842811
9 [] 2 items
- 0 89.9979847
- 1 28.1482848
10 [] 2 items
- 0 89.9733381
- 1 28.1917589
11 [] 2 items
- 0 90.0264313
- 1 28.2908965
12 [] 2 items
- 0 90.0498528
- 1 28.4417715
13 [] 2 items
- 0 87.5585335
- 1 28.8402951
14 [] 2 items
- 0 87.4260993
- 1 28.1942571
15 [] 2 items
- 0 87.3056889
- 1 27.3301023
16 [] 2 items
- 0 89.7846737
- 1 26.9228089
17 [] 2 items
- 0 89.7774365
- 1 26.9949951
18 [] 2 items
- 0 89.8044147
- 1 27.0228351
links [] 7 items
0
- rel "collection"
- href "https://planetarycomputer.microsoft.com/api/stac/v1/collections/sentinel-1-rtc"
- type "application/json"
1
- rel "parent"
- href "https://planetarycomputer.microsoft.com/api/stac/v1/collections/sentinel-1-rtc"
- type "application/json"
2
- rel "root"
- href "https://planetarycomputer.microsoft.com/api/stac/v1"
- type "application/json"
- title "Microsoft Planetary Computer STAC API"
3
- rel "self"
- href "https://planetarycomputer.microsoft.com/api/stac/v1/collections/sentinel-1-rtc/items/S1A_IW_GRDH_1SDV_20220313T000313_20220313T000338_042295_050AA2_rtc"
- type "application/geo+json"
4
- rel "license"
- href "https://sentinel.esa.int/documents/247904/690755/Sentinel_Data_Legal_Notice"
5
- rel "derived_from"
- href "https://planetarycomputer.microsoft.com/api/stac/v1/collections/sentinel-1-grd/items/S1A_IW_GRDH_1SDV_20220313T000313_20220313T000338_042295_050AA2"
- type "application/json"
- title "Sentinel 1 GRD Item"
6
- rel "preview"
- href "https://planetarycomputer.microsoft.com/api/data/v1/item/map?collection=sentinel-1-rtc&item=S1A_IW_GRDH_1SDV_20220313T000313_20220313T000338_042295_050AA2_rtc"
- type "text/html"
- title "Map of item"
assets
vh
- href "https://sentinel1euwestrtc.blob.core.windows.net/sentinel1-grd-rtc/GRD/2022/3/13/IW/DV/S1A_IW_GRDH_1SDV_20220313T000313_20220313T000338_042295_050AA2_EAD0/measurement/iw-vh.rtc.tiff"
- type "image/tiff; application=geotiff; profile=cloud-optimized"
- title "VH: vertical transmit, horizontal receive"
- description "Terrain-corrected gamma naught values of signal transmitted with vertical polarization and received with horizontal polarization with radiometric terrain correction applied."
- file:size 1841450421
- file:checksum "57e98d4eac4ed8c106665a319c270289"
raster:bands [] 1 items
0
- nodata -32768
- data_type "float32"
- spatial_resolution 10.0
roles [] 1 items
- 0 "data"
vv
- href "https://sentinel1euwestrtc.blob.core.windows.net/sentinel1-grd-rtc/GRD/2022/3/13/IW/DV/S1A_IW_GRDH_1SDV_20220313T000313_20220313T000338_042295_050AA2_EAD0/measurement/iw-vv.rtc.tiff"
- type "image/tiff; application=geotiff; profile=cloud-optimized"
- title "VV: vertical transmit, vertical receive"
- description "Terrain-corrected gamma naught values of signal transmitted with vertical polarization and received with vertical polarization with radiometric terrain correction applied."
- file:size 1848032165
- file:checksum "06a185e3304da3b6be7d3a8a884e436b"
raster:bands [] 1 items
0
- nodata -32768
- data_type "float32"
- spatial_resolution 10.0
roles [] 1 items
- 0 "data"
tilejson
- href "https://planetarycomputer.microsoft.com/api/data/v1/item/tilejson.json?collection=sentinel-1-rtc&item=S1A_IW_GRDH_1SDV_20220313T000313_20220313T000338_042295_050AA2_rtc&assets=vv&assets=vh&tile_format=png&expression=0.03+%2B+log+%2810e-4+-+log+%280.05+%2F+%280.02+%2B+2+%2A+vv%29%29%29%3B0.05+%2B+exp+%280.25+%2A+%28log+%280.01+%2B+2+%2A+vv%29+%2B+log+%280.02+%2B+5+%2A+vh%29%29%29%3B1+-+log+%280.05+%2F+%280.045+-+0.9+%2A+vv%29%29&asset_as_band=True&rescale=0%2C.8000&rescale=0%2C1.000&rescale=0%2C1.000&format=png"
- type "application/json"
- title "TileJSON with default rendering"
roles [] 1 items
- 0 "tiles"
rendered_preview
- href "https://planetarycomputer.microsoft.com/api/data/v1/item/preview.png?collection=sentinel-1-rtc&item=S1A_IW_GRDH_1SDV_20220313T000313_20220313T000338_042295_050AA2_rtc&assets=vv&assets=vh&tile_format=png&expression=0.03+%2B+log+%2810e-4+-+log+%280.05+%2F+%280.02+%2B+2+%2A+vv%29%29%29%3B0.05+%2B+exp+%280.25+%2A+%28log+%280.01+%2B+2+%2A+vv%29+%2B+log+%280.02+%2B+5+%2A+vh%29%29%29%3B1+-+log+%280.05+%2F+%280.045+-+0.9+%2A+vv%29%29&asset_as_band=True&rescale=0%2C.8000&rescale=0%2C1.000&rescale=0%2C1.000&format=png"
- type "image/png"
- title "Rendered preview"
- rel "preview"
roles [] 1 items
- 0 "overview"
bbox [] 4 items
- 0 87.30568886
- 1 26.9228089
- 2 90.04985278
- 3 28.84029514
stac_extensions [] 6 items
- 0 "https://stac-extensions.github.io/sar/v1.0.0/schema.json"
- 1 "https://stac-extensions.github.io/sat/v1.0.0/schema.json"
- 2 "https://stac-extensions.github.io/eo/v1.0.0/schema.json"
- 3 "https://stac-extensions.github.io/projection/v1.0.0/schema.json"
- 4 "https://stac-extensions.github.io/file/v2.0.0/schema.json"
- 5 "https://stac-extensions.github.io/raster/v1.1.0/schema.json"
- collection "sentinel-1-rtc"
34
- type "Feature"
- stac_version "1.0.0"
- id "S1A_IW_GRDH_1SDV_20220310T121354_20220310T121419_042259_050962_rtc"
properties
- datetime "2022-03-10T12:14:06.994606Z"
- platform "SENTINEL-1A"
s1:shape [] 2 items
- 0 28172
- 1 21599
proj:bbox [] 4 items
- 0 421570.0
- 1 2916200.0
- 2 703290.0
- 3 3132190.0
- proj:epsg 32645
proj:shape [] 2 items
- 0 21599
- 1 28172
- end_datetime "2022-03-10 12:14:19.493699+00:00"
- constellation "Sentinel-1"
- s1:resolution "high"
proj:transform [] 9 items
- 0 10.0
- 1 0.0
- 2 421570.0
- 3 0.0
- 4 -10.0
- 5 3132190.0
- 6 0.0
- 7 0.0
- 8 1.0
- s1:datatake_id "330082"
- start_datetime "2022-03-10 12:13:54.495512+00:00"
- s1:orbit_source "PREORB"
- s1:slice_number "6"
- s1:total_slices "20"
- sar:looks_range 5
- sat:orbit_state "ascending"
- sar:product_type "GRD"
- sar:looks_azimuth 1
sar:polarizations [] 2 items
- 0 "VV"
- 1 "VH"
- sar:frequency_band "C"
- sat:absolute_orbit 42259
- sat:relative_orbit 12
- s1:processing_level "1"
- sar:instrument_mode "IW"
- sar:center_frequency 5.405
- sar:resolution_range 20
- s1:product_timeliness "Fast-24h"
- sar:resolution_azimuth 22
- sar:pixel_spacing_range 10
- sar:observation_direction "right"
- sar:pixel_spacing_azimuth 10
- sar:looks_equivalent_number 4.4
- s1:instrument_configuration_ID "7"
- sat:platform_international_designator "2014-016A"
geometry
- type "Polygon"
coordinates [] 1 items
0 [] 15 items
0 [] 2 items
- 0 86.2034604
- 1 27.8463805
1 [] 2 items
- 0 86.2094089
- 1 27.7822775
2 [] 2 items
- 0 86.234179
- 1 27.7816045
3 [] 2 items
- 0 86.2157889
- 1 27.7559546
4 [] 2 items
- 0 86.2701647
- 1 27.6971239
5 [] 2 items
- 0 86.2768671
- 1 27.4640708
6 [] 2 items
- 0 86.3263822
- 1 27.3764796
7 [] 2 items
- 0 86.3180678
- 1 27.2312717
8 [] 2 items
- 0 86.3548303
- 1 27.1610274
9 [] 2 items
- 0 86.4984765
- 1 26.3663223
10 [] 2 items
- 0 88.9841646
- 1 26.7768141
11 [] 2 items
- 0 88.9220351
- 1 27.3276866
12 [] 2 items
- 0 88.7377423
- 1 28.2894328
13 [] 2 items
- 0 86.2107718
- 1 27.8815375
14 [] 2 items
- 0 86.2034604
- 1 27.8463805
links [] 7 items
0
- rel "collection"
- href "https://planetarycomputer.microsoft.com/api/stac/v1/collections/sentinel-1-rtc"
- type "application/json"
1
- rel "parent"
- href "https://planetarycomputer.microsoft.com/api/stac/v1/collections/sentinel-1-rtc"
- type "application/json"
2
- rel "root"
- href "https://planetarycomputer.microsoft.com/api/stac/v1"
- type "application/json"
- title "Microsoft Planetary Computer STAC API"
3
- rel "self"
- href "https://planetarycomputer.microsoft.com/api/stac/v1/collections/sentinel-1-rtc/items/S1A_IW_GRDH_1SDV_20220310T121354_20220310T121419_042259_050962_rtc"
- type "application/geo+json"
4
- rel "license"
- href "https://sentinel.esa.int/documents/247904/690755/Sentinel_Data_Legal_Notice"
5
- rel "derived_from"
- href "https://planetarycomputer.microsoft.com/api/stac/v1/collections/sentinel-1-grd/items/S1A_IW_GRDH_1SDV_20220310T121354_20220310T121419_042259_050962"
- type "application/json"
- title "Sentinel 1 GRD Item"
6
- rel "preview"
- href "https://planetarycomputer.microsoft.com/api/data/v1/item/map?collection=sentinel-1-rtc&item=S1A_IW_GRDH_1SDV_20220310T121354_20220310T121419_042259_050962_rtc"
- type "text/html"
- title "Map of item"
assets
vh
- href "https://sentinel1euwestrtc.blob.core.windows.net/sentinel1-grd-rtc/GRD/2022/3/10/IW/DV/S1A_IW_GRDH_1SDV_20220310T121354_20220310T121419_042259_050962_07C2/measurement/iw-vh.rtc.tiff"
- type "image/tiff; application=geotiff; profile=cloud-optimized"
- title "VH: vertical transmit, horizontal receive"
- description "Terrain-corrected gamma naught values of signal transmitted with vertical polarization and received with horizontal polarization with radiometric terrain correction applied."
- file:size 1869355372
- file:checksum "8fac9172c79d0fc88c81e46e66a40926"
raster:bands [] 1 items
0
- nodata -32768
- data_type "float32"
- spatial_resolution 10.0
roles [] 1 items
- 0 "data"
vv
- href "https://sentinel1euwestrtc.blob.core.windows.net/sentinel1-grd-rtc/GRD/2022/3/10/IW/DV/S1A_IW_GRDH_1SDV_20220310T121354_20220310T121419_042259_050962_07C2/measurement/iw-vv.rtc.tiff"
- type "image/tiff; application=geotiff; profile=cloud-optimized"
- title "VV: vertical transmit, vertical receive"
- description "Terrain-corrected gamma naught values of signal transmitted with vertical polarization and received with vertical polarization with radiometric terrain correction applied."
- file:size 1877981798
- file:checksum "41a44200c3d3e42675337da80f203180"
raster:bands [] 1 items
0
- nodata -32768
- data_type "float32"
- spatial_resolution 10.0
roles [] 1 items
- 0 "data"
tilejson
- href "https://planetarycomputer.microsoft.com/api/data/v1/item/tilejson.json?collection=sentinel-1-rtc&item=S1A_IW_GRDH_1SDV_20220310T121354_20220310T121419_042259_050962_rtc&assets=vv&assets=vh&tile_format=png&expression=0.03+%2B+log+%2810e-4+-+log+%280.05+%2F+%280.02+%2B+2+%2A+vv%29%29%29%3B0.05+%2B+exp+%280.25+%2A+%28log+%280.01+%2B+2+%2A+vv%29+%2B+log+%280.02+%2B+5+%2A+vh%29%29%29%3B1+-+log+%280.05+%2F+%280.045+-+0.9+%2A+vv%29%29&asset_as_band=True&rescale=0%2C.8000&rescale=0%2C1.000&rescale=0%2C1.000&format=png"
- type "application/json"
- title "TileJSON with default rendering"
roles [] 1 items
- 0 "tiles"
rendered_preview
- href "https://planetarycomputer.microsoft.com/api/data/v1/item/preview.png?collection=sentinel-1-rtc&item=S1A_IW_GRDH_1SDV_20220310T121354_20220310T121419_042259_050962_rtc&assets=vv&assets=vh&tile_format=png&expression=0.03+%2B+log+%2810e-4+-+log+%280.05+%2F+%280.02+%2B+2+%2A+vv%29%29%29%3B0.05+%2B+exp+%280.25+%2A+%28log+%280.01+%2B+2+%2A+vv%29+%2B+log+%280.02+%2B+5+%2A+vh%29%29%29%3B1+-+log+%280.05+%2F+%280.045+-+0.9+%2A+vv%29%29&asset_as_band=True&rescale=0%2C.8000&rescale=0%2C1.000&rescale=0%2C1.000&format=png"
- type "image/png"
- title "Rendered preview"
- rel "preview"
roles [] 1 items
- 0 "overview"
bbox [] 4 items
- 0 86.20346043
- 1 26.36632228
- 2 88.98416457
- 3 28.28943277
stac_extensions [] 6 items
- 0 "https://stac-extensions.github.io/sar/v1.0.0/schema.json"
- 1 "https://stac-extensions.github.io/sat/v1.0.0/schema.json"
- 2 "https://stac-extensions.github.io/eo/v1.0.0/schema.json"
- 3 "https://stac-extensions.github.io/projection/v1.0.0/schema.json"
- 4 "https://stac-extensions.github.io/file/v2.0.0/schema.json"
- 5 "https://stac-extensions.github.io/raster/v1.1.0/schema.json"
- collection "sentinel-1-rtc"
35
- type "Feature"
- stac_version "1.0.0"
- id "S1A_IW_GRDH_1SDV_20220305T120547_20220305T120612_042186_0506F7_rtc"
properties
- datetime "2022-03-05T12:05:59.677073Z"
- platform "SENTINEL-1A"
s1:shape [] 2 items
- 0 28430
- 1 21971
proj:bbox [] 4 items
- 0 618130.0
- 1 2960420.0
- 2 902430.0
- 3 3180130.0
- proj:epsg 32645
proj:shape [] 2 items
- 0 21971
- 1 28430
- end_datetime "2022-03-05 12:06:12.176227+00:00"
- constellation "Sentinel-1"
- s1:resolution "high"
proj:transform [] 9 items
- 0 10.0
- 1 0.0
- 2 618130.0
- 3 0.0
- 4 -10.0
- 5 3180130.0
- 6 0.0
- 7 0.0
- 8 1.0
- s1:datatake_id "329463"
- start_datetime "2022-03-05 12:05:47.177919+00:00"
- s1:orbit_source "PREORB"
- s1:slice_number "6"
- s1:total_slices "21"
- sar:looks_range 5
- sat:orbit_state "ascending"
- sar:product_type "GRD"
- sar:looks_azimuth 1
sar:polarizations [] 2 items
- 0 "VV"
- 1 "VH"
- sar:frequency_band "C"
- sat:absolute_orbit 42186
- sat:relative_orbit 114
- s1:processing_level "1"
- sar:instrument_mode "IW"
- sar:center_frequency 5.405
- sar:resolution_range 20
- s1:product_timeliness "Fast-24h"
- sar:resolution_azimuth 22
- sar:pixel_spacing_range 10
- sar:observation_direction "right"
- sar:pixel_spacing_azimuth 10
- sar:looks_equivalent_number 4.4
- s1:instrument_configuration_ID "7"
- sat:platform_international_designator "2014-016A"
geometry
- type "Polygon"
coordinates [] 1 items
0 [] 14 items
0 [] 2 items
- 0 89.9818368
- 1 27.0124207
1 [] 2 items
- 0 90.9932313
- 1 27.1727583
2 [] 2 items
- 0 90.7243346
- 1 28.6816595
3 [] 2 items
- 0 88.217069
- 1 28.2795874
4 [] 2 items
- 0 88.3540566
- 1 27.7232067
5 [] 2 items
- 0 88.3292486
- 1 27.5842608
6 [] 2 items
- 0 88.3757797
- 1 27.5218865
7 [] 2 items
- 0 88.3572883
- 1 27.4092366
8 [] 2 items
- 0 88.3997608
- 1 27.3363335
9 [] 2 items
- 0 88.3788273
- 1 27.302782
10 [] 2 items
- 0 88.4158033
- 1 27.2065494
11 [] 2 items
- 0 88.4036359
- 1 27.0893232
12 [] 2 items
- 0 88.4747262
- 1 26.7594287
13 [] 2 items
- 0 89.9818368
- 1 27.0124207
links [] 7 items
0
- rel "collection"
- href "https://planetarycomputer.microsoft.com/api/stac/v1/collections/sentinel-1-rtc"
- type "application/json"
1
- rel "parent"
- href "https://planetarycomputer.microsoft.com/api/stac/v1/collections/sentinel-1-rtc"
- type "application/json"
2
- rel "root"
- href "https://planetarycomputer.microsoft.com/api/stac/v1"
- type "application/json"
- title "Microsoft Planetary Computer STAC API"
3
- rel "self"
- href "https://planetarycomputer.microsoft.com/api/stac/v1/collections/sentinel-1-rtc/items/S1A_IW_GRDH_1SDV_20220305T120547_20220305T120612_042186_0506F7_rtc"
- type "application/geo+json"
4
- rel "license"
- href "https://sentinel.esa.int/documents/247904/690755/Sentinel_Data_Legal_Notice"
5
- rel "derived_from"
- href "https://planetarycomputer.microsoft.com/api/stac/v1/collections/sentinel-1-grd/items/S1A_IW_GRDH_1SDV_20220305T120547_20220305T120612_042186_0506F7"
- type "application/json"
- title "Sentinel 1 GRD Item"
6
- rel "preview"
- href "https://planetarycomputer.microsoft.com/api/data/v1/item/map?collection=sentinel-1-rtc&item=S1A_IW_GRDH_1SDV_20220305T120547_20220305T120612_042186_0506F7_rtc"
- type "text/html"
- title "Map of item"
assets
vh
- href "https://sentinel1euwestrtc.blob.core.windows.net/sentinel1-grd-rtc/GRD/2022/3/5/IW/DV/S1A_IW_GRDH_1SDV_20220305T120547_20220305T120612_042186_0506F7_5F93/measurement/iw-vh.rtc.tiff"
- type "image/tiff; application=geotiff; profile=cloud-optimized"
- title "VH: vertical transmit, horizontal receive"
- description "Terrain-corrected gamma naught values of signal transmitted with vertical polarization and received with horizontal polarization with radiometric terrain correction applied."
- file:size 1852325928
- file:checksum "97ed6215600375a6131f7f7e42d4ae78"
raster:bands [] 1 items
0
- nodata -32768
- data_type "float32"
- spatial_resolution 10.0
roles [] 1 items
- 0 "data"
vv
- href "https://sentinel1euwestrtc.blob.core.windows.net/sentinel1-grd-rtc/GRD/2022/3/5/IW/DV/S1A_IW_GRDH_1SDV_20220305T120547_20220305T120612_042186_0506F7_5F93/measurement/iw-vv.rtc.tiff"
- type "image/tiff; application=geotiff; profile=cloud-optimized"
- title "VV: vertical transmit, vertical receive"
- description "Terrain-corrected gamma naught values of signal transmitted with vertical polarization and received with vertical polarization with radiometric terrain correction applied."
- file:size 1860383274
- file:checksum "973d5def0c33dfa4f7a6e076a4318295"
raster:bands [] 1 items
0
- nodata -32768
- data_type "float32"
- spatial_resolution 10.0
roles [] 1 items
- 0 "data"
tilejson
- href "https://planetarycomputer.microsoft.com/api/data/v1/item/tilejson.json?collection=sentinel-1-rtc&item=S1A_IW_GRDH_1SDV_20220305T120547_20220305T120612_042186_0506F7_rtc&assets=vv&assets=vh&tile_format=png&expression=0.03+%2B+log+%2810e-4+-+log+%280.05+%2F+%280.02+%2B+2+%2A+vv%29%29%29%3B0.05+%2B+exp+%280.25+%2A+%28log+%280.01+%2B+2+%2A+vv%29+%2B+log+%280.02+%2B+5+%2A+vh%29%29%29%3B1+-+log+%280.05+%2F+%280.045+-+0.9+%2A+vv%29%29&asset_as_band=True&rescale=0%2C.8000&rescale=0%2C1.000&rescale=0%2C1.000&format=png"
- type "application/json"
- title "TileJSON with default rendering"
roles [] 1 items
- 0 "tiles"
rendered_preview
- href "https://planetarycomputer.microsoft.com/api/data/v1/item/preview.png?collection=sentinel-1-rtc&item=S1A_IW_GRDH_1SDV_20220305T120547_20220305T120612_042186_0506F7_rtc&assets=vv&assets=vh&tile_format=png&expression=0.03+%2B+log+%2810e-4+-+log+%280.05+%2F+%280.02+%2B+2+%2A+vv%29%29%29%3B0.05+%2B+exp+%280.25+%2A+%28log+%280.01+%2B+2+%2A+vv%29+%2B+log+%280.02+%2B+5+%2A+vh%29%29%29%3B1+-+log+%280.05+%2F+%280.045+-+0.9+%2A+vv%29%29&asset_as_band=True&rescale=0%2C.8000&rescale=0%2C1.000&rescale=0%2C1.000&format=png"
- type "image/png"
- title "Rendered preview"
- rel "preview"
roles [] 1 items
- 0 "overview"
bbox [] 4 items
- 0 88.21706905
- 1 26.75942873
- 2 90.99323128
- 3 28.68165951
stac_extensions [] 6 items
- 0 "https://stac-extensions.github.io/sar/v1.0.0/schema.json"
- 1 "https://stac-extensions.github.io/sat/v1.0.0/schema.json"
- 2 "https://stac-extensions.github.io/eo/v1.0.0/schema.json"
- 3 "https://stac-extensions.github.io/projection/v1.0.0/schema.json"
- 4 "https://stac-extensions.github.io/file/v2.0.0/schema.json"
- 5 "https://stac-extensions.github.io/raster/v1.1.0/schema.json"
- collection "sentinel-1-rtc"
36
- type "Feature"
- stac_version "1.0.0"
- id "S1A_IW_GRDH_1SDV_20220301T000313_20220301T000338_042120_0504AF_rtc"
properties
- datetime "2022-03-01T00:03:25.589986Z"
- platform "SENTINEL-1A"
s1:shape [] 2 items
- 0 27531
- 1 21084
proj:bbox [] 4 items
- 0 524470.0
- 1 2980850.0
- 2 799780.0
- 3 3191690.0
- proj:epsg 32645
proj:shape [] 2 items
- 0 21084
- 1 27531
- end_datetime "2022-03-01 00:03:38.089393+00:00"
- constellation "Sentinel-1"
- s1:resolution "high"
proj:transform [] 9 items
- 0 10.0
- 1 0.0
- 2 524470.0
- 3 0.0
- 4 -10.0
- 5 3191690.0
- 6 0.0
- 7 0.0
- 8 1.0
- s1:datatake_id "328879"
- start_datetime "2022-03-01 00:03:13.090580+00:00"
- s1:orbit_source "RESORB"
- s1:slice_number "12"
- s1:total_slices "17"
- sar:looks_range 5
- sat:orbit_state "descending"
- sar:product_type "GRD"
- sar:looks_azimuth 1
sar:polarizations [] 2 items
- 0 "VV"
- 1 "VH"
- sar:frequency_band "C"
- sat:absolute_orbit 42120
- sat:relative_orbit 48
- s1:processing_level "1"
- sar:instrument_mode "IW"
- sar:center_frequency 5.405
- sar:resolution_range 20
- s1:product_timeliness "Fast-24h"
- sar:resolution_azimuth 22
- sar:pixel_spacing_range 10
- sar:observation_direction "right"
- sar:pixel_spacing_azimuth 10
- sar:looks_equivalent_number 4.4
- s1:instrument_configuration_ID "7"
- sat:platform_international_designator "2014-016A"
geometry
- type "Polygon"
coordinates [] 1 items
0 [] 19 items
0 [] 2 items
- 0 89.8042178
- 1 27.0230195
1 [] 2 items
- 0 89.8291926
- 1 27.2747278
2 [] 2 items
- 0 89.9030408
- 1 27.4312689
3 [] 2 items
- 0 89.9217072
- 1 27.6325011
4 [] 2 items
- 0 89.9525169
- 1 27.6783958
5 [] 2 items
- 0 89.9291497
- 1 27.8237679
6 [] 2 items
- 0 89.9442464
- 1 27.9504579
7 [] 2 items
- 0 89.9875127
- 1 28.0017531
8 [] 2 items
- 0 89.9711858
- 1 28.0843735
9 [] 2 items
- 0 89.9977787
- 1 28.1481991
10 [] 2 items
- 0 89.9731321
- 1 28.1916732
11 [] 2 items
- 0 90.0261258
- 1 28.2909033
12 [] 2 items
- 0 90.0496514
- 1 28.4418663
13 [] 2 items
- 0 87.5583285
- 1 28.840296
14 [] 2 items
- 0 87.4257929
- 1 28.1940775
15 [] 2 items
- 0 87.3052828
- 1 27.3294712
16 [] 2 items
- 0 89.7847743
- 1 26.9228069
17 [] 2 items
- 0 89.7770383
- 1 26.9951834
18 [] 2 items
- 0 89.8042178
- 1 27.0230195
links [] 7 items
0
- rel "collection"
- href "https://planetarycomputer.microsoft.com/api/stac/v1/collections/sentinel-1-rtc"
- type "application/json"
1
- rel "parent"
- href "https://planetarycomputer.microsoft.com/api/stac/v1/collections/sentinel-1-rtc"
- type "application/json"
2
- rel "root"
- href "https://planetarycomputer.microsoft.com/api/stac/v1"
- type "application/json"
- title "Microsoft Planetary Computer STAC API"
3
- rel "self"
- href "https://planetarycomputer.microsoft.com/api/stac/v1/collections/sentinel-1-rtc/items/S1A_IW_GRDH_1SDV_20220301T000313_20220301T000338_042120_0504AF_rtc"
- type "application/geo+json"
4
- rel "license"
- href "https://sentinel.esa.int/documents/247904/690755/Sentinel_Data_Legal_Notice"
5
- rel "derived_from"
- href "https://planetarycomputer.microsoft.com/api/stac/v1/collections/sentinel-1-grd/items/S1A_IW_GRDH_1SDV_20220301T000313_20220301T000338_042120_0504AF"
- type "application/json"
- title "Sentinel 1 GRD Item"
6
- rel "preview"
- href "https://planetarycomputer.microsoft.com/api/data/v1/item/map?collection=sentinel-1-rtc&item=S1A_IW_GRDH_1SDV_20220301T000313_20220301T000338_042120_0504AF_rtc"
- type "text/html"
- title "Map of item"
assets
vh
- href "https://sentinel1euwestrtc.blob.core.windows.net/sentinel1-grd-rtc/GRD/2022/3/1/IW/DV/S1A_IW_GRDH_1SDV_20220301T000313_20220301T000338_042120_0504AF_1199/measurement/iw-vh.rtc.tiff"
- type "image/tiff; application=geotiff; profile=cloud-optimized"
- title "VH: vertical transmit, horizontal receive"
- description "Terrain-corrected gamma naught values of signal transmitted with vertical polarization and received with horizontal polarization with radiometric terrain correction applied."
- file:size 1841704310
- file:checksum "e20e90e3201b177c90557c5018746f04"
raster:bands [] 1 items
0
- nodata -32768
- data_type "float32"
- spatial_resolution 10.0
roles [] 1 items
- 0 "data"
vv
- href "https://sentinel1euwestrtc.blob.core.windows.net/sentinel1-grd-rtc/GRD/2022/3/1/IW/DV/S1A_IW_GRDH_1SDV_20220301T000313_20220301T000338_042120_0504AF_1199/measurement/iw-vv.rtc.tiff"
- type "image/tiff; application=geotiff; profile=cloud-optimized"
- title "VV: vertical transmit, vertical receive"
- description "Terrain-corrected gamma naught values of signal transmitted with vertical polarization and received with vertical polarization with radiometric terrain correction applied."
- file:size 1848145675
- file:checksum "8c48373ade426c42d79ed36e703304eb"
raster:bands [] 1 items
0
- nodata -32768
- data_type "float32"
- spatial_resolution 10.0
roles [] 1 items
- 0 "data"
tilejson
- href "https://planetarycomputer.microsoft.com/api/data/v1/item/tilejson.json?collection=sentinel-1-rtc&item=S1A_IW_GRDH_1SDV_20220301T000313_20220301T000338_042120_0504AF_rtc&assets=vv&assets=vh&tile_format=png&expression=0.03+%2B+log+%2810e-4+-+log+%280.05+%2F+%280.02+%2B+2+%2A+vv%29%29%29%3B0.05+%2B+exp+%280.25+%2A+%28log+%280.01+%2B+2+%2A+vv%29+%2B+log+%280.02+%2B+5+%2A+vh%29%29%29%3B1+-+log+%280.05+%2F+%280.045+-+0.9+%2A+vv%29%29&asset_as_band=True&rescale=0%2C.8000&rescale=0%2C1.000&rescale=0%2C1.000&format=png"
- type "application/json"
- title "TileJSON with default rendering"
roles [] 1 items
- 0 "tiles"
rendered_preview
- href "https://planetarycomputer.microsoft.com/api/data/v1/item/preview.png?collection=sentinel-1-rtc&item=S1A_IW_GRDH_1SDV_20220301T000313_20220301T000338_042120_0504AF_rtc&assets=vv&assets=vh&tile_format=png&expression=0.03+%2B+log+%2810e-4+-+log+%280.05+%2F+%280.02+%2B+2+%2A+vv%29%29%29%3B0.05+%2B+exp+%280.25+%2A+%28log+%280.01+%2B+2+%2A+vv%29+%2B+log+%280.02+%2B+5+%2A+vh%29%29%29%3B1+-+log+%280.05+%2F+%280.045+-+0.9+%2A+vv%29%29&asset_as_band=True&rescale=0%2C.8000&rescale=0%2C1.000&rescale=0%2C1.000&format=png"
- type "image/png"
- title "Rendered preview"
- rel "preview"
roles [] 1 items
- 0 "overview"
bbox [] 4 items
- 0 87.30528278
- 1 26.92280692
- 2 90.0496514
- 3 28.84029599
stac_extensions [] 6 items
- 0 "https://stac-extensions.github.io/sar/v1.0.0/schema.json"
- 1 "https://stac-extensions.github.io/sat/v1.0.0/schema.json"
- 2 "https://stac-extensions.github.io/eo/v1.0.0/schema.json"
- 3 "https://stac-extensions.github.io/projection/v1.0.0/schema.json"
- 4 "https://stac-extensions.github.io/file/v2.0.0/schema.json"
- 5 "https://stac-extensions.github.io/raster/v1.1.0/schema.json"
- collection "sentinel-1-rtc"
37
- type "Feature"
- stac_version "1.0.0"
- id "S1A_IW_GRDH_1SDV_20220226T121354_20220226T121419_042084_050376_rtc"
properties
- datetime "2022-02-26T12:14:07.075742Z"
- platform "SENTINEL-1A"
s1:shape [] 2 items
- 0 28172
- 1 21599
proj:bbox [] 4 items
- 0 421580.0
- 1 2916200.0
- 2 703300.0
- 3 3132190.0
- proj:epsg 32645
proj:shape [] 2 items
- 0 21599
- 1 28172
- end_datetime "2022-02-26 12:14:19.574817+00:00"
- constellation "Sentinel-1"
- s1:resolution "high"
proj:transform [] 9 items
- 0 10.0
- 1 0.0
- 2 421580.0
- 3 0.0
- 4 -10.0
- 5 3132190.0
- 6 0.0
- 7 0.0
- 8 1.0
- s1:datatake_id "328566"
- start_datetime "2022-02-26 12:13:54.576668+00:00"
- s1:orbit_source "PREORB"
- s1:slice_number "6"
- s1:total_slices "20"
- sar:looks_range 5
- sat:orbit_state "ascending"
- sar:product_type "GRD"
- sar:looks_azimuth 1
sar:polarizations [] 2 items
- 0 "VV"
- 1 "VH"
- sar:frequency_band "C"
- sat:absolute_orbit 42084
- sat:relative_orbit 12
- s1:processing_level "1"
- sar:instrument_mode "IW"
- sar:center_frequency 5.405
- sar:resolution_range 20
- s1:product_timeliness "Fast-24h"
- sar:resolution_azimuth 22
- sar:pixel_spacing_range 10
- sar:observation_direction "right"
- sar:pixel_spacing_azimuth 10
- sar:looks_equivalent_number 4.4
- s1:instrument_configuration_ID "7"
- sat:platform_international_designator "2014-016A"
geometry
- type "Polygon"
coordinates [] 1 items
0 [] 15 items
0 [] 2 items
- 0 86.2035613
- 1 27.8464713
1 [] 2 items
- 0 86.2097146
- 1 27.7820987
2 [] 2 items
- 0 86.2343838
- 1 27.7813348
3 [] 2 items
- 0 86.2159919
- 1 27.7559558
4 [] 2 items
- 0 86.2703663
- 1 27.6973055
5 [] 2 items
- 0 86.2770689
- 1 27.4641621
6 [] 2 items
- 0 86.3265856
- 1 27.3763
7 [] 2 items
- 0 86.3181672
- 1 27.231543
8 [] 2 items
- 0 86.3549302
- 1 27.1612084
9 [] 2 items
- 0 86.4985768
- 1 26.3663226
10 [] 2 items
- 0 88.9843656
- 1 26.7768113
11 [] 2 items
- 0 88.9221377
- 1 27.3277754
12 [] 2 items
- 0 88.7377408
- 1 28.2893425
13 [] 2 items
- 0 86.2108733
- 1 27.881538
14 [] 2 items
- 0 86.2035613
- 1 27.8464713
links [] 7 items
0
- rel "collection"
- href "https://planetarycomputer.microsoft.com/api/stac/v1/collections/sentinel-1-rtc"
- type "application/json"
1
- rel "parent"
- href "https://planetarycomputer.microsoft.com/api/stac/v1/collections/sentinel-1-rtc"
- type "application/json"
2
- rel "root"
- href "https://planetarycomputer.microsoft.com/api/stac/v1"
- type "application/json"
- title "Microsoft Planetary Computer STAC API"
3
- rel "self"
- href "https://planetarycomputer.microsoft.com/api/stac/v1/collections/sentinel-1-rtc/items/S1A_IW_GRDH_1SDV_20220226T121354_20220226T121419_042084_050376_rtc"
- type "application/geo+json"
4
- rel "license"
- href "https://sentinel.esa.int/documents/247904/690755/Sentinel_Data_Legal_Notice"
5
- rel "derived_from"
- href "https://planetarycomputer.microsoft.com/api/stac/v1/collections/sentinel-1-grd/items/S1A_IW_GRDH_1SDV_20220226T121354_20220226T121419_042084_050376"
- type "application/json"
- title "Sentinel 1 GRD Item"
6
- rel "preview"
- href "https://planetarycomputer.microsoft.com/api/data/v1/item/map?collection=sentinel-1-rtc&item=S1A_IW_GRDH_1SDV_20220226T121354_20220226T121419_042084_050376_rtc"
- type "text/html"
- title "Map of item"
assets
vh
- href "https://sentinel1euwestrtc.blob.core.windows.net/sentinel1-grd-rtc/GRD/2022/2/26/IW/DV/S1A_IW_GRDH_1SDV_20220226T121354_20220226T121419_042084_050376_7D87/measurement/iw-vh.rtc.tiff"
- type "image/tiff; application=geotiff; profile=cloud-optimized"
- title "VH: vertical transmit, horizontal receive"
- description "Terrain-corrected gamma naught values of signal transmitted with vertical polarization and received with horizontal polarization with radiometric terrain correction applied."
- file:size 1871501868
- file:checksum "a78e5ba166fd8bd8ce8c1b6748c427f5"
raster:bands [] 1 items
0
- nodata -32768
- data_type "float32"
- spatial_resolution 10.0
roles [] 1 items
- 0 "data"
vv
- href "https://sentinel1euwestrtc.blob.core.windows.net/sentinel1-grd-rtc/GRD/2022/2/26/IW/DV/S1A_IW_GRDH_1SDV_20220226T121354_20220226T121419_042084_050376_7D87/measurement/iw-vv.rtc.tiff"
- type "image/tiff; application=geotiff; profile=cloud-optimized"
- title "VV: vertical transmit, vertical receive"
- description "Terrain-corrected gamma naught values of signal transmitted with vertical polarization and received with vertical polarization with radiometric terrain correction applied."
- file:size 1879094912
- file:checksum "8df4f90f49002cce0230df3d6407cde0"
raster:bands [] 1 items
0
- nodata -32768
- data_type "float32"
- spatial_resolution 10.0
roles [] 1 items
- 0 "data"
tilejson
- href "https://planetarycomputer.microsoft.com/api/data/v1/item/tilejson.json?collection=sentinel-1-rtc&item=S1A_IW_GRDH_1SDV_20220226T121354_20220226T121419_042084_050376_rtc&assets=vv&assets=vh&tile_format=png&expression=0.03+%2B+log+%2810e-4+-+log+%280.05+%2F+%280.02+%2B+2+%2A+vv%29%29%29%3B0.05+%2B+exp+%280.25+%2A+%28log+%280.01+%2B+2+%2A+vv%29+%2B+log+%280.02+%2B+5+%2A+vh%29%29%29%3B1+-+log+%280.05+%2F+%280.045+-+0.9+%2A+vv%29%29&asset_as_band=True&rescale=0%2C.8000&rescale=0%2C1.000&rescale=0%2C1.000&format=png"
- type "application/json"
- title "TileJSON with default rendering"
roles [] 1 items
- 0 "tiles"
rendered_preview
- href "https://planetarycomputer.microsoft.com/api/data/v1/item/preview.png?collection=sentinel-1-rtc&item=S1A_IW_GRDH_1SDV_20220226T121354_20220226T121419_042084_050376_rtc&assets=vv&assets=vh&tile_format=png&expression=0.03+%2B+log+%2810e-4+-+log+%280.05+%2F+%280.02+%2B+2+%2A+vv%29%29%29%3B0.05+%2B+exp+%280.25+%2A+%28log+%280.01+%2B+2+%2A+vv%29+%2B+log+%280.02+%2B+5+%2A+vh%29%29%29%3B1+-+log+%280.05+%2F+%280.045+-+0.9+%2A+vv%29%29&asset_as_band=True&rescale=0%2C.8000&rescale=0%2C1.000&rescale=0%2C1.000&format=png"
- type "image/png"
- title "Rendered preview"
- rel "preview"
roles [] 1 items
- 0 "overview"
bbox [] 4 items
- 0 86.20356132
- 1 26.36632263
- 2 88.98436564
- 3 28.28934254
stac_extensions [] 6 items
- 0 "https://stac-extensions.github.io/sar/v1.0.0/schema.json"
- 1 "https://stac-extensions.github.io/sat/v1.0.0/schema.json"
- 2 "https://stac-extensions.github.io/eo/v1.0.0/schema.json"
- 3 "https://stac-extensions.github.io/projection/v1.0.0/schema.json"
- 4 "https://stac-extensions.github.io/file/v2.0.0/schema.json"
- 5 "https://stac-extensions.github.io/raster/v1.1.0/schema.json"
- collection "sentinel-1-rtc"
38
- type "Feature"
- stac_version "1.0.0"
- id "S1A_IW_GRDH_1SDV_20220221T120547_20220221T120612_042011_050108_rtc"
properties
- datetime "2022-02-21T12:05:59.939806Z"
- platform "SENTINEL-1A"
s1:shape [] 2 items
- 0 28430
- 1 21971
proj:bbox [] 4 items
- 0 618080.0
- 1 2960420.0
- 2 902380.0
- 3 3180130.0
- proj:epsg 32645
proj:shape [] 2 items
- 0 21971
- 1 28430
- end_datetime "2022-02-21 12:06:12.438945+00:00"
- constellation "Sentinel-1"
- s1:resolution "high"
proj:transform [] 9 items
- 0 10.0
- 1 0.0
- 2 618080.0
- 3 0.0
- 4 -10.0
- 5 3180130.0
- 6 0.0
- 7 0.0
- 8 1.0
- s1:datatake_id "327944"
- start_datetime "2022-02-21 12:05:47.440666+00:00"
- s1:orbit_source "PREORB"
- s1:slice_number "6"
- s1:total_slices "21"
- sar:looks_range 5
- sat:orbit_state "ascending"
- sar:product_type "GRD"
- sar:looks_azimuth 1
sar:polarizations [] 2 items
- 0 "VV"
- 1 "VH"
- sar:frequency_band "C"
- sat:absolute_orbit 42011
- sat:relative_orbit 114
- s1:processing_level "1"
- sar:instrument_mode "IW"
- sar:center_frequency 5.405
- sar:resolution_range 20
- s1:product_timeliness "Fast-24h"
- sar:resolution_azimuth 22
- sar:pixel_spacing_range 10
- sar:observation_direction "right"
- sar:pixel_spacing_azimuth 10
- sar:looks_equivalent_number 4.4
- s1:instrument_configuration_ID "7"
- sat:platform_international_designator "2014-016A"
geometry
- type "Polygon"
coordinates [] 1 items
0 [] 14 items
0 [] 2 items
- 0 89.9810315
- 1 27.0124378
1 [] 2 items
- 0 90.9926271
- 1 27.1727756
2 [] 2 items
- 0 90.7238271
- 1 28.6817637
3 [] 2 items
- 0 88.2164574
- 1 28.2795929
4 [] 2 items
- 0 88.3534481
- 1 27.7232126
5 [] 2 items
- 0 88.3287421
- 1 27.5842656
6 [] 2 items
- 0 88.3752724
- 1 27.5218013
7 [] 2 items
- 0 88.3581562
- 1 27.3974936
8 [] 2 items
- 0 88.3992532
- 1 27.3361581
9 [] 2 items
- 0 88.3785276
- 1 27.3030558
10 [] 2 items
- 0 88.4155016
- 1 27.2066427
11 [] 2 items
- 0 88.4031317
- 1 27.0893282
12 [] 2 items
- 0 88.4741229
- 1 26.759435
13 [] 2 items
- 0 89.9810315
- 1 27.0124378
links [] 7 items
0
- rel "collection"
- href "https://planetarycomputer.microsoft.com/api/stac/v1/collections/sentinel-1-rtc"
- type "application/json"
1
- rel "parent"
- href "https://planetarycomputer.microsoft.com/api/stac/v1/collections/sentinel-1-rtc"
- type "application/json"
2
- rel "root"
- href "https://planetarycomputer.microsoft.com/api/stac/v1"
- type "application/json"
- title "Microsoft Planetary Computer STAC API"
3
- rel "self"
- href "https://planetarycomputer.microsoft.com/api/stac/v1/collections/sentinel-1-rtc/items/S1A_IW_GRDH_1SDV_20220221T120547_20220221T120612_042011_050108_rtc"
- type "application/geo+json"
4
- rel "license"
- href "https://sentinel.esa.int/documents/247904/690755/Sentinel_Data_Legal_Notice"
5
- rel "derived_from"
- href "https://planetarycomputer.microsoft.com/api/stac/v1/collections/sentinel-1-grd/items/S1A_IW_GRDH_1SDV_20220221T120547_20220221T120612_042011_050108"
- type "application/json"
- title "Sentinel 1 GRD Item"
6
- rel "preview"
- href "https://planetarycomputer.microsoft.com/api/data/v1/item/map?collection=sentinel-1-rtc&item=S1A_IW_GRDH_1SDV_20220221T120547_20220221T120612_042011_050108_rtc"
- type "text/html"
- title "Map of item"
assets
vh
- href "https://sentinel1euwestrtc.blob.core.windows.net/sentinel1-grd-rtc/GRD/2022/2/21/IW/DV/S1A_IW_GRDH_1SDV_20220221T120547_20220221T120612_042011_050108_9831/measurement/iw-vh.rtc.tiff"
- type "image/tiff; application=geotiff; profile=cloud-optimized"
- title "VH: vertical transmit, horizontal receive"
- description "Terrain-corrected gamma naught values of signal transmitted with vertical polarization and received with horizontal polarization with radiometric terrain correction applied."
- file:size 1853786004
- file:checksum "d5f3444264ce3fdd82db1ac5f094b9fb"
raster:bands [] 1 items
0
- nodata -32768
- data_type "float32"
- spatial_resolution 10.0
roles [] 1 items
- 0 "data"
vv
- href "https://sentinel1euwestrtc.blob.core.windows.net/sentinel1-grd-rtc/GRD/2022/2/21/IW/DV/S1A_IW_GRDH_1SDV_20220221T120547_20220221T120612_042011_050108_9831/measurement/iw-vv.rtc.tiff"
- type "image/tiff; application=geotiff; profile=cloud-optimized"
- title "VV: vertical transmit, vertical receive"
- description "Terrain-corrected gamma naught values of signal transmitted with vertical polarization and received with vertical polarization with radiometric terrain correction applied."
- file:size 1860866586
- file:checksum "647ceccdc6a6c800fe0b7b1ca826560e"
raster:bands [] 1 items
0
- nodata -32768
- data_type "float32"
- spatial_resolution 10.0
roles [] 1 items
- 0 "data"
tilejson
- href "https://planetarycomputer.microsoft.com/api/data/v1/item/tilejson.json?collection=sentinel-1-rtc&item=S1A_IW_GRDH_1SDV_20220221T120547_20220221T120612_042011_050108_rtc&assets=vv&assets=vh&tile_format=png&expression=0.03+%2B+log+%2810e-4+-+log+%280.05+%2F+%280.02+%2B+2+%2A+vv%29%29%29%3B0.05+%2B+exp+%280.25+%2A+%28log+%280.01+%2B+2+%2A+vv%29+%2B+log+%280.02+%2B+5+%2A+vh%29%29%29%3B1+-+log+%280.05+%2F+%280.045+-+0.9+%2A+vv%29%29&asset_as_band=True&rescale=0%2C.8000&rescale=0%2C1.000&rescale=0%2C1.000&format=png"
- type "application/json"
- title "TileJSON with default rendering"
roles [] 1 items
- 0 "tiles"
rendered_preview
- href "https://planetarycomputer.microsoft.com/api/data/v1/item/preview.png?collection=sentinel-1-rtc&item=S1A_IW_GRDH_1SDV_20220221T120547_20220221T120612_042011_050108_rtc&assets=vv&assets=vh&tile_format=png&expression=0.03+%2B+log+%2810e-4+-+log+%280.05+%2F+%280.02+%2B+2+%2A+vv%29%29%29%3B0.05+%2B+exp+%280.25+%2A+%28log+%280.01+%2B+2+%2A+vv%29+%2B+log+%280.02+%2B+5+%2A+vh%29%29%29%3B1+-+log+%280.05+%2F+%280.045+-+0.9+%2A+vv%29%29&asset_as_band=True&rescale=0%2C.8000&rescale=0%2C1.000&rescale=0%2C1.000&format=png"
- type "image/png"
- title "Rendered preview"
- rel "preview"
roles [] 1 items
- 0 "overview"
bbox [] 4 items
- 0 88.21645736
- 1 26.75943501
- 2 90.99262708
- 3 28.68176365
stac_extensions [] 6 items
- 0 "https://stac-extensions.github.io/sar/v1.0.0/schema.json"
- 1 "https://stac-extensions.github.io/sat/v1.0.0/schema.json"
- 2 "https://stac-extensions.github.io/eo/v1.0.0/schema.json"
- 3 "https://stac-extensions.github.io/projection/v1.0.0/schema.json"
- 4 "https://stac-extensions.github.io/file/v2.0.0/schema.json"
- 5 "https://stac-extensions.github.io/raster/v1.1.0/schema.json"
- collection "sentinel-1-rtc"
39
- type "Feature"
- stac_version "1.0.0"
- id "S1A_IW_GRDH_1SDV_20220217T000313_20220217T000338_041945_04FEB2_rtc"
properties
- datetime "2022-02-17T00:03:25.677942Z"
- platform "SENTINEL-1A"
s1:shape [] 2 items
- 0 27531
- 1 21083
proj:bbox [] 4 items
- 0 524490.0
- 1 2980860.0
- 2 799800.0
- 3 3191690.0
- proj:epsg 32645
proj:shape [] 2 items
- 0 21083
- 1 27531
- end_datetime "2022-02-17 00:03:38.176642+00:00"
- constellation "Sentinel-1"
- s1:resolution "high"
proj:transform [] 9 items
- 0 10.0
- 1 0.0
- 2 524490.0
- 3 0.0
- 4 -10.0
- 5 3191690.0
- 6 0.0
- 7 0.0
- 8 1.0
- s1:datatake_id "327346"
- start_datetime "2022-02-17 00:03:13.179242+00:00"
- s1:orbit_source "RESORB"
- s1:slice_number "12"
- s1:total_slices "17"
- sar:looks_range 5
- sat:orbit_state "descending"
- sar:product_type "GRD"
- sar:looks_azimuth 1
sar:polarizations [] 2 items
- 0 "VV"
- 1 "VH"
- sar:frequency_band "C"
- sat:absolute_orbit 41945
- sat:relative_orbit 48
- s1:processing_level "1"
- sar:instrument_mode "IW"
- sar:center_frequency 5.405
- sar:resolution_range 20
- s1:product_timeliness "Fast-24h"
- sar:resolution_azimuth 22
- sar:pixel_spacing_range 10
- sar:observation_direction "right"
- sar:pixel_spacing_azimuth 10
- sar:looks_equivalent_number 4.4
- s1:instrument_configuration_ID "7"
- sat:platform_international_designator "2014-016A"
geometry
- type "Polygon"
coordinates [] 1 items
0 [] 19 items
0 [] 2 items
- 0 89.804314
- 1 27.0228371
1 [] 2 items
- 0 89.8292935
- 1 27.2747258
2 [] 2 items
- 0 89.9033439
- 1 27.4312625
3 [] 2 items
- 0 89.9219145
- 1 27.6326771
4 [] 2 items
- 0 89.9527292
- 1 27.6787521
5 [] 2 items
- 0 89.9293598
- 1 27.824034
6 [] 2 items
- 0 89.9443454
- 1 27.9503656
7 [] 2 items
- 0 89.9877158
- 1 28.0017487
8 [] 2 items
- 0 89.9712875
- 1 28.0843713
9 [] 2 items
- 0 89.9978804
- 1 28.1481969
10 [] 2 items
- 0 89.9733431
- 1 28.1919392
11 [] 2 items
- 0 90.0263346
- 1 28.291079
12 [] 2 items
- 0 90.0496514
- 1 28.4418663
13 [] 2 items
- 0 87.558226
- 1 28.8402964
14 [] 2 items
- 0 87.4257922
- 1 28.193897
15 [] 2 items
- 0 87.3053841
- 1 27.3295612
16 [] 2 items
- 0 89.7847765
- 1 26.9228971
17 [] 2 items
- 0 89.7772352
- 1 26.9949991
18 [] 2 items
- 0 89.804314
- 1 27.0228371
links [] 7 items
0
- rel "collection"
- href "https://planetarycomputer.microsoft.com/api/stac/v1/collections/sentinel-1-rtc"
- type "application/json"
1
- rel "parent"
- href "https://planetarycomputer.microsoft.com/api/stac/v1/collections/sentinel-1-rtc"
- type "application/json"
2
- rel "root"
- href "https://planetarycomputer.microsoft.com/api/stac/v1"
- type "application/json"
- title "Microsoft Planetary Computer STAC API"
3
- rel "self"
- href "https://planetarycomputer.microsoft.com/api/stac/v1/collections/sentinel-1-rtc/items/S1A_IW_GRDH_1SDV_20220217T000313_20220217T000338_041945_04FEB2_rtc"
- type "application/geo+json"
4
- rel "license"
- href "https://sentinel.esa.int/documents/247904/690755/Sentinel_Data_Legal_Notice"
5
- rel "derived_from"
- href "https://planetarycomputer.microsoft.com/api/stac/v1/collections/sentinel-1-grd/items/S1A_IW_GRDH_1SDV_20220217T000313_20220217T000338_041945_04FEB2"
- type "application/json"
- title "Sentinel 1 GRD Item"
6
- rel "preview"
- href "https://planetarycomputer.microsoft.com/api/data/v1/item/map?collection=sentinel-1-rtc&item=S1A_IW_GRDH_1SDV_20220217T000313_20220217T000338_041945_04FEB2_rtc"
- type "text/html"
- title "Map of item"
assets
vh
- href "https://sentinel1euwestrtc.blob.core.windows.net/sentinel1-grd-rtc/GRD/2022/2/17/IW/DV/S1A_IW_GRDH_1SDV_20220217T000313_20220217T000338_041945_04FEB2_6A2C/measurement/iw-vh.rtc.tiff"
- type "image/tiff; application=geotiff; profile=cloud-optimized"
- title "VH: vertical transmit, horizontal receive"
- description "Terrain-corrected gamma naught values of signal transmitted with vertical polarization and received with horizontal polarization with radiometric terrain correction applied."
- file:size 1840786190
- file:checksum "667056533b49b2b8c3edbbac76a53766"
raster:bands [] 1 items
0
- nodata -32768
- data_type "float32"
- spatial_resolution 10.0
roles [] 1 items
- 0 "data"
vv
- href "https://sentinel1euwestrtc.blob.core.windows.net/sentinel1-grd-rtc/GRD/2022/2/17/IW/DV/S1A_IW_GRDH_1SDV_20220217T000313_20220217T000338_041945_04FEB2_6A2C/measurement/iw-vv.rtc.tiff"
- type "image/tiff; application=geotiff; profile=cloud-optimized"
- title "VV: vertical transmit, vertical receive"
- description "Terrain-corrected gamma naught values of signal transmitted with vertical polarization and received with vertical polarization with radiometric terrain correction applied."
- file:size 1847324712
- file:checksum "1864f7256ba09fcbe83df5ec47c62803"
raster:bands [] 1 items
0
- nodata -32768
- data_type "float32"
- spatial_resolution 10.0
roles [] 1 items
- 0 "data"
tilejson
- href "https://planetarycomputer.microsoft.com/api/data/v1/item/tilejson.json?collection=sentinel-1-rtc&item=S1A_IW_GRDH_1SDV_20220217T000313_20220217T000338_041945_04FEB2_rtc&assets=vv&assets=vh&tile_format=png&expression=0.03+%2B+log+%2810e-4+-+log+%280.05+%2F+%280.02+%2B+2+%2A+vv%29%29%29%3B0.05+%2B+exp+%280.25+%2A+%28log+%280.01+%2B+2+%2A+vv%29+%2B+log+%280.02+%2B+5+%2A+vh%29%29%29%3B1+-+log+%280.05+%2F+%280.045+-+0.9+%2A+vv%29%29&asset_as_band=True&rescale=0%2C.8000&rescale=0%2C1.000&rescale=0%2C1.000&format=png"
- type "application/json"
- title "TileJSON with default rendering"
roles [] 1 items
- 0 "tiles"
rendered_preview
- href "https://planetarycomputer.microsoft.com/api/data/v1/item/preview.png?collection=sentinel-1-rtc&item=S1A_IW_GRDH_1SDV_20220217T000313_20220217T000338_041945_04FEB2_rtc&assets=vv&assets=vh&tile_format=png&expression=0.03+%2B+log+%2810e-4+-+log+%280.05+%2F+%280.02+%2B+2+%2A+vv%29%29%29%3B0.05+%2B+exp+%280.25+%2A+%28log+%280.01+%2B+2+%2A+vv%29+%2B+log+%280.02+%2B+5+%2A+vh%29%29%29%3B1+-+log+%280.05+%2F+%280.045+-+0.9+%2A+vv%29%29&asset_as_band=True&rescale=0%2C.8000&rescale=0%2C1.000&rescale=0%2C1.000&format=png"
- type "image/png"
- title "Rendered preview"
- rel "preview"
roles [] 1 items
- 0 "overview"
bbox [] 4 items
- 0 87.30538411
- 1 26.9228971
- 2 90.0496514
- 3 28.84029641
stac_extensions [] 6 items
- 0 "https://stac-extensions.github.io/sar/v1.0.0/schema.json"
- 1 "https://stac-extensions.github.io/sat/v1.0.0/schema.json"
- 2 "https://stac-extensions.github.io/eo/v1.0.0/schema.json"
- 3 "https://stac-extensions.github.io/projection/v1.0.0/schema.json"
- 4 "https://stac-extensions.github.io/file/v2.0.0/schema.json"
- 5 "https://stac-extensions.github.io/raster/v1.1.0/schema.json"
- collection "sentinel-1-rtc"
40
- type "Feature"
- stac_version "1.0.0"
- id "S1A_IW_GRDH_1SDV_20220214T121354_20220214T121419_041909_04FD6F_rtc"
properties
- datetime "2022-02-14T12:14:07.178103Z"
- platform "SENTINEL-1A"
s1:shape [] 2 items
- 0 28241
- 1 21599
proj:bbox [] 4 items
- 0 420920.0
- 1 2916200.0
- 2 703330.0
- 3 3132190.0
- proj:epsg 32645
proj:shape [] 2 items
- 0 21599
- 1 28241
- end_datetime "2022-02-14 12:14:19.677198+00:00"
- constellation "Sentinel-1"
- s1:resolution "high"
proj:transform [] 9 items
- 0 10.0
- 1 0.0
- 2 420920.0
- 3 0.0
- 4 -10.0
- 5 3132190.0
- 6 0.0
- 7 0.0
- 8 1.0
- s1:datatake_id "327023"
- start_datetime "2022-02-14 12:13:54.679007+00:00"
- s1:orbit_source "PREORB"
- s1:slice_number "6"
- s1:total_slices "20"
- sar:looks_range 5
- sat:orbit_state "ascending"
- sar:product_type "GRD"
- sar:looks_azimuth 1
sar:polarizations [] 2 items
- 0 "VV"
- 1 "VH"
- sar:frequency_band "C"
- sat:absolute_orbit 41909
- sat:relative_orbit 12
- s1:processing_level "1"
- sar:instrument_mode "IW"
- sar:center_frequency 5.405
- sar:resolution_range 20
- s1:product_timeliness "Fast-24h"
- sar:resolution_azimuth 22
- sar:pixel_spacing_range 10
- sar:observation_direction "right"
- sar:pixel_spacing_azimuth 10
- sar:looks_equivalent_number 4.4
- s1:instrument_configuration_ID "7"
- sat:platform_international_designator "2014-016A"
geometry
- type "Polygon"
coordinates [] 1 items
0 [] 16 items
0 [] 2 items
- 0 87.86403
- 1 26.5974425
1 [] 2 items
- 0 88.9845667
- 1 26.7768085
2 [] 2 items
- 0 88.9222387
- 1 27.327774
3 [] 2 items
- 0 88.7379447
- 1 28.2893399
4 [] 2 items
- 0 86.2109749
- 1 27.8815386
5 [] 2 items
- 0 86.2036606
- 1 27.8467878
6 [] 2 items
- 0 86.2098135
- 1 27.7824603
7 [] 2 items
- 0 86.2344847
- 1 27.7814256
8 [] 2 items
- 0 86.2160921
- 1 27.7561369
9 [] 2 items
- 0 86.2705686
- 1 27.6973968
10 [] 2 items
- 0 86.2772708
- 1 27.4642534
11 [] 2 items
- 0 86.3265774
- 1 27.3776542
12 [] 2 items
- 0 86.3183703
- 1 27.2313635
13 [] 2 items
- 0 86.3551331
- 1 27.1610288
14 [] 2 items
- 0 86.4987772
- 1 26.3663233
15 [] 2 items
- 0 87.86403
- 1 26.5974425
links [] 7 items
0
- rel "collection"
- href "https://planetarycomputer.microsoft.com/api/stac/v1/collections/sentinel-1-rtc"
- type "application/json"
1
- rel "parent"
- href "https://planetarycomputer.microsoft.com/api/stac/v1/collections/sentinel-1-rtc"
- type "application/json"
2
- rel "root"
- href "https://planetarycomputer.microsoft.com/api/stac/v1"
- type "application/json"
- title "Microsoft Planetary Computer STAC API"
3
- rel "self"
- href "https://planetarycomputer.microsoft.com/api/stac/v1/collections/sentinel-1-rtc/items/S1A_IW_GRDH_1SDV_20220214T121354_20220214T121419_041909_04FD6F_rtc"
- type "application/geo+json"
4
- rel "license"
- href "https://sentinel.esa.int/documents/247904/690755/Sentinel_Data_Legal_Notice"
5
- rel "derived_from"
- href "https://planetarycomputer.microsoft.com/api/stac/v1/collections/sentinel-1-grd/items/S1A_IW_GRDH_1SDV_20220214T121354_20220214T121419_041909_04FD6F"
- type "application/json"
- title "Sentinel 1 GRD Item"
6
- rel "preview"
- href "https://planetarycomputer.microsoft.com/api/data/v1/item/map?collection=sentinel-1-rtc&item=S1A_IW_GRDH_1SDV_20220214T121354_20220214T121419_041909_04FD6F_rtc"
- type "text/html"
- title "Map of item"
assets
vh
- href "https://sentinel1euwestrtc.blob.core.windows.net/sentinel1-grd-rtc/GRD/2022/2/14/IW/DV/S1A_IW_GRDH_1SDV_20220214T121354_20220214T121419_041909_04FD6F_3952/measurement/iw-vh.rtc.tiff"
- type "image/tiff; application=geotiff; profile=cloud-optimized"
- title "VH: vertical transmit, horizontal receive"
- description "Terrain-corrected gamma naught values of signal transmitted with vertical polarization and received with horizontal polarization with radiometric terrain correction applied."
- file:size 1870648966
- file:checksum "74029c4a6490151b21d265a5560a3e94"
raster:bands [] 1 items
0
- nodata -32768
- data_type "float32"
- spatial_resolution 10.0
roles [] 1 items
- 0 "data"
vv
- href "https://sentinel1euwestrtc.blob.core.windows.net/sentinel1-grd-rtc/GRD/2022/2/14/IW/DV/S1A_IW_GRDH_1SDV_20220214T121354_20220214T121419_041909_04FD6F_3952/measurement/iw-vv.rtc.tiff"
- type "image/tiff; application=geotiff; profile=cloud-optimized"
- title "VV: vertical transmit, vertical receive"
- description "Terrain-corrected gamma naught values of signal transmitted with vertical polarization and received with vertical polarization with radiometric terrain correction applied."
- file:size 1878267778
- file:checksum "cc8900877d1c0553280e409224ca5b7a"
raster:bands [] 1 items
0
- nodata -32768
- data_type "float32"
- spatial_resolution 10.0
roles [] 1 items
- 0 "data"
tilejson
- href "https://planetarycomputer.microsoft.com/api/data/v1/item/tilejson.json?collection=sentinel-1-rtc&item=S1A_IW_GRDH_1SDV_20220214T121354_20220214T121419_041909_04FD6F_rtc&assets=vv&assets=vh&tile_format=png&expression=0.03+%2B+log+%2810e-4+-+log+%280.05+%2F+%280.02+%2B+2+%2A+vv%29%29%29%3B0.05+%2B+exp+%280.25+%2A+%28log+%280.01+%2B+2+%2A+vv%29+%2B+log+%280.02+%2B+5+%2A+vh%29%29%29%3B1+-+log+%280.05+%2F+%280.045+-+0.9+%2A+vv%29%29&asset_as_band=True&rescale=0%2C.8000&rescale=0%2C1.000&rescale=0%2C1.000&format=png"
- type "application/json"
- title "TileJSON with default rendering"
roles [] 1 items
- 0 "tiles"
rendered_preview
- href "https://planetarycomputer.microsoft.com/api/data/v1/item/preview.png?collection=sentinel-1-rtc&item=S1A_IW_GRDH_1SDV_20220214T121354_20220214T121419_041909_04FD6F_rtc&assets=vv&assets=vh&tile_format=png&expression=0.03+%2B+log+%2810e-4+-+log+%280.05+%2F+%280.02+%2B+2+%2A+vv%29%29%29%3B0.05+%2B+exp+%280.25+%2A+%28log+%280.01+%2B+2+%2A+vv%29+%2B+log+%280.02+%2B+5+%2A+vh%29%29%29%3B1+-+log+%280.05+%2F+%280.045+-+0.9+%2A+vv%29%29&asset_as_band=True&rescale=0%2C.8000&rescale=0%2C1.000&rescale=0%2C1.000&format=png"
- type "image/png"
- title "Rendered preview"
- rel "preview"
roles [] 1 items
- 0 "overview"
bbox [] 4 items
- 0 86.20366057
- 1 26.36632333
- 2 88.9845667
- 3 28.28933995
stac_extensions [] 6 items
- 0 "https://stac-extensions.github.io/sar/v1.0.0/schema.json"
- 1 "https://stac-extensions.github.io/sat/v1.0.0/schema.json"
- 2 "https://stac-extensions.github.io/eo/v1.0.0/schema.json"
- 3 "https://stac-extensions.github.io/projection/v1.0.0/schema.json"
- 4 "https://stac-extensions.github.io/file/v2.0.0/schema.json"
- 5 "https://stac-extensions.github.io/raster/v1.1.0/schema.json"
- collection "sentinel-1-rtc"
41
- type "Feature"
- stac_version "1.0.0"
- id "S1A_IW_GRDH_1SDV_20220209T120547_20220209T120612_041836_04FAF5_rtc"
properties
- datetime "2022-02-09T12:06:00.019287Z"
- platform "SENTINEL-1A"
s1:shape [] 2 items
- 0 28429
- 1 21971
proj:bbox [] 4 items
- 0 618130.0
- 1 2960430.0
- 2 902420.0
- 3 3180140.0
- proj:epsg 32645
proj:shape [] 2 items
- 0 21971
- 1 28429
- end_datetime "2022-02-09 12:06:12.518456+00:00"
- constellation "Sentinel-1"
- s1:resolution "high"
proj:transform [] 9 items
- 0 10.0
- 1 0.0
- 2 618130.0
- 3 0.0
- 4 -10.0
- 5 3180140.0
- 6 0.0
- 7 0.0
- 8 1.0
- s1:datatake_id "326389"
- start_datetime "2022-02-09 12:05:47.520119+00:00"
- s1:orbit_source "PREORB"
- s1:slice_number "6"
- s1:total_slices "21"
- sar:looks_range 5
- sat:orbit_state "ascending"
- sar:product_type "GRD"
- sar:looks_azimuth 1
sar:polarizations [] 2 items
- 0 "VV"
- 1 "VH"
- sar:frequency_band "C"
- sat:absolute_orbit 41836
- sat:relative_orbit 114
- s1:processing_level "1"
- sar:instrument_mode "IW"
- sar:center_frequency 5.405
- sar:resolution_range 20
- s1:product_timeliness "Fast-24h"
- sar:resolution_azimuth 22
- sar:pixel_spacing_range 10
- sar:observation_direction "right"
- sar:pixel_spacing_azimuth 10
- sar:looks_equivalent_number 4.4
- s1:instrument_configuration_ID "7"
- sat:platform_international_designator "2014-016A"
geometry
- type "Polygon"
coordinates [] 1 items
0 [] 14 items
0 [] 2 items
- 0 89.9819398
- 1 27.0125088
1 [] 2 items
- 0 90.9932345
- 1 27.1728484
2 [] 2 items
- 0 90.7242356
- 1 28.6817524
3 [] 2 items
- 0 88.2170701
- 1 28.2796777
4 [] 2 items
- 0 88.3541547
- 1 27.7229349
5 [] 2 items
- 0 88.3292486
- 1 27.5842608
6 [] 2 items
- 0 88.3757797
- 1 27.5218865
7 [] 2 items
- 0 88.3573861
- 1 27.4089649
8 [] 2 items
- 0 88.3997608
- 1 27.3363335
9 [] 2 items
- 0 88.3788273
- 1 27.302782
10 [] 2 items
- 0 88.4158044
- 1 27.2066396
11 [] 2 items
- 0 88.403637
- 1 27.0894134
12 [] 2 items
- 0 88.4747262
- 1 26.7594287
13 [] 2 items
- 0 89.9819398
- 1 27.0125088
links [] 7 items
0
- rel "collection"
- href "https://planetarycomputer.microsoft.com/api/stac/v1/collections/sentinel-1-rtc"
- type "application/json"
1
- rel "parent"
- href "https://planetarycomputer.microsoft.com/api/stac/v1/collections/sentinel-1-rtc"
- type "application/json"
2
- rel "root"
- href "https://planetarycomputer.microsoft.com/api/stac/v1"
- type "application/json"
- title "Microsoft Planetary Computer STAC API"
3
- rel "self"
- href "https://planetarycomputer.microsoft.com/api/stac/v1/collections/sentinel-1-rtc/items/S1A_IW_GRDH_1SDV_20220209T120547_20220209T120612_041836_04FAF5_rtc"
- type "application/geo+json"
4
- rel "license"
- href "https://sentinel.esa.int/documents/247904/690755/Sentinel_Data_Legal_Notice"
5
- rel "derived_from"
- href "https://planetarycomputer.microsoft.com/api/stac/v1/collections/sentinel-1-grd/items/S1A_IW_GRDH_1SDV_20220209T120547_20220209T120612_041836_04FAF5"
- type "application/json"
- title "Sentinel 1 GRD Item"
6
- rel "preview"
- href "https://planetarycomputer.microsoft.com/api/data/v1/item/map?collection=sentinel-1-rtc&item=S1A_IW_GRDH_1SDV_20220209T120547_20220209T120612_041836_04FAF5_rtc"
- type "text/html"
- title "Map of item"
assets
vh
- href "https://sentinel1euwestrtc.blob.core.windows.net/sentinel1-grd-rtc/GRD/2022/2/9/IW/DV/S1A_IW_GRDH_1SDV_20220209T120547_20220209T120612_041836_04FAF5_94BF/measurement/iw-vh.rtc.tiff"
- type "image/tiff; application=geotiff; profile=cloud-optimized"
- title "VH: vertical transmit, horizontal receive"
- description "Terrain-corrected gamma naught values of signal transmitted with vertical polarization and received with horizontal polarization with radiometric terrain correction applied."
- file:size 1851372280
- file:checksum "92599c4474baed6136c0dc3d26dea1f5"
raster:bands [] 1 items
0
- nodata -32768
- data_type "float32"
- spatial_resolution 10.0
roles [] 1 items
- 0 "data"
vv
- href "https://sentinel1euwestrtc.blob.core.windows.net/sentinel1-grd-rtc/GRD/2022/2/9/IW/DV/S1A_IW_GRDH_1SDV_20220209T120547_20220209T120612_041836_04FAF5_94BF/measurement/iw-vv.rtc.tiff"
- type "image/tiff; application=geotiff; profile=cloud-optimized"
- title "VV: vertical transmit, vertical receive"
- description "Terrain-corrected gamma naught values of signal transmitted with vertical polarization and received with vertical polarization with radiometric terrain correction applied."
- file:size 1858250597
- file:checksum "c80fd4b6edeac5c108bafcc366a7a671"
raster:bands [] 1 items
0
- nodata -32768
- data_type "float32"
- spatial_resolution 10.0
roles [] 1 items
- 0 "data"
tilejson
- href "https://planetarycomputer.microsoft.com/api/data/v1/item/tilejson.json?collection=sentinel-1-rtc&item=S1A_IW_GRDH_1SDV_20220209T120547_20220209T120612_041836_04FAF5_rtc&assets=vv&assets=vh&tile_format=png&expression=0.03+%2B+log+%2810e-4+-+log+%280.05+%2F+%280.02+%2B+2+%2A+vv%29%29%29%3B0.05+%2B+exp+%280.25+%2A+%28log+%280.01+%2B+2+%2A+vv%29+%2B+log+%280.02+%2B+5+%2A+vh%29%29%29%3B1+-+log+%280.05+%2F+%280.045+-+0.9+%2A+vv%29%29&asset_as_band=True&rescale=0%2C.8000&rescale=0%2C1.000&rescale=0%2C1.000&format=png"
- type "application/json"
- title "TileJSON with default rendering"
roles [] 1 items
- 0 "tiles"
rendered_preview
- href "https://planetarycomputer.microsoft.com/api/data/v1/item/preview.png?collection=sentinel-1-rtc&item=S1A_IW_GRDH_1SDV_20220209T120547_20220209T120612_041836_04FAF5_rtc&assets=vv&assets=vh&tile_format=png&expression=0.03+%2B+log+%2810e-4+-+log+%280.05+%2F+%280.02+%2B+2+%2A+vv%29%29%29%3B0.05+%2B+exp+%280.25+%2A+%28log+%280.01+%2B+2+%2A+vv%29+%2B+log+%280.02+%2B+5+%2A+vh%29%29%29%3B1+-+log+%280.05+%2F+%280.045+-+0.9+%2A+vv%29%29&asset_as_band=True&rescale=0%2C.8000&rescale=0%2C1.000&rescale=0%2C1.000&format=png"
- type "image/png"
- title "Rendered preview"
- rel "preview"
roles [] 1 items
- 0 "overview"
bbox [] 4 items
- 0 88.21707007
- 1 26.75942873
- 2 90.99323449
- 3 28.6817524
stac_extensions [] 6 items
- 0 "https://stac-extensions.github.io/sar/v1.0.0/schema.json"
- 1 "https://stac-extensions.github.io/sat/v1.0.0/schema.json"
- 2 "https://stac-extensions.github.io/eo/v1.0.0/schema.json"
- 3 "https://stac-extensions.github.io/projection/v1.0.0/schema.json"
- 4 "https://stac-extensions.github.io/file/v2.0.0/schema.json"
- 5 "https://stac-extensions.github.io/raster/v1.1.0/schema.json"
- collection "sentinel-1-rtc"
42
- type "Feature"
- stac_version "1.0.0"
- id "S1A_IW_GRDH_1SDV_20220205T000313_20220205T000338_041770_04F88B_rtc"
properties
- datetime "2022-02-05T00:03:25.849186Z"
- platform "SENTINEL-1A"
s1:shape [] 2 items
- 0 27528
- 1 21083
proj:bbox [] 4 items
- 0 524550.0
- 1 2980860.0
- 2 799830.0
- 3 3191690.0
- proj:epsg 32645
proj:shape [] 2 items
- 0 21083
- 1 27528
- end_datetime "2022-02-05 00:03:38.348647+00:00"
- constellation "Sentinel-1"
- s1:resolution "high"
proj:transform [] 9 items
- 0 10.0
- 1 0.0
- 2 524550.0
- 3 0.0
- 4 -10.0
- 5 3191690.0
- 6 0.0
- 7 0.0
- 8 1.0
- s1:datatake_id "325771"
- start_datetime "2022-02-05 00:03:13.349725+00:00"
- s1:orbit_source "RESORB"
- s1:slice_number "12"
- s1:total_slices "17"
- sar:looks_range 5
- sat:orbit_state "descending"
- sar:product_type "GRD"
- sar:looks_azimuth 1
sar:polarizations [] 2 items
- 0 "VV"
- 1 "VH"
- sar:frequency_band "C"
- sat:absolute_orbit 41770
- sat:relative_orbit 48
- s1:processing_level "1"
- sar:instrument_mode "IW"
- sar:center_frequency 5.405
- sar:resolution_range 20
- s1:product_timeliness "Fast-24h"
- sar:resolution_azimuth 22
- sar:pixel_spacing_range 10
- sar:observation_direction "right"
- sar:pixel_spacing_azimuth 10
- sar:looks_equivalent_number 4.4
- s1:instrument_configuration_ID "7"
- sat:platform_international_designator "2014-016A"
geometry
- type "Polygon"
coordinates [] 1 items
0 [] 16 items
0 [] 2 items
- 0 89.8053209
- 1 27.0228171
1 [] 2 items
- 0 89.8298003
- 1 27.2748057
2 [] 2 items
- 0 89.9034657
- 1 27.4281928
3 [] 2 items
- 0 89.9234852
- 1 27.6384174
4 [] 2 items
- 0 89.9532258
- 1 27.6783807
5 [] 2 items
- 0 89.9319176
- 1 27.8512225
6 [] 2 items
- 0 89.9455038
- 1 27.9518743
7 [] 2 items
- 0 89.9883053
- 1 28.0010142
8 [] 2 items
- 0 89.9858697
- 1 28.188419
9 [] 2 items
- 0 90.0500619
- 1 28.4419472
10 [] 2 items
- 0 87.5588415
- 1 28.8403841
11 [] 2 items
- 0 87.4263034
- 1 28.1943467
12 [] 2 items
- 0 87.3059924
- 1 27.3301919
13 [] 2 items
- 0 89.7850783
- 1 26.9228911
14 [] 2 items
- 0 89.7783336
- 1 26.9946165
15 [] 2 items
- 0 89.8053209
- 1 27.0228171
links [] 7 items
0
- rel "collection"
- href "https://planetarycomputer.microsoft.com/api/stac/v1/collections/sentinel-1-rtc"
- type "application/json"
1
- rel "parent"
- href "https://planetarycomputer.microsoft.com/api/stac/v1/collections/sentinel-1-rtc"
- type "application/json"
2
- rel "root"
- href "https://planetarycomputer.microsoft.com/api/stac/v1"
- type "application/json"
- title "Microsoft Planetary Computer STAC API"
3
- rel "self"
- href "https://planetarycomputer.microsoft.com/api/stac/v1/collections/sentinel-1-rtc/items/S1A_IW_GRDH_1SDV_20220205T000313_20220205T000338_041770_04F88B_rtc"
- type "application/geo+json"
4
- rel "license"
- href "https://sentinel.esa.int/documents/247904/690755/Sentinel_Data_Legal_Notice"
5
- rel "derived_from"
- href "https://planetarycomputer.microsoft.com/api/stac/v1/collections/sentinel-1-grd/items/S1A_IW_GRDH_1SDV_20220205T000313_20220205T000338_041770_04F88B"
- type "application/json"
- title "Sentinel 1 GRD Item"
6
- rel "preview"
- href "https://planetarycomputer.microsoft.com/api/data/v1/item/map?collection=sentinel-1-rtc&item=S1A_IW_GRDH_1SDV_20220205T000313_20220205T000338_041770_04F88B_rtc"
- type "text/html"
- title "Map of item"
assets
vh
- href "https://sentinel1euwestrtc.blob.core.windows.net/sentinel1-grd-rtc/GRD/2022/2/5/IW/DV/S1A_IW_GRDH_1SDV_20220205T000313_20220205T000338_041770_04F88B_FCF7/measurement/iw-vh.rtc.tiff"
- type "image/tiff; application=geotiff; profile=cloud-optimized"
- title "VH: vertical transmit, horizontal receive"
- description "Terrain-corrected gamma naught values of signal transmitted with vertical polarization and received with horizontal polarization with radiometric terrain correction applied."
- file:size 1842118322
- file:checksum "e2ee6bf5beaebcb7ac687208de1d51ed"
raster:bands [] 1 items
0
- nodata -32768
- data_type "float32"
- spatial_resolution 10.0
roles [] 1 items
- 0 "data"
vv
- href "https://sentinel1euwestrtc.blob.core.windows.net/sentinel1-grd-rtc/GRD/2022/2/5/IW/DV/S1A_IW_GRDH_1SDV_20220205T000313_20220205T000338_041770_04F88B_FCF7/measurement/iw-vv.rtc.tiff"
- type "image/tiff; application=geotiff; profile=cloud-optimized"
- title "VV: vertical transmit, vertical receive"
- description "Terrain-corrected gamma naught values of signal transmitted with vertical polarization and received with vertical polarization with radiometric terrain correction applied."
- file:size 1849058352
- file:checksum "83809e01973feea61e5167d4e6591b8f"
raster:bands [] 1 items
0
- nodata -32768
- data_type "float32"
- spatial_resolution 10.0
roles [] 1 items
- 0 "data"
tilejson
- href "https://planetarycomputer.microsoft.com/api/data/v1/item/tilejson.json?collection=sentinel-1-rtc&item=S1A_IW_GRDH_1SDV_20220205T000313_20220205T000338_041770_04F88B_rtc&assets=vv&assets=vh&tile_format=png&expression=0.03+%2B+log+%2810e-4+-+log+%280.05+%2F+%280.02+%2B+2+%2A+vv%29%29%29%3B0.05+%2B+exp+%280.25+%2A+%28log+%280.01+%2B+2+%2A+vv%29+%2B+log+%280.02+%2B+5+%2A+vh%29%29%29%3B1+-+log+%280.05+%2F+%280.045+-+0.9+%2A+vv%29%29&asset_as_band=True&rescale=0%2C.8000&rescale=0%2C1.000&rescale=0%2C1.000&format=png"
- type "application/json"
- title "TileJSON with default rendering"
roles [] 1 items
- 0 "tiles"
rendered_preview
- href "https://planetarycomputer.microsoft.com/api/data/v1/item/preview.png?collection=sentinel-1-rtc&item=S1A_IW_GRDH_1SDV_20220205T000313_20220205T000338_041770_04F88B_rtc&assets=vv&assets=vh&tile_format=png&expression=0.03+%2B+log+%2810e-4+-+log+%280.05+%2F+%280.02+%2B+2+%2A+vv%29%29%29%3B0.05+%2B+exp+%280.25+%2A+%28log+%280.01+%2B+2+%2A+vv%29+%2B+log+%280.02+%2B+5+%2A+vh%29%29%29%3B1+-+log+%280.05+%2F+%280.045+-+0.9+%2A+vv%29%29&asset_as_band=True&rescale=0%2C.8000&rescale=0%2C1.000&rescale=0%2C1.000&format=png"
- type "image/png"
- title "Rendered preview"
- rel "preview"
roles [] 1 items
- 0 "overview"
bbox [] 4 items
- 0 87.30599236
- 1 26.92289114
- 2 90.05006191
- 3 28.84038412
stac_extensions [] 6 items
- 0 "https://stac-extensions.github.io/sar/v1.0.0/schema.json"
- 1 "https://stac-extensions.github.io/sat/v1.0.0/schema.json"
- 2 "https://stac-extensions.github.io/eo/v1.0.0/schema.json"
- 3 "https://stac-extensions.github.io/projection/v1.0.0/schema.json"
- 4 "https://stac-extensions.github.io/file/v2.0.0/schema.json"
- 5 "https://stac-extensions.github.io/raster/v1.1.0/schema.json"
- collection "sentinel-1-rtc"
43
- type "Feature"
- stac_version "1.0.0"
- id "S1A_IW_GRDH_1SDV_20220202T121354_20220202T121419_041734_04F754_rtc"
properties
- datetime "2022-02-02T12:14:07.057390Z"
- platform "SENTINEL-1A"
s1:shape [] 2 items
- 0 28247
- 1 21600
proj:bbox [] 4 items
- 0 420990.0
- 1 2916200.0
- 2 703460.0
- 3 3132200.0
- proj:epsg 32645
proj:shape [] 2 items
- 0 21600
- 1 28247
- end_datetime "2022-02-02 12:14:19.557243+00:00"
- constellation "Sentinel-1"
- s1:resolution "high"
proj:transform [] 9 items
- 0 10.0
- 1 0.0
- 2 420990.0
- 3 0.0
- 4 -10.0
- 5 3132200.0
- 6 0.0
- 7 0.0
- 8 1.0
- s1:datatake_id "325460"
- start_datetime "2022-02-02 12:13:54.557538+00:00"
- s1:orbit_source "PREORB"
- s1:slice_number "6"
- s1:total_slices "20"
- sar:looks_range 5
- sat:orbit_state "ascending"
- sar:product_type "GRD"
- sar:looks_azimuth 1
sar:polarizations [] 2 items
- 0 "VV"
- 1 "VH"
- sar:frequency_band "C"
- sat:absolute_orbit 41734
- sat:relative_orbit 12
- s1:processing_level "1"
- sar:instrument_mode "IW"
- sar:center_frequency 5.405
- sar:resolution_range 20
- s1:product_timeliness "Fast-24h"
- sar:resolution_azimuth 22
- sar:pixel_spacing_range 10
- sar:observation_direction "right"
- sar:pixel_spacing_azimuth 10
- sar:looks_equivalent_number 4.4
- s1:instrument_configuration_ID "7"
- sat:platform_international_designator "2014-016A"
geometry
- type "Polygon"
coordinates [] 1 items
0 [] 18 items
0 [] 2 items
- 0 87.8660391
- 1 26.5975205
1 [] 2 items
- 0 88.9858736
- 1 26.7767902
2 [] 2 items
- 0 88.9233578
- 1 27.3282099
3 [] 2 items
- 0 88.7395771
- 1 28.2894094
4 [] 2 items
- 0 86.2113819
- 1 27.8814507
5 [] 2 items
- 0 86.2046761
- 1 27.8467937
6 [] 2 items
- 0 86.2107139
- 1 27.7842709
7 [] 2 items
- 0 86.2352954
- 1 27.7816107
8 [] 2 items
- 0 86.2175146
- 1 27.7558741
9 [] 2 items
- 0 86.2721888
- 1 27.6977664
10 [] 2 items
- 0 86.2790906
- 1 27.4645337
11 [] 2 items
- 0 86.3291093
- 1 27.3770344
12 [] 2 items
- 0 86.3148608
- 1 27.309618
13 [] 2 items
- 0 86.3430187
- 1 27.2819473
14 [] 2 items
- 0 86.3194751
- 1 27.2323619
15 [] 2 items
- 0 86.3732376
- 1 27.0818439
16 [] 2 items
- 0 86.5000802
- 1 26.3663279
17 [] 2 items
- 0 87.8660391
- 1 26.5975205
links [] 7 items
0
- rel "collection"
- href "https://planetarycomputer.microsoft.com/api/stac/v1/collections/sentinel-1-rtc"
- type "application/json"
1
- rel "parent"
- href "https://planetarycomputer.microsoft.com/api/stac/v1/collections/sentinel-1-rtc"
- type "application/json"
2
- rel "root"
- href "https://planetarycomputer.microsoft.com/api/stac/v1"
- type "application/json"
- title "Microsoft Planetary Computer STAC API"
3
- rel "self"
- href "https://planetarycomputer.microsoft.com/api/stac/v1/collections/sentinel-1-rtc/items/S1A_IW_GRDH_1SDV_20220202T121354_20220202T121419_041734_04F754_rtc"
- type "application/geo+json"
4
- rel "license"
- href "https://sentinel.esa.int/documents/247904/690755/Sentinel_Data_Legal_Notice"
5
- rel "derived_from"
- href "https://planetarycomputer.microsoft.com/api/stac/v1/collections/sentinel-1-grd/items/S1A_IW_GRDH_1SDV_20220202T121354_20220202T121419_041734_04F754"
- type "application/json"
- title "Sentinel 1 GRD Item"
6
- rel "preview"
- href "https://planetarycomputer.microsoft.com/api/data/v1/item/map?collection=sentinel-1-rtc&item=S1A_IW_GRDH_1SDV_20220202T121354_20220202T121419_041734_04F754_rtc"
- type "text/html"
- title "Map of item"
assets
vh
- href "https://sentinel1euwestrtc.blob.core.windows.net/sentinel1-grd-rtc/GRD/2022/2/2/IW/DV/S1A_IW_GRDH_1SDV_20220202T121354_20220202T121419_041734_04F754_02D7/measurement/iw-vh.rtc.tiff"
- type "image/tiff; application=geotiff; profile=cloud-optimized"
- title "VH: vertical transmit, horizontal receive"
- description "Terrain-corrected gamma naught values of signal transmitted with vertical polarization and received with horizontal polarization with radiometric terrain correction applied."
- file:size 1872347120
- file:checksum "72884db8a2f2ae5005c58d246b3bf59e"
raster:bands [] 1 items
0
- nodata -32768
- data_type "float32"
- spatial_resolution 10.0
roles [] 1 items
- 0 "data"
vv
- href "https://sentinel1euwestrtc.blob.core.windows.net/sentinel1-grd-rtc/GRD/2022/2/2/IW/DV/S1A_IW_GRDH_1SDV_20220202T121354_20220202T121419_041734_04F754_02D7/measurement/iw-vv.rtc.tiff"
- type "image/tiff; application=geotiff; profile=cloud-optimized"
- title "VV: vertical transmit, vertical receive"
- description "Terrain-corrected gamma naught values of signal transmitted with vertical polarization and received with vertical polarization with radiometric terrain correction applied."
- file:size 1879106636
- file:checksum "d6f16e1ecb8e42f53d0152bdac3ccc24"
raster:bands [] 1 items
0
- nodata -32768
- data_type "float32"
- spatial_resolution 10.0
roles [] 1 items
- 0 "data"
tilejson
- href "https://planetarycomputer.microsoft.com/api/data/v1/item/tilejson.json?collection=sentinel-1-rtc&item=S1A_IW_GRDH_1SDV_20220202T121354_20220202T121419_041734_04F754_rtc&assets=vv&assets=vh&tile_format=png&expression=0.03+%2B+log+%2810e-4+-+log+%280.05+%2F+%280.02+%2B+2+%2A+vv%29%29%29%3B0.05+%2B+exp+%280.25+%2A+%28log+%280.01+%2B+2+%2A+vv%29+%2B+log+%280.02+%2B+5+%2A+vh%29%29%29%3B1+-+log+%280.05+%2F+%280.045+-+0.9+%2A+vv%29%29&asset_as_band=True&rescale=0%2C.8000&rescale=0%2C1.000&rescale=0%2C1.000&format=png"
- type "application/json"
- title "TileJSON with default rendering"
roles [] 1 items
- 0 "tiles"
rendered_preview
- href "https://planetarycomputer.microsoft.com/api/data/v1/item/preview.png?collection=sentinel-1-rtc&item=S1A_IW_GRDH_1SDV_20220202T121354_20220202T121419_041734_04F754_rtc&assets=vv&assets=vh&tile_format=png&expression=0.03+%2B+log+%2810e-4+-+log+%280.05+%2F+%280.02+%2B+2+%2A+vv%29%29%29%3B0.05+%2B+exp+%280.25+%2A+%28log+%280.01+%2B+2+%2A+vv%29+%2B+log+%280.02+%2B+5+%2A+vh%29%29%29%3B1+-+log+%280.05+%2F+%280.045+-+0.9+%2A+vv%29%29&asset_as_band=True&rescale=0%2C.8000&rescale=0%2C1.000&rescale=0%2C1.000&format=png"
- type "image/png"
- title "Rendered preview"
- rel "preview"
roles [] 1 items
- 0 "overview"
bbox [] 4 items
- 0 86.2046761
- 1 26.36632788
- 2 88.98587362
- 3 28.28940941
stac_extensions [] 6 items
- 0 "https://stac-extensions.github.io/sar/v1.0.0/schema.json"
- 1 "https://stac-extensions.github.io/sat/v1.0.0/schema.json"
- 2 "https://stac-extensions.github.io/eo/v1.0.0/schema.json"
- 3 "https://stac-extensions.github.io/projection/v1.0.0/schema.json"
- 4 "https://stac-extensions.github.io/file/v2.0.0/schema.json"
- 5 "https://stac-extensions.github.io/raster/v1.1.0/schema.json"
- collection "sentinel-1-rtc"
44
- type "Feature"
- stac_version "1.0.0"
- id "S1A_IW_GRDH_1SDV_20220128T120547_20220128T120612_041661_04F4D6_rtc"
properties
- datetime "2022-01-28T12:06:00.352862Z"
- platform "SENTINEL-1A"
s1:shape [] 2 items
- 0 28427
- 1 21971
proj:bbox [] 4 items
- 0 618210.0
- 1 2960430.0
- 2 902480.0
- 3 3180140.0
- proj:epsg 32645
proj:shape [] 2 items
- 0 21971
- 1 28427
- end_datetime "2022-01-28 12:06:12.852033+00:00"
- constellation "Sentinel-1"
- s1:resolution "high"
proj:transform [] 9 items
- 0 10.0
- 1 0.0
- 2 618210.0
- 3 0.0
- 4 -10.0
- 5 3180140.0
- 6 0.0
- 7 0.0
- 8 1.0
- s1:datatake_id "324822"
- start_datetime "2022-01-28 12:05:47.853690+00:00"
- s1:orbit_source "PREORB"
- s1:slice_number "6"
- s1:total_slices "21"
- sar:looks_range 5
- sat:orbit_state "ascending"
- sar:product_type "GRD"
- sar:looks_azimuth 1
sar:polarizations [] 2 items
- 0 "VV"
- 1 "VH"
- sar:frequency_band "C"
- sat:absolute_orbit 41661
- sat:relative_orbit 114
- s1:processing_level "1"
- sar:instrument_mode "IW"
- sar:center_frequency 5.405
- sar:resolution_range 20
- s1:product_timeliness "Fast-24h"
- sar:resolution_azimuth 22
- sar:pixel_spacing_range 10
- sar:observation_direction "right"
- sar:pixel_spacing_azimuth 10
- sar:looks_equivalent_number 4.4
- s1:instrument_configuration_ID "7"
- sat:platform_international_designator "2014-016A"
geometry
- type "Polygon"
coordinates [] 1 items
0 [] 14 items
0 [] 2 items
- 0 89.9824432
- 1 27.0124981
1 [] 2 items
- 0 90.9938387
- 1 27.1728312
2 [] 2 items
- 0 90.7249506
- 1 28.6817327
3 [] 2 items
- 0 88.2177837
- 1 28.2796713
4 [] 2 items
- 0 88.3554765
- 1 27.7231928
5 [] 2 items
- 0 88.3300589
- 1 27.584253
6 [] 2 items
- 0 88.3765952
- 1 27.5223298
7 [] 2 items
- 0 88.3583953
- 1 27.4087745
8 [] 2 items
- 0 88.4006715
- 1 27.3364147
9 [] 2 items
- 0 88.3793303
- 1 27.3025965
10 [] 2 items
- 0 88.4162071
- 1 27.2065453
11 [] 2 items
- 0 88.4044448
- 1 27.0894956
12 [] 2 items
- 0 88.4755317
- 1 26.7595106
13 [] 2 items
- 0 89.9824432
- 1 27.0124981
links [] 7 items
0
- rel "collection"
- href "https://planetarycomputer.microsoft.com/api/stac/v1/collections/sentinel-1-rtc"
- type "application/json"
1
- rel "parent"
- href "https://planetarycomputer.microsoft.com/api/stac/v1/collections/sentinel-1-rtc"
- type "application/json"
2
- rel "root"
- href "https://planetarycomputer.microsoft.com/api/stac/v1"
- type "application/json"
- title "Microsoft Planetary Computer STAC API"
3
- rel "self"
- href "https://planetarycomputer.microsoft.com/api/stac/v1/collections/sentinel-1-rtc/items/S1A_IW_GRDH_1SDV_20220128T120547_20220128T120612_041661_04F4D6_rtc"
- type "application/geo+json"
4
- rel "license"
- href "https://sentinel.esa.int/documents/247904/690755/Sentinel_Data_Legal_Notice"
5
- rel "derived_from"
- href "https://planetarycomputer.microsoft.com/api/stac/v1/collections/sentinel-1-grd/items/S1A_IW_GRDH_1SDV_20220128T120547_20220128T120612_041661_04F4D6"
- type "application/json"
- title "Sentinel 1 GRD Item"
6
- rel "preview"
- href "https://planetarycomputer.microsoft.com/api/data/v1/item/map?collection=sentinel-1-rtc&item=S1A_IW_GRDH_1SDV_20220128T120547_20220128T120612_041661_04F4D6_rtc"
- type "text/html"
- title "Map of item"
assets
vh
- href "https://sentinel1euwestrtc.blob.core.windows.net/sentinel1-grd-rtc/GRD/2022/1/28/IW/DV/S1A_IW_GRDH_1SDV_20220128T120547_20220128T120612_041661_04F4D6_7A17/measurement/iw-vh.rtc.tiff"
- type "image/tiff; application=geotiff; profile=cloud-optimized"
- title "VH: vertical transmit, horizontal receive"
- description "Terrain-corrected gamma naught values of signal transmitted with vertical polarization and received with horizontal polarization with radiometric terrain correction applied."
- file:size 1853333353
- file:checksum "eb41e71abec8b34022d5c08407dcd8ca"
raster:bands [] 1 items
0
- nodata -32768
- data_type "float32"
- spatial_resolution 10.0
roles [] 1 items
- 0 "data"
vv
- href "https://sentinel1euwestrtc.blob.core.windows.net/sentinel1-grd-rtc/GRD/2022/1/28/IW/DV/S1A_IW_GRDH_1SDV_20220128T120547_20220128T120612_041661_04F4D6_7A17/measurement/iw-vv.rtc.tiff"
- type "image/tiff; application=geotiff; profile=cloud-optimized"
- title "VV: vertical transmit, vertical receive"
- description "Terrain-corrected gamma naught values of signal transmitted with vertical polarization and received with vertical polarization with radiometric terrain correction applied."
- file:size 1859894605
- file:checksum "5f7c6bd25e36060ab6534870c3d624c1"
raster:bands [] 1 items
0
- nodata -32768
- data_type "float32"
- spatial_resolution 10.0
roles [] 1 items
- 0 "data"
tilejson
- href "https://planetarycomputer.microsoft.com/api/data/v1/item/tilejson.json?collection=sentinel-1-rtc&item=S1A_IW_GRDH_1SDV_20220128T120547_20220128T120612_041661_04F4D6_rtc&assets=vv&assets=vh&tile_format=png&expression=0.03+%2B+log+%2810e-4+-+log+%280.05+%2F+%280.02+%2B+2+%2A+vv%29%29%29%3B0.05+%2B+exp+%280.25+%2A+%28log+%280.01+%2B+2+%2A+vv%29+%2B+log+%280.02+%2B+5+%2A+vh%29%29%29%3B1+-+log+%280.05+%2F+%280.045+-+0.9+%2A+vv%29%29&asset_as_band=True&rescale=0%2C.8000&rescale=0%2C1.000&rescale=0%2C1.000&format=png"
- type "application/json"
- title "TileJSON with default rendering"
roles [] 1 items
- 0 "tiles"
rendered_preview
- href "https://planetarycomputer.microsoft.com/api/data/v1/item/preview.png?collection=sentinel-1-rtc&item=S1A_IW_GRDH_1SDV_20220128T120547_20220128T120612_041661_04F4D6_rtc&assets=vv&assets=vh&tile_format=png&expression=0.03+%2B+log+%2810e-4+-+log+%280.05+%2F+%280.02+%2B+2+%2A+vv%29%29%29%3B0.05+%2B+exp+%280.25+%2A+%28log+%280.01+%2B+2+%2A+vv%29+%2B+log+%280.02+%2B+5+%2A+vh%29%29%29%3B1+-+log+%280.05+%2F+%280.045+-+0.9+%2A+vv%29%29&asset_as_band=True&rescale=0%2C.8000&rescale=0%2C1.000&rescale=0%2C1.000&format=png"
- type "image/png"
- title "Rendered preview"
- rel "preview"
roles [] 1 items
- 0 "overview"
bbox [] 4 items
- 0 88.21778371
- 1 26.75951062
- 2 90.99383869
- 3 28.6817327
stac_extensions [] 6 items
- 0 "https://stac-extensions.github.io/sar/v1.0.0/schema.json"
- 1 "https://stac-extensions.github.io/sat/v1.0.0/schema.json"
- 2 "https://stac-extensions.github.io/eo/v1.0.0/schema.json"
- 3 "https://stac-extensions.github.io/projection/v1.0.0/schema.json"
- 4 "https://stac-extensions.github.io/file/v2.0.0/schema.json"
- 5 "https://stac-extensions.github.io/raster/v1.1.0/schema.json"
- collection "sentinel-1-rtc"
45
- type "Feature"
- stac_version "1.0.0"
- id "S1A_IW_GRDH_1SDV_20220124T000313_20220124T000338_041595_04F294_rtc"
properties
- datetime "2022-01-24T00:03:26.424832Z"
- platform "SENTINEL-1A"
s1:shape [] 2 items
- 0 27529
- 1 21082
proj:bbox [] 4 items
- 0 524550.0
- 1 2980870.0
- 2 799840.0
- 3 3191690.0
- proj:epsg 32645
proj:shape [] 2 items
- 0 21082
- 1 27529
- end_datetime "2022-01-24 00:03:38.923599+00:00"
- constellation "Sentinel-1"
- s1:resolution "high"
proj:transform [] 9 items
- 0 10.0
- 1 0.0
- 2 524550.0
- 3 0.0
- 4 -10.0
- 5 3191690.0
- 6 0.0
- 7 0.0
- 8 1.0
- s1:datatake_id "324244"
- start_datetime "2022-01-24 00:03:13.926064+00:00"
- s1:orbit_source "RESORB"
- s1:slice_number "12"
- s1:total_slices "17"
- sar:looks_range 5
- sat:orbit_state "descending"
- sar:product_type "GRD"
- sar:looks_azimuth 1
sar:polarizations [] 2 items
- 0 "VV"
- 1 "VH"
- sar:frequency_band "C"
- sat:absolute_orbit 41595
- sat:relative_orbit 48
- s1:processing_level "1"
- sar:instrument_mode "IW"
- sar:center_frequency 5.405
- sar:resolution_range 20
- s1:product_timeliness "Fast-24h"
- sar:resolution_azimuth 22
- sar:pixel_spacing_range 10
- sar:observation_direction "right"
- sar:pixel_spacing_azimuth 10
- sar:looks_equivalent_number 4.4
- s1:instrument_configuration_ID "7"
- sat:platform_international_designator "2014-016A"
geometry
- type "Polygon"
coordinates [] 1 items
0 [] 16 items
0 [] 2 items
- 0 89.8054104
- 1 27.0223642
1 [] 2 items
- 0 89.829899
- 1 27.2747135
2 [] 2 items
- 0 89.9036725
- 1 27.4283689
3 [] 2 items
- 0 89.9235912
- 1 27.6385956
4 [] 2 items
- 0 89.9533295
- 1 27.6784687
5 [] 2 items
- 0 89.9320214
- 1 27.8513105
6 [] 2 items
- 0 89.9456054
- 1 27.9518721
7 [] 2 items
- 0 89.9885085
- 1 28.0010098
8 [] 2 items
- 0 89.9860707
- 1 28.1883244
9 [] 2 items
- 0 90.0502633
- 1 28.4418525
10 [] 2 items
- 0 87.558944
- 1 28.8403837
11 [] 2 items
- 0 87.426406
- 1 28.194527
12 [] 2 items
- 0 87.3060967
- 1 27.3313653
13 [] 2 items
- 0 89.7850805
- 1 26.9229813
14 [] 2 items
- 0 89.7784299
- 1 26.9944342
15 [] 2 items
- 0 89.8054104
- 1 27.0223642
links [] 7 items
0
- rel "collection"
- href "https://planetarycomputer.microsoft.com/api/stac/v1/collections/sentinel-1-rtc"
- type "application/json"
1
- rel "parent"
- href "https://planetarycomputer.microsoft.com/api/stac/v1/collections/sentinel-1-rtc"
- type "application/json"
2
- rel "root"
- href "https://planetarycomputer.microsoft.com/api/stac/v1"
- type "application/json"
- title "Microsoft Planetary Computer STAC API"
3
- rel "self"
- href "https://planetarycomputer.microsoft.com/api/stac/v1/collections/sentinel-1-rtc/items/S1A_IW_GRDH_1SDV_20220124T000313_20220124T000338_041595_04F294_rtc"
- type "application/geo+json"
4
- rel "license"
- href "https://sentinel.esa.int/documents/247904/690755/Sentinel_Data_Legal_Notice"
5
- rel "derived_from"
- href "https://planetarycomputer.microsoft.com/api/stac/v1/collections/sentinel-1-grd/items/S1A_IW_GRDH_1SDV_20220124T000313_20220124T000338_041595_04F294"
- type "application/json"
- title "Sentinel 1 GRD Item"
6
- rel "preview"
- href "https://planetarycomputer.microsoft.com/api/data/v1/item/map?collection=sentinel-1-rtc&item=S1A_IW_GRDH_1SDV_20220124T000313_20220124T000338_041595_04F294_rtc"
- type "text/html"
- title "Map of item"
assets
vh
- href "https://sentinel1euwestrtc.blob.core.windows.net/sentinel1-grd-rtc/GRD/2022/1/24/IW/DV/S1A_IW_GRDH_1SDV_20220124T000313_20220124T000338_041595_04F294_E282/measurement/iw-vh.rtc.tiff"
- type "image/tiff; application=geotiff; profile=cloud-optimized"
- title "VH: vertical transmit, horizontal receive"
- description "Terrain-corrected gamma naught values of signal transmitted with vertical polarization and received with horizontal polarization with radiometric terrain correction applied."
- file:size 1842024465
- file:checksum "2aec57660de0785cec98fefd04c3107e"
raster:bands [] 1 items
0
- nodata -32768
- data_type "float32"
- spatial_resolution 10.0
roles [] 1 items
- 0 "data"
vv
- href "https://sentinel1euwestrtc.blob.core.windows.net/sentinel1-grd-rtc/GRD/2022/1/24/IW/DV/S1A_IW_GRDH_1SDV_20220124T000313_20220124T000338_041595_04F294_E282/measurement/iw-vv.rtc.tiff"
- type "image/tiff; application=geotiff; profile=cloud-optimized"
- title "VV: vertical transmit, vertical receive"
- description "Terrain-corrected gamma naught values of signal transmitted with vertical polarization and received with vertical polarization with radiometric terrain correction applied."
- file:size 1848146005
- file:checksum "962c8d5938cbf737f0ac1d584fae5d3b"
raster:bands [] 1 items
0
- nodata -32768
- data_type "float32"
- spatial_resolution 10.0
roles [] 1 items
- 0 "data"
tilejson
- href "https://planetarycomputer.microsoft.com/api/data/v1/item/tilejson.json?collection=sentinel-1-rtc&item=S1A_IW_GRDH_1SDV_20220124T000313_20220124T000338_041595_04F294_rtc&assets=vv&assets=vh&tile_format=png&expression=0.03+%2B+log+%2810e-4+-+log+%280.05+%2F+%280.02+%2B+2+%2A+vv%29%29%29%3B0.05+%2B+exp+%280.25+%2A+%28log+%280.01+%2B+2+%2A+vv%29+%2B+log+%280.02+%2B+5+%2A+vh%29%29%29%3B1+-+log+%280.05+%2F+%280.045+-+0.9+%2A+vv%29%29&asset_as_band=True&rescale=0%2C.8000&rescale=0%2C1.000&rescale=0%2C1.000&format=png"
- type "application/json"
- title "TileJSON with default rendering"
roles [] 1 items
- 0 "tiles"
rendered_preview
- href "https://planetarycomputer.microsoft.com/api/data/v1/item/preview.png?collection=sentinel-1-rtc&item=S1A_IW_GRDH_1SDV_20220124T000313_20220124T000338_041595_04F294_rtc&assets=vv&assets=vh&tile_format=png&expression=0.03+%2B+log+%2810e-4+-+log+%280.05+%2F+%280.02+%2B+2+%2A+vv%29%29%29%3B0.05+%2B+exp+%280.25+%2A+%28log+%280.01+%2B+2+%2A+vv%29+%2B+log+%280.02+%2B+5+%2A+vh%29%29%29%3B1+-+log+%280.05+%2F+%280.045+-+0.9+%2A+vv%29%29&asset_as_band=True&rescale=0%2C.8000&rescale=0%2C1.000&rescale=0%2C1.000&format=png"
- type "image/png"
- title "Rendered preview"
- rel "preview"
roles [] 1 items
- 0 "overview"
bbox [] 4 items
- 0 87.30609667
- 1 26.92298132
- 2 90.05026329
- 3 28.8403837
stac_extensions [] 6 items
- 0 "https://stac-extensions.github.io/sar/v1.0.0/schema.json"
- 1 "https://stac-extensions.github.io/sat/v1.0.0/schema.json"
- 2 "https://stac-extensions.github.io/eo/v1.0.0/schema.json"
- 3 "https://stac-extensions.github.io/projection/v1.0.0/schema.json"
- 4 "https://stac-extensions.github.io/file/v2.0.0/schema.json"
- 5 "https://stac-extensions.github.io/raster/v1.1.0/schema.json"
- collection "sentinel-1-rtc"
46
- type "Feature"
- stac_version "1.0.0"
- id "S1A_IW_GRDH_1SDV_20220121T121355_20220121T121420_041559_04F156_rtc"
properties
- datetime "2022-01-21T12:14:07.716165Z"
- platform "SENTINEL-1A"
s1:shape [] 2 items
- 0 28245
- 1 21600
proj:bbox [] 4 items
- 0 420950.0
- 1 2916210.0
- 2 703400.0
- 3 3132210.0
- proj:epsg 32645
proj:shape [] 2 items
- 0 21600
- 1 28245
- end_datetime "2022-01-21 12:14:20.216033+00:00"
- constellation "Sentinel-1"
- s1:resolution "high"
proj:transform [] 9 items
- 0 10.0
- 1 0.0
- 2 420950.0
- 3 0.0
- 4 -10.0
- 5 3132210.0
- 6 0.0
- 7 0.0
- 8 1.0
- s1:datatake_id "323926"
- start_datetime "2022-01-21 12:13:55.216297+00:00"
- s1:orbit_source "PREORB"
- s1:slice_number "6"
- s1:total_slices "20"
- sar:looks_range 5
- sat:orbit_state "ascending"
- sar:product_type "GRD"
- sar:looks_azimuth 1
sar:polarizations [] 2 items
- 0 "VV"
- 1 "VH"
- sar:frequency_band "C"
- sat:absolute_orbit 41559
- sat:relative_orbit 12
- s1:processing_level "1"
- sar:instrument_mode "IW"
- sar:center_frequency 5.405
- sar:resolution_range 20
- s1:product_timeliness "Fast-24h"
- sar:resolution_azimuth 22
- sar:pixel_spacing_range 10
- sar:observation_direction "right"
- sar:pixel_spacing_azimuth 10
- sar:looks_equivalent_number 4.4
- s1:instrument_configuration_ID "7"
- sat:platform_international_designator "2014-016A"
geometry
- type "Polygon"
coordinates [] 1 items
0 [] 16 items
0 [] 2 items
- 0 87.8656381
- 1 26.5976133
1 [] 2 items
- 0 88.9850694
- 1 26.7768015
2 [] 2 items
- 0 88.9226491
- 1 27.3281294
3 [] 2 items
- 0 88.7387631
- 1 28.28951
4 [] 2 items
- 0 86.2109749
- 1 27.8815386
5 [] 2 items
- 0 86.2040668
- 1 27.8467902
6 [] 2 items
- 0 86.2101121
- 1 27.7832745
7 [] 2 items
- 0 86.2347885
- 1 27.7815176
8 [] 2 items
- 0 86.2164966
- 1 27.7563197
9 [] 2 items
- 0 86.2711759
- 1 27.6975806
10 [] 2 items
- 0 86.277775
- 1 27.4645268
11 [] 2 items
- 0 86.3275919
- 1 27.3771174
12 [] 2 items
- 0 86.3188758
- 1 27.2312756
13 [] 2 items
- 0 86.3555358
- 1 27.1612112
14 [] 2 items
- 0 86.4992784
- 1 26.3663251
15 [] 2 items
- 0 87.8656381
- 1 26.5976133
links [] 7 items
0
- rel "collection"
- href "https://planetarycomputer.microsoft.com/api/stac/v1/collections/sentinel-1-rtc"
- type "application/json"
1
- rel "parent"
- href "https://planetarycomputer.microsoft.com/api/stac/v1/collections/sentinel-1-rtc"
- type "application/json"
2
- rel "root"
- href "https://planetarycomputer.microsoft.com/api/stac/v1"
- type "application/json"
- title "Microsoft Planetary Computer STAC API"
3
- rel "self"
- href "https://planetarycomputer.microsoft.com/api/stac/v1/collections/sentinel-1-rtc/items/S1A_IW_GRDH_1SDV_20220121T121355_20220121T121420_041559_04F156_rtc"
- type "application/geo+json"
4
- rel "license"
- href "https://sentinel.esa.int/documents/247904/690755/Sentinel_Data_Legal_Notice"
5
- rel "derived_from"
- href "https://planetarycomputer.microsoft.com/api/stac/v1/collections/sentinel-1-grd/items/S1A_IW_GRDH_1SDV_20220121T121355_20220121T121420_041559_04F156"
- type "application/json"
- title "Sentinel 1 GRD Item"
6
- rel "preview"
- href "https://planetarycomputer.microsoft.com/api/data/v1/item/map?collection=sentinel-1-rtc&item=S1A_IW_GRDH_1SDV_20220121T121355_20220121T121420_041559_04F156_rtc"
- type "text/html"
- title "Map of item"
assets
vh
- href "https://sentinel1euwestrtc.blob.core.windows.net/sentinel1-grd-rtc/GRD/2022/1/21/IW/DV/S1A_IW_GRDH_1SDV_20220121T121355_20220121T121420_041559_04F156_099F/measurement/iw-vh.rtc.tiff"
- type "image/tiff; application=geotiff; profile=cloud-optimized"
- title "VH: vertical transmit, horizontal receive"
- description "Terrain-corrected gamma naught values of signal transmitted with vertical polarization and received with horizontal polarization with radiometric terrain correction applied."
- file:size 1872523101
- file:checksum "a138031b52fa0c6352bfad98af758464"
raster:bands [] 1 items
0
- nodata -32768
- data_type "float32"
- spatial_resolution 10.0
roles [] 1 items
- 0 "data"
vv
- href "https://sentinel1euwestrtc.blob.core.windows.net/sentinel1-grd-rtc/GRD/2022/1/21/IW/DV/S1A_IW_GRDH_1SDV_20220121T121355_20220121T121420_041559_04F156_099F/measurement/iw-vv.rtc.tiff"
- type "image/tiff; application=geotiff; profile=cloud-optimized"
- title "VV: vertical transmit, vertical receive"
- description "Terrain-corrected gamma naught values of signal transmitted with vertical polarization and received with vertical polarization with radiometric terrain correction applied."
- file:size 1878957107
- file:checksum "ea7911b957a3127df74133d08de988a2"
raster:bands [] 1 items
0
- nodata -32768
- data_type "float32"
- spatial_resolution 10.0
roles [] 1 items
- 0 "data"
tilejson
- href "https://planetarycomputer.microsoft.com/api/data/v1/item/tilejson.json?collection=sentinel-1-rtc&item=S1A_IW_GRDH_1SDV_20220121T121355_20220121T121420_041559_04F156_rtc&assets=vv&assets=vh&tile_format=png&expression=0.03+%2B+log+%2810e-4+-+log+%280.05+%2F+%280.02+%2B+2+%2A+vv%29%29%29%3B0.05+%2B+exp+%280.25+%2A+%28log+%280.01+%2B+2+%2A+vv%29+%2B+log+%280.02+%2B+5+%2A+vh%29%29%29%3B1+-+log+%280.05+%2F+%280.045+-+0.9+%2A+vv%29%29&asset_as_band=True&rescale=0%2C.8000&rescale=0%2C1.000&rescale=0%2C1.000&format=png"
- type "application/json"
- title "TileJSON with default rendering"
roles [] 1 items
- 0 "tiles"
rendered_preview
- href "https://planetarycomputer.microsoft.com/api/data/v1/item/preview.png?collection=sentinel-1-rtc&item=S1A_IW_GRDH_1SDV_20220121T121355_20220121T121420_041559_04F156_rtc&assets=vv&assets=vh&tile_format=png&expression=0.03+%2B+log+%2810e-4+-+log+%280.05+%2F+%280.02+%2B+2+%2A+vv%29%29%29%3B0.05+%2B+exp+%280.25+%2A+%28log+%280.01+%2B+2+%2A+vv%29+%2B+log+%280.02+%2B+5+%2A+vh%29%29%29%3B1+-+log+%280.05+%2F+%280.045+-+0.9+%2A+vv%29%29&asset_as_band=True&rescale=0%2C.8000&rescale=0%2C1.000&rescale=0%2C1.000&format=png"
- type "image/png"
- title "Rendered preview"
- rel "preview"
roles [] 1 items
- 0 "overview"
bbox [] 4 items
- 0 86.20406678
- 1 26.36632508
- 2 88.98506936
- 3 28.28951002
stac_extensions [] 6 items
- 0 "https://stac-extensions.github.io/sar/v1.0.0/schema.json"
- 1 "https://stac-extensions.github.io/sat/v1.0.0/schema.json"
- 2 "https://stac-extensions.github.io/eo/v1.0.0/schema.json"
- 3 "https://stac-extensions.github.io/projection/v1.0.0/schema.json"
- 4 "https://stac-extensions.github.io/file/v2.0.0/schema.json"
- 5 "https://stac-extensions.github.io/raster/v1.1.0/schema.json"
- collection "sentinel-1-rtc"
47
- type "Feature"
- stac_version "1.0.0"
- id "S1A_IW_GRDH_1SDV_20220116T120548_20220116T120613_041486_04EEE8_rtc"
properties
- datetime "2022-01-16T12:06:00.877035Z"
- platform "SENTINEL-1A"
s1:shape [] 2 items
- 0 28427
- 1 21971
proj:bbox [] 4 items
- 0 618200.0
- 1 2960430.0
- 2 902470.0
- 3 3180140.0
- proj:epsg 32645
proj:shape [] 2 items
- 0 21971
- 1 28427
- end_datetime "2022-01-16 12:06:13.376211+00:00"
- constellation "Sentinel-1"
- s1:resolution "high"
proj:transform [] 9 items
- 0 10.0
- 1 0.0
- 2 618200.0
- 3 0.0
- 4 -10.0
- 5 3180140.0
- 6 0.0
- 7 0.0
- 8 1.0
- s1:datatake_id "323304"
- start_datetime "2022-01-16 12:05:48.377859+00:00"
- s1:orbit_source "PREORB"
- s1:slice_number "6"
- s1:total_slices "21"
- sar:looks_range 5
- sat:orbit_state "ascending"
- sar:product_type "GRD"
- sar:looks_azimuth 1
sar:polarizations [] 2 items
- 0 "VV"
- 1 "VH"
- sar:frequency_band "C"
- sat:absolute_orbit 41486
- sat:relative_orbit 114
- s1:processing_level "1"
- sar:instrument_mode "IW"
- sar:center_frequency 5.405
- sar:resolution_range 20
- s1:product_timeliness "Fast-24h"
- sar:resolution_azimuth 22
- sar:pixel_spacing_range 10
- sar:observation_direction "right"
- sar:pixel_spacing_azimuth 10
- sar:looks_equivalent_number 4.4
- s1:instrument_configuration_ID "7"
- sat:platform_international_designator "2014-016A"
geometry
- type "Polygon"
coordinates [] 1 items
0 [] 14 items
0 [] 2 items
- 0 89.9825438
- 1 27.012496
1 [] 2 items
- 0 90.9937348
- 1 27.172744
2 [] 2 items
- 0 90.7249506
- 1 28.6817327
3 [] 2 items
- 0 88.2176818
- 1 28.2796722
4 [] 2 items
- 0 88.3552737
- 1 27.7231948
5 [] 2 items
- 0 88.3299576
- 1 27.584254
6 [] 2 items
- 0 88.3764917
- 1 27.5221503
7 [] 2 items
- 0 88.3581952
- 1 27.408957
8 [] 2 items
- 0 88.4005693
- 1 27.3363254
9 [] 2 items
- 0 88.3792304
- 1 27.3026878
10 [] 2 items
- 0 88.4161096
- 1 27.2068171
11 [] 2 items
- 0 88.4043429
- 1 27.0894064
12 [] 2 items
- 0 88.4754312
- 1 26.7595117
13 [] 2 items
- 0 89.9825438
- 1 27.012496
links [] 7 items
0
- rel "collection"
- href "https://planetarycomputer.microsoft.com/api/stac/v1/collections/sentinel-1-rtc"
- type "application/json"
1
- rel "parent"
- href "https://planetarycomputer.microsoft.com/api/stac/v1/collections/sentinel-1-rtc"
- type "application/json"
2
- rel "root"
- href "https://planetarycomputer.microsoft.com/api/stac/v1"
- type "application/json"
- title "Microsoft Planetary Computer STAC API"
3
- rel "self"
- href "https://planetarycomputer.microsoft.com/api/stac/v1/collections/sentinel-1-rtc/items/S1A_IW_GRDH_1SDV_20220116T120548_20220116T120613_041486_04EEE8_rtc"
- type "application/geo+json"
4
- rel "license"
- href "https://sentinel.esa.int/documents/247904/690755/Sentinel_Data_Legal_Notice"
5
- rel "derived_from"
- href "https://planetarycomputer.microsoft.com/api/stac/v1/collections/sentinel-1-grd/items/S1A_IW_GRDH_1SDV_20220116T120548_20220116T120613_041486_04EEE8"
- type "application/json"
- title "Sentinel 1 GRD Item"
6
- rel "preview"
- href "https://planetarycomputer.microsoft.com/api/data/v1/item/map?collection=sentinel-1-rtc&item=S1A_IW_GRDH_1SDV_20220116T120548_20220116T120613_041486_04EEE8_rtc"
- type "text/html"
- title "Map of item"
assets
vh
- href "https://sentinel1euwestrtc.blob.core.windows.net/sentinel1-grd-rtc/GRD/2022/1/16/IW/DV/S1A_IW_GRDH_1SDV_20220116T120548_20220116T120613_041486_04EEE8_F185/measurement/iw-vh.rtc.tiff"
- type "image/tiff; application=geotiff; profile=cloud-optimized"
- title "VH: vertical transmit, horizontal receive"
- description "Terrain-corrected gamma naught values of signal transmitted with vertical polarization and received with horizontal polarization with radiometric terrain correction applied."
- file:size 1852959592
- file:checksum "fb54c35b87cee352fdee42d566523ffb"
raster:bands [] 1 items
0
- nodata -32768
- data_type "float32"
- spatial_resolution 10.0
roles [] 1 items
- 0 "data"
vv
- href "https://sentinel1euwestrtc.blob.core.windows.net/sentinel1-grd-rtc/GRD/2022/1/16/IW/DV/S1A_IW_GRDH_1SDV_20220116T120548_20220116T120613_041486_04EEE8_F185/measurement/iw-vv.rtc.tiff"
- type "image/tiff; application=geotiff; profile=cloud-optimized"
- title "VV: vertical transmit, vertical receive"
- description "Terrain-corrected gamma naught values of signal transmitted with vertical polarization and received with vertical polarization with radiometric terrain correction applied."
- file:size 1859813313
- file:checksum "7af3cb1579be27df41d33fb1bc5a3b22"
raster:bands [] 1 items
0
- nodata -32768
- data_type "float32"
- spatial_resolution 10.0
roles [] 1 items
- 0 "data"
tilejson
- href "https://planetarycomputer.microsoft.com/api/data/v1/item/tilejson.json?collection=sentinel-1-rtc&item=S1A_IW_GRDH_1SDV_20220116T120548_20220116T120613_041486_04EEE8_rtc&assets=vv&assets=vh&tile_format=png&expression=0.03+%2B+log+%2810e-4+-+log+%280.05+%2F+%280.02+%2B+2+%2A+vv%29%29%29%3B0.05+%2B+exp+%280.25+%2A+%28log+%280.01+%2B+2+%2A+vv%29+%2B+log+%280.02+%2B+5+%2A+vh%29%29%29%3B1+-+log+%280.05+%2F+%280.045+-+0.9+%2A+vv%29%29&asset_as_band=True&rescale=0%2C.8000&rescale=0%2C1.000&rescale=0%2C1.000&format=png"
- type "application/json"
- title "TileJSON with default rendering"
roles [] 1 items
- 0 "tiles"
rendered_preview
- href "https://planetarycomputer.microsoft.com/api/data/v1/item/preview.png?collection=sentinel-1-rtc&item=S1A_IW_GRDH_1SDV_20220116T120548_20220116T120613_041486_04EEE8_rtc&assets=vv&assets=vh&tile_format=png&expression=0.03+%2B+log+%2810e-4+-+log+%280.05+%2F+%280.02+%2B+2+%2A+vv%29%29%29%3B0.05+%2B+exp+%280.25+%2A+%28log+%280.01+%2B+2+%2A+vv%29+%2B+log+%280.02+%2B+5+%2A+vh%29%29%29%3B1+-+log+%280.05+%2F+%280.045+-+0.9+%2A+vv%29%29&asset_as_band=True&rescale=0%2C.8000&rescale=0%2C1.000&rescale=0%2C1.000&format=png"
- type "image/png"
- title "Rendered preview"
- rel "preview"
roles [] 1 items
- 0 "overview"
bbox [] 4 items
- 0 88.21768176
- 1 26.75951167
- 2 90.99373478
- 3 28.6817327
stac_extensions [] 6 items
- 0 "https://stac-extensions.github.io/sar/v1.0.0/schema.json"
- 1 "https://stac-extensions.github.io/sat/v1.0.0/schema.json"
- 2 "https://stac-extensions.github.io/eo/v1.0.0/schema.json"
- 3 "https://stac-extensions.github.io/projection/v1.0.0/schema.json"
- 4 "https://stac-extensions.github.io/file/v2.0.0/schema.json"
- 5 "https://stac-extensions.github.io/raster/v1.1.0/schema.json"
- collection "sentinel-1-rtc"
48
- type "Feature"
- stac_version "1.0.0"
- id "S1A_IW_GRDH_1SDV_20220112T000314_20220112T000339_041420_04ECCD_rtc"
properties
- datetime "2022-01-12T00:03:27.070182Z"
- platform "SENTINEL-1A"
s1:shape [] 2 items
- 0 27529
- 1 21082
proj:bbox [] 4 items
- 0 524540.0
- 1 2980870.0
- 2 799830.0
- 3 3191690.0
- proj:epsg 32645
proj:shape [] 2 items
- 0 21082
- 1 27529
- end_datetime "2022-01-12 00:03:39.568941+00:00"
- constellation "Sentinel-1"
- s1:resolution "high"
proj:transform [] 9 items
- 0 10.0
- 1 0.0
- 2 524540.0
- 3 0.0
- 4 -10.0
- 5 3191690.0
- 6 0.0
- 7 0.0
- 8 1.0
- s1:datatake_id "322765"
- start_datetime "2022-01-12 00:03:14.571423+00:00"
- s1:orbit_source "RESORB"
- s1:slice_number "12"
- s1:total_slices "17"
- sar:looks_range 5
- sat:orbit_state "descending"
- sar:product_type "GRD"
- sar:looks_azimuth 1
sar:polarizations [] 2 items
- 0 "VV"
- 1 "VH"
- sar:frequency_band "C"
- sat:absolute_orbit 41420
- sat:relative_orbit 48
- s1:processing_level "1"
- sar:instrument_mode "IW"
- sar:center_frequency 5.405
- sar:resolution_range 20
- s1:product_timeliness "Fast-24h"
- sar:resolution_azimuth 22
- sar:pixel_spacing_range 10
- sar:observation_direction "right"
- sar:pixel_spacing_azimuth 10
- sar:looks_equivalent_number 4.4
- s1:instrument_configuration_ID "7"
- sat:platform_international_designator "2014-016A"
geometry
- type "Polygon"
coordinates [] 1 items
0 [] 16 items
0 [] 2 items
- 0 89.8052112
- 1 27.0224584
1 [] 2 items
- 0 89.8296926
- 1 27.2745373
2 [] 2 items
- 0 89.9034657
- 1 27.4281928
3 [] 2 items
- 0 89.9234876
- 1 27.6385076
4 [] 2 items
- 0 89.9532258
- 1 27.6783807
5 [] 2 items
- 0 89.9319176
- 1 27.8512225
6 [] 2 items
- 0 89.9455038
- 1 27.9518743
7 [] 2 items
- 0 89.9883078
- 1 28.0011044
8 [] 2 items
- 0 89.9858722
- 1 28.1885091
9 [] 2 items
- 0 90.0501613
- 1 28.4418548
10 [] 2 items
- 0 87.5593535
- 1 28.8402917
11 [] 2 items
- 0 87.4263038
- 1 28.194437
12 [] 2 items
- 0 87.30589
- 1 27.3297407
13 [] 2 items
- 0 89.7848793
- 1 26.9229853
14 [] 2 items
- 0 89.7782308
- 1 26.9945283
15 [] 2 items
- 0 89.8052112
- 1 27.0224584
links [] 7 items
0
- rel "collection"
- href "https://planetarycomputer.microsoft.com/api/stac/v1/collections/sentinel-1-rtc"
- type "application/json"
1
- rel "parent"
- href "https://planetarycomputer.microsoft.com/api/stac/v1/collections/sentinel-1-rtc"
- type "application/json"
2
- rel "root"
- href "https://planetarycomputer.microsoft.com/api/stac/v1"
- type "application/json"
- title "Microsoft Planetary Computer STAC API"
3
- rel "self"
- href "https://planetarycomputer.microsoft.com/api/stac/v1/collections/sentinel-1-rtc/items/S1A_IW_GRDH_1SDV_20220112T000314_20220112T000339_041420_04ECCD_rtc"
- type "application/geo+json"
4
- rel "license"
- href "https://sentinel.esa.int/documents/247904/690755/Sentinel_Data_Legal_Notice"
5
- rel "derived_from"
- href "https://planetarycomputer.microsoft.com/api/stac/v1/collections/sentinel-1-grd/items/S1A_IW_GRDH_1SDV_20220112T000314_20220112T000339_041420_04ECCD"
- type "application/json"
- title "Sentinel 1 GRD Item"
6
- rel "preview"
- href "https://planetarycomputer.microsoft.com/api/data/v1/item/map?collection=sentinel-1-rtc&item=S1A_IW_GRDH_1SDV_20220112T000314_20220112T000339_041420_04ECCD_rtc"
- type "text/html"
- title "Map of item"
assets
vh
- href "https://sentinel1euwestrtc.blob.core.windows.net/sentinel1-grd-rtc/GRD/2022/1/12/IW/DV/S1A_IW_GRDH_1SDV_20220112T000314_20220112T000339_041420_04ECCD_74BB/measurement/iw-vh.rtc.tiff"
- type "image/tiff; application=geotiff; profile=cloud-optimized"
- title "VH: vertical transmit, horizontal receive"
- description "Terrain-corrected gamma naught values of signal transmitted with vertical polarization and received with horizontal polarization with radiometric terrain correction applied."
- file:size 1841674140
- file:checksum "4c21bfbe8be068dcc304c3e7bced5228"
raster:bands [] 1 items
0
- nodata -32768
- data_type "float32"
- spatial_resolution 10.0
roles [] 1 items
- 0 "data"
vv
- href "https://sentinel1euwestrtc.blob.core.windows.net/sentinel1-grd-rtc/GRD/2022/1/12/IW/DV/S1A_IW_GRDH_1SDV_20220112T000314_20220112T000339_041420_04ECCD_74BB/measurement/iw-vv.rtc.tiff"
- type "image/tiff; application=geotiff; profile=cloud-optimized"
- title "VV: vertical transmit, vertical receive"
- description "Terrain-corrected gamma naught values of signal transmitted with vertical polarization and received with vertical polarization with radiometric terrain correction applied."
- file:size 1847936889
- file:checksum "857c83d3015af18d5d2fd31967dbadb4"
raster:bands [] 1 items
0
- nodata -32768
- data_type "float32"
- spatial_resolution 10.0
roles [] 1 items
- 0 "data"
tilejson
- href "https://planetarycomputer.microsoft.com/api/data/v1/item/tilejson.json?collection=sentinel-1-rtc&item=S1A_IW_GRDH_1SDV_20220112T000314_20220112T000339_041420_04ECCD_rtc&assets=vv&assets=vh&tile_format=png&expression=0.03+%2B+log+%2810e-4+-+log+%280.05+%2F+%280.02+%2B+2+%2A+vv%29%29%29%3B0.05+%2B+exp+%280.25+%2A+%28log+%280.01+%2B+2+%2A+vv%29+%2B+log+%280.02+%2B+5+%2A+vh%29%29%29%3B1+-+log+%280.05+%2F+%280.045+-+0.9+%2A+vv%29%29&asset_as_band=True&rescale=0%2C.8000&rescale=0%2C1.000&rescale=0%2C1.000&format=png"
- type "application/json"
- title "TileJSON with default rendering"
roles [] 1 items
- 0 "tiles"
rendered_preview
- href "https://planetarycomputer.microsoft.com/api/data/v1/item/preview.png?collection=sentinel-1-rtc&item=S1A_IW_GRDH_1SDV_20220112T000314_20220112T000339_041420_04ECCD_rtc&assets=vv&assets=vh&tile_format=png&expression=0.03+%2B+log+%2810e-4+-+log+%280.05+%2F+%280.02+%2B+2+%2A+vv%29%29%29%3B0.05+%2B+exp+%280.25+%2A+%28log+%280.01+%2B+2+%2A+vv%29+%2B+log+%280.02+%2B+5+%2A+vh%29%29%29%3B1+-+log+%280.05+%2F+%280.045+-+0.9+%2A+vv%29%29&asset_as_band=True&rescale=0%2C.8000&rescale=0%2C1.000&rescale=0%2C1.000&format=png"
- type "image/png"
- title "Rendered preview"
- rel "preview"
roles [] 1 items
- 0 "overview"
bbox [] 4 items
- 0 87.30589004
- 1 26.92298529
- 2 90.05016131
- 3 28.84029174
stac_extensions [] 6 items
- 0 "https://stac-extensions.github.io/sar/v1.0.0/schema.json"
- 1 "https://stac-extensions.github.io/sat/v1.0.0/schema.json"
- 2 "https://stac-extensions.github.io/eo/v1.0.0/schema.json"
- 3 "https://stac-extensions.github.io/projection/v1.0.0/schema.json"
- 4 "https://stac-extensions.github.io/file/v2.0.0/schema.json"
- 5 "https://stac-extensions.github.io/raster/v1.1.0/schema.json"
- collection "sentinel-1-rtc"
49
- type "Feature"
- stac_version "1.0.0"
- id "S1A_IW_GRDH_1SDV_20220109T121355_20220109T121420_041384_04EB9B_rtc"
properties
- datetime "2022-01-09T12:14:08.415805Z"
- platform "SENTINEL-1A"
s1:shape [] 2 items
- 0 28240
- 1 21599
proj:bbox [] 4 items
- 0 420880.0
- 1 2916210.0
- 2 703280.0
- 3 3132200.0
- proj:epsg 32645
proj:shape [] 2 items
- 0 21599
- 1 28240
- end_datetime "2022-01-09 12:14:20.914936+00:00"
- constellation "Sentinel-1"
- s1:resolution "high"
proj:transform [] 9 items
- 0 10.0
- 1 0.0
- 2 420880.0
- 3 0.0
- 4 -10.0
- 5 3132200.0
- 6 0.0
- 7 0.0
- 8 1.0
- s1:datatake_id "322459"
- start_datetime "2022-01-09 12:13:55.916673+00:00"
- s1:orbit_source "PREORB"
- s1:slice_number "6"
- s1:total_slices "20"
- sar:looks_range 5
- sat:orbit_state "ascending"
- sar:product_type "GRD"
- sar:looks_azimuth 1
sar:polarizations [] 2 items
- 0 "VV"
- 1 "VH"
- sar:frequency_band "C"
- sat:absolute_orbit 41384
- sat:relative_orbit 12
- s1:processing_level "1"
- sar:instrument_mode "IW"
- sar:center_frequency 5.405
- sar:resolution_range 20
- s1:product_timeliness "Fast-24h"
- sar:resolution_azimuth 22
- sar:pixel_spacing_range 10
- sar:observation_direction "right"
- sar:pixel_spacing_azimuth 10
- sar:looks_equivalent_number 4.4
- s1:instrument_configuration_ID "7"
- sat:platform_international_designator "2014-016A"
geometry
- type "Polygon"
coordinates [] 1 items
0 [] 16 items
0 [] 2 items
- 0 87.8606121
- 1 26.5970117
1 [] 2 items
- 0 88.983863
- 1 26.7768184
2 [] 2 items
- 0 88.9218315
- 1 27.3275991
3 [] 2 items
- 0 88.7371292
- 1 28.2893503
4 [] 2 items
- 0 86.2102638
- 1 27.8815345
5 [] 2 items
- 0 86.2029497
- 1 27.8467837
6 [] 2 items
- 0 86.2089014
- 1 27.7822745
7 [] 2 items
- 0 86.2339779
- 1 27.7813326
8 [] 2 items
- 0 86.2153831
- 1 27.7559523
9 [] 2 items
- 0 86.2697584
- 1 27.697212
10 [] 2 items
- 0 86.2764623
- 1 27.4640686
11 [] 2 items
- 0 86.3261816
- 1 27.3762078
12 [] 2 items
- 0 86.3176611
- 1 27.2317211
13 [] 2 items
- 0 86.3544266
- 1 27.1610255
14 [] 2 items
- 0 86.4980756
- 1 26.3663209
15 [] 2 items
- 0 87.8606121
- 1 26.5970117
links [] 7 items
0
- rel "collection"
- href "https://planetarycomputer.microsoft.com/api/stac/v1/collections/sentinel-1-rtc"
- type "application/json"
1
- rel "parent"
- href "https://planetarycomputer.microsoft.com/api/stac/v1/collections/sentinel-1-rtc"
- type "application/json"
2
- rel "root"
- href "https://planetarycomputer.microsoft.com/api/stac/v1"
- type "application/json"
- title "Microsoft Planetary Computer STAC API"
3
- rel "self"
- href "https://planetarycomputer.microsoft.com/api/stac/v1/collections/sentinel-1-rtc/items/S1A_IW_GRDH_1SDV_20220109T121355_20220109T121420_041384_04EB9B_rtc"
- type "application/geo+json"
4
- rel "license"
- href "https://sentinel.esa.int/documents/247904/690755/Sentinel_Data_Legal_Notice"
5
- rel "derived_from"
- href "https://planetarycomputer.microsoft.com/api/stac/v1/collections/sentinel-1-grd/items/S1A_IW_GRDH_1SDV_20220109T121355_20220109T121420_041384_04EB9B"
- type "application/json"
- title "Sentinel 1 GRD Item"
6
- rel "preview"
- href "https://planetarycomputer.microsoft.com/api/data/v1/item/map?collection=sentinel-1-rtc&item=S1A_IW_GRDH_1SDV_20220109T121355_20220109T121420_041384_04EB9B_rtc"
- type "text/html"
- title "Map of item"
assets
vh
- href "https://sentinel1euwestrtc.blob.core.windows.net/sentinel1-grd-rtc/GRD/2022/1/9/IW/DV/S1A_IW_GRDH_1SDV_20220109T121355_20220109T121420_041384_04EB9B_1E8C/measurement/iw-vh.rtc.tiff"
- type "image/tiff; application=geotiff; profile=cloud-optimized"
- title "VH: vertical transmit, horizontal receive"
- description "Terrain-corrected gamma naught values of signal transmitted with vertical polarization and received with horizontal polarization with radiometric terrain correction applied."
- file:size 1871831280
- file:checksum "80fc2592bf4bdf4da63b86672b0ba201"
raster:bands [] 1 items
0
- nodata -32768
- data_type "float32"
- spatial_resolution 10.0
roles [] 1 items
- 0 "data"
vv
- href "https://sentinel1euwestrtc.blob.core.windows.net/sentinel1-grd-rtc/GRD/2022/1/9/IW/DV/S1A_IW_GRDH_1SDV_20220109T121355_20220109T121420_041384_04EB9B_1E8C/measurement/iw-vv.rtc.tiff"
- type "image/tiff; application=geotiff; profile=cloud-optimized"
- title "VV: vertical transmit, vertical receive"
- description "Terrain-corrected gamma naught values of signal transmitted with vertical polarization and received with vertical polarization with radiometric terrain correction applied."
- file:size 1879019714
- file:checksum "d889135f0c1aee2d363e651345fef846"
raster:bands [] 1 items
0
- nodata -32768
- data_type "float32"
- spatial_resolution 10.0
roles [] 1 items
- 0 "data"
tilejson
- href "https://planetarycomputer.microsoft.com/api/data/v1/item/tilejson.json?collection=sentinel-1-rtc&item=S1A_IW_GRDH_1SDV_20220109T121355_20220109T121420_041384_04EB9B_rtc&assets=vv&assets=vh&tile_format=png&expression=0.03+%2B+log+%2810e-4+-+log+%280.05+%2F+%280.02+%2B+2+%2A+vv%29%29%29%3B0.05+%2B+exp+%280.25+%2A+%28log+%280.01+%2B+2+%2A+vv%29+%2B+log+%280.02+%2B+5+%2A+vh%29%29%29%3B1+-+log+%280.05+%2F+%280.045+-+0.9+%2A+vv%29%29&asset_as_band=True&rescale=0%2C.8000&rescale=0%2C1.000&rescale=0%2C1.000&format=png"
- type "application/json"
- title "TileJSON with default rendering"
roles [] 1 items
- 0 "tiles"
rendered_preview
- href "https://planetarycomputer.microsoft.com/api/data/v1/item/preview.png?collection=sentinel-1-rtc&item=S1A_IW_GRDH_1SDV_20220109T121355_20220109T121420_041384_04EB9B_rtc&assets=vv&assets=vh&tile_format=png&expression=0.03+%2B+log+%2810e-4+-+log+%280.05+%2F+%280.02+%2B+2+%2A+vv%29%29%29%3B0.05+%2B+exp+%280.25+%2A+%28log+%280.01+%2B+2+%2A+vv%29+%2B+log+%280.02+%2B+5+%2A+vh%29%29%29%3B1+-+log+%280.05+%2F+%280.045+-+0.9+%2A+vv%29%29&asset_as_band=True&rescale=0%2C.8000&rescale=0%2C1.000&rescale=0%2C1.000&format=png"
- type "image/png"
- title "Rendered preview"
- rel "preview"
roles [] 1 items
- 0 "overview"
bbox [] 4 items
- 0 86.20294969
- 1 26.36632087
- 2 88.98386297
- 3 28.28935032
stac_extensions [] 6 items
- 0 "https://stac-extensions.github.io/sar/v1.0.0/schema.json"
- 1 "https://stac-extensions.github.io/sat/v1.0.0/schema.json"
- 2 "https://stac-extensions.github.io/eo/v1.0.0/schema.json"
- 3 "https://stac-extensions.github.io/projection/v1.0.0/schema.json"
- 4 "https://stac-extensions.github.io/file/v2.0.0/schema.json"
- 5 "https://stac-extensions.github.io/raster/v1.1.0/schema.json"
- collection "sentinel-1-rtc"
50
- type "Feature"
- stac_version "1.0.0"
- id "S1A_IW_GRDH_1SDV_20220104T120548_20220104T120613_041311_04E931_rtc"
properties
- datetime "2022-01-04T12:06:01.280484Z"
- platform "SENTINEL-1A"
s1:shape [] 2 items
- 0 28428
- 1 21971
proj:bbox [] 4 items
- 0 618190.0
- 1 2960430.0
- 2 902470.0
- 3 3180140.0
- proj:epsg 32645
proj:shape [] 2 items
- 0 21971
- 1 28428
- end_datetime "2022-01-04 12:06:13.779661+00:00"
- constellation "Sentinel-1"
- s1:resolution "high"
proj:transform [] 9 items
- 0 10.0
- 1 0.0
- 2 618190.0
- 3 0.0
- 4 -10.0
- 5 3180140.0
- 6 0.0
- 7 0.0
- 8 1.0
- s1:datatake_id "321841"
- start_datetime "2022-01-04 12:05:48.781306+00:00"
- s1:orbit_source "PREORB"
- s1:slice_number "6"
- s1:total_slices "21"
- sar:looks_range 5
- sat:orbit_state "ascending"
- sar:product_type "GRD"
- sar:looks_azimuth 1
sar:polarizations [] 2 items
- 0 "VV"
- 1 "VH"
- sar:frequency_band "C"
- sat:absolute_orbit 41311
- sat:relative_orbit 114
- s1:processing_level "1"
- sar:instrument_mode "IW"
- sar:center_frequency 5.405
- sar:resolution_range 20
- s1:product_timeliness "Fast-24h"
- sar:resolution_azimuth 22
- sar:pixel_spacing_range 10
- sar:observation_direction "right"
- sar:pixel_spacing_azimuth 10
- sar:looks_equivalent_number 4.4
- s1:instrument_configuration_ID "7"
- sat:platform_international_designator "2014-016A"
geometry
- type "Polygon"
coordinates [] 1 items
0 [] 14 items
0 [] 2 items
- 0 89.9822418
- 1 27.0125024
1 [] 2 items
- 0 90.993738
- 1 27.172834
2 [] 2 items
- 0 90.7249538
- 1 28.6818228
3 [] 2 items
- 0 88.2176828
- 1 28.2797624
4 [] 2 items
- 0 88.3550708
- 1 27.7231968
5 [] 2 items
- 0 88.3298574
- 1 27.5843452
6 [] 2 items
- 0 88.3763905
- 1 27.5221513
7 [] 2 items
- 0 88.3580941
- 1 27.408958
8 [] 2 items
- 0 88.4004683
- 1 27.3363264
9 [] 2 items
- 0 88.3792281
- 1 27.3025073
10 [] 2 items
- 0 88.4161073
- 1 27.2066366
11 [] 2 items
- 0 88.4042432
- 1 27.0894977
12 [] 2 items
- 0 88.4753306
- 1 26.7595127
13 [] 2 items
- 0 89.9822418
- 1 27.0125024
links [] 7 items
0
- rel "collection"
- href "https://planetarycomputer.microsoft.com/api/stac/v1/collections/sentinel-1-rtc"
- type "application/json"
1
- rel "parent"
- href "https://planetarycomputer.microsoft.com/api/stac/v1/collections/sentinel-1-rtc"
- type "application/json"
2
- rel "root"
- href "https://planetarycomputer.microsoft.com/api/stac/v1"
- type "application/json"
- title "Microsoft Planetary Computer STAC API"
3
- rel "self"
- href "https://planetarycomputer.microsoft.com/api/stac/v1/collections/sentinel-1-rtc/items/S1A_IW_GRDH_1SDV_20220104T120548_20220104T120613_041311_04E931_rtc"
- type "application/geo+json"
4
- rel "license"
- href "https://sentinel.esa.int/documents/247904/690755/Sentinel_Data_Legal_Notice"
5
- rel "derived_from"
- href "https://planetarycomputer.microsoft.com/api/stac/v1/collections/sentinel-1-grd/items/S1A_IW_GRDH_1SDV_20220104T120548_20220104T120613_041311_04E931"
- type "application/json"
- title "Sentinel 1 GRD Item"
6
- rel "preview"
- href "https://planetarycomputer.microsoft.com/api/data/v1/item/map?collection=sentinel-1-rtc&item=S1A_IW_GRDH_1SDV_20220104T120548_20220104T120613_041311_04E931_rtc"
- type "text/html"
- title "Map of item"
assets
vh
- href "https://sentinel1euwestrtc.blob.core.windows.net/sentinel1-grd-rtc/GRD/2022/1/4/IW/DV/S1A_IW_GRDH_1SDV_20220104T120548_20220104T120613_041311_04E931_3143/measurement/iw-vh.rtc.tiff"
- type "image/tiff; application=geotiff; profile=cloud-optimized"
- title "VH: vertical transmit, horizontal receive"
- description "Terrain-corrected gamma naught values of signal transmitted with vertical polarization and received with horizontal polarization with radiometric terrain correction applied."
- file:size 1853989262
- file:checksum "ea1f7eecd615a9a5c40f1941c25f0074"
raster:bands [] 1 items
0
- nodata -32768
- data_type "float32"
- spatial_resolution 10.0
roles [] 1 items
- 0 "data"
vv
- href "https://sentinel1euwestrtc.blob.core.windows.net/sentinel1-grd-rtc/GRD/2022/1/4/IW/DV/S1A_IW_GRDH_1SDV_20220104T120548_20220104T120613_041311_04E931_3143/measurement/iw-vv.rtc.tiff"
- type "image/tiff; application=geotiff; profile=cloud-optimized"
- title "VV: vertical transmit, vertical receive"
- description "Terrain-corrected gamma naught values of signal transmitted with vertical polarization and received with vertical polarization with radiometric terrain correction applied."
- file:size 1860670002
- file:checksum "21457402e62ac76e55d995f9a4ecfb3f"
raster:bands [] 1 items
0
- nodata -32768
- data_type "float32"
- spatial_resolution 10.0
roles [] 1 items
- 0 "data"
tilejson
- href "https://planetarycomputer.microsoft.com/api/data/v1/item/tilejson.json?collection=sentinel-1-rtc&item=S1A_IW_GRDH_1SDV_20220104T120548_20220104T120613_041311_04E931_rtc&assets=vv&assets=vh&tile_format=png&expression=0.03+%2B+log+%2810e-4+-+log+%280.05+%2F+%280.02+%2B+2+%2A+vv%29%29%29%3B0.05+%2B+exp+%280.25+%2A+%28log+%280.01+%2B+2+%2A+vv%29+%2B+log+%280.02+%2B+5+%2A+vh%29%29%29%3B1+-+log+%280.05+%2F+%280.045+-+0.9+%2A+vv%29%29&asset_as_band=True&rescale=0%2C.8000&rescale=0%2C1.000&rescale=0%2C1.000&format=png"
- type "application/json"
- title "TileJSON with default rendering"
roles [] 1 items
- 0 "tiles"
rendered_preview
- href "https://planetarycomputer.microsoft.com/api/data/v1/item/preview.png?collection=sentinel-1-rtc&item=S1A_IW_GRDH_1SDV_20220104T120548_20220104T120613_041311_04E931_rtc&assets=vv&assets=vh&tile_format=png&expression=0.03+%2B+log+%2810e-4+-+log+%280.05+%2F+%280.02+%2B+2+%2A+vv%29%29%29%3B0.05+%2B+exp+%280.25+%2A+%28log+%280.01+%2B+2+%2A+vv%29+%2B+log+%280.02+%2B+5+%2A+vh%29%29%29%3B1+-+log+%280.05+%2F+%280.045+-+0.9+%2A+vv%29%29&asset_as_band=True&rescale=0%2C.8000&rescale=0%2C1.000&rescale=0%2C1.000&format=png"
- type "image/png"
- title "Rendered preview"
- rel "preview"
roles [] 1 items
- 0 "overview"
bbox [] 4 items
- 0 88.21768279
- 1 26.75951271
- 2 90.99373799
- 3 28.68182277
stac_extensions [] 6 items
- 0 "https://stac-extensions.github.io/sar/v1.0.0/schema.json"
- 1 "https://stac-extensions.github.io/sat/v1.0.0/schema.json"
- 2 "https://stac-extensions.github.io/eo/v1.0.0/schema.json"
- 3 "https://stac-extensions.github.io/projection/v1.0.0/schema.json"
- 4 "https://stac-extensions.github.io/file/v2.0.0/schema.json"
- 5 "https://stac-extensions.github.io/raster/v1.1.0/schema.json"
- collection "sentinel-1-rtc"
51
- type "Feature"
- stac_version "1.0.0"
- id "S1A_IW_GRDH_1SDV_20211231T000314_20211231T000339_041245_04E6D7_rtc"
properties
- datetime "2021-12-31T00:03:27.432317Z"
- platform "SENTINEL-1A"
s1:shape [] 2 items
- 0 27535
- 1 21082
proj:bbox [] 4 items
- 0 524510.0
- 1 2980860.0
- 2 799860.0
- 3 3191680.0
- proj:epsg 32645
proj:shape [] 2 items
- 0 21082
- 1 27535
- end_datetime "2021-12-31 00:03:39.931813+00:00"
- constellation "Sentinel-1"
- s1:resolution "high"
proj:transform [] 9 items
- 0 10.0
- 1 0.0
- 2 524510.0
- 3 0.0
- 4 -10.0
- 5 3191680.0
- 6 0.0
- 7 0.0
- 8 1.0
- s1:datatake_id "321239"
- start_datetime "2021-12-31 00:03:14.932821+00:00"
- s1:orbit_source "RESORB"
- s1:slice_number "12"
- s1:total_slices "17"
- sar:looks_range 5
- sat:orbit_state "descending"
- sar:product_type "GRD"
- sar:looks_azimuth 1
sar:polarizations [] 2 items
- 0 "VV"
- 1 "VH"
- sar:frequency_band "C"
- sat:absolute_orbit 41245
- sat:relative_orbit 48
- s1:processing_level "1"
- sar:instrument_mode "IW"
- sar:center_frequency 5.405
- sar:resolution_range 20
- s1:product_timeliness "Fast-24h"
- sar:resolution_azimuth 22
- sar:pixel_spacing_range 10
- sar:observation_direction "right"
- sar:pixel_spacing_azimuth 10
- sar:looks_equivalent_number 4.4
- s1:instrument_configuration_ID "7"
- sat:platform_international_designator "2014-016A"
geometry
- type "Polygon"
coordinates [] 1 items
0 [] 16 items
0 [] 2 items
- 0 89.8059138
- 1 27.0223541
1 [] 2 items
- 0 89.7787319
- 1 26.9944282
2 [] 2 items
- 0 89.7850783
- 1 26.9228911
3 [] 2 items
- 0 87.3058925
- 1 27.3306435
4 [] 2 items
- 0 87.4266094
- 1 28.194436
5 [] 2 items
- 0 87.5598656
- 1 28.8401994
6 [] 2 items
- 0 90.0504672
- 1 28.441848
7 [] 2 items
- 0 89.9717907
- 1 28.08418
8 [] 2 items
- 0 89.9888182
- 1 28.0011835
9 [] 2 items
- 0 89.9457044
- 1 27.9517798
10 [] 2 items
- 0 89.932118
- 1 27.8511281
11 [] 2 items
- 0 89.9534235
- 1 27.6781961
12 [] 2 items
- 0 89.9237985
- 1 27.6387717
13 [] 2 items
- 0 89.9039733
- 1 27.4282724
14 [] 2 items
- 0 89.830509
- 1 27.2748816
15 [] 2 items
- 0 89.8059138
- 1 27.0223541
links [] 7 items
0
- rel "collection"
- href "https://planetarycomputer.microsoft.com/api/stac/v1/collections/sentinel-1-rtc"
- type "application/json"
1
- rel "parent"
- href "https://planetarycomputer.microsoft.com/api/stac/v1/collections/sentinel-1-rtc"
- type "application/json"
2
- rel "root"
- href "https://planetarycomputer.microsoft.com/api/stac/v1"
- type "application/json"
- title "Microsoft Planetary Computer STAC API"
3
- rel "self"
- href "https://planetarycomputer.microsoft.com/api/stac/v1/collections/sentinel-1-rtc/items/S1A_IW_GRDH_1SDV_20211231T000314_20211231T000339_041245_04E6D7_rtc"
- type "application/geo+json"
4
- rel "license"
- href "https://sentinel.esa.int/documents/247904/690755/Sentinel_Data_Legal_Notice"
5
- rel "derived_from"
- href "https://planetarycomputer.microsoft.com/api/stac/v1/collections/sentinel-1-grd/items/S1A_IW_GRDH_1SDV_20211231T000314_20211231T000339_041245_04E6D7"
- type "application/json"
- title "Sentinel 1 GRD Item"
6
- rel "preview"
- href "https://planetarycomputer.microsoft.com/api/data/v1/item/map?collection=sentinel-1-rtc&item=S1A_IW_GRDH_1SDV_20211231T000314_20211231T000339_041245_04E6D7_rtc"
- type "text/html"
- title "Map of item"
assets
vh
- href "https://sentinel1euwestrtc.blob.core.windows.net/sentinel1-grd-rtc/GRD/2021/12/31/IW/DV/S1A_IW_GRDH_1SDV_20211231T000314_20211231T000339_041245_04E6D7_403F/measurement/iw-vh.rtc.tiff"
- type "image/tiff; application=geotiff; profile=cloud-optimized"
- title "VH: vertical transmit, horizontal receive"
- description "Terrain-corrected gamma naught values of signal transmitted with vertical polarization and received with horizontal polarization with radiometric terrain correction applied."
- file:size 1841689212
- file:checksum "b14eaa33d090d0353a5a8740efda9c35"
raster:bands [] 1 items
0
- nodata -32768
- data_type "float32"
- spatial_resolution 10.0
roles [] 1 items
- 0 "data"
vv
- href "https://sentinel1euwestrtc.blob.core.windows.net/sentinel1-grd-rtc/GRD/2021/12/31/IW/DV/S1A_IW_GRDH_1SDV_20211231T000314_20211231T000339_041245_04E6D7_403F/measurement/iw-vv.rtc.tiff"
- type "image/tiff; application=geotiff; profile=cloud-optimized"
- title "VV: vertical transmit, vertical receive"
- description "Terrain-corrected gamma naught values of signal transmitted with vertical polarization and received with vertical polarization with radiometric terrain correction applied."
- file:size 1847951398
- file:checksum "59581c6ba4179230e88d76fe87d00fbd"
raster:bands [] 1 items
0
- nodata -32768
- data_type "float32"
- spatial_resolution 10.0
roles [] 1 items
- 0 "data"
tilejson
- href "https://planetarycomputer.microsoft.com/api/data/v1/item/tilejson.json?collection=sentinel-1-rtc&item=S1A_IW_GRDH_1SDV_20211231T000314_20211231T000339_041245_04E6D7_rtc&assets=vv&assets=vh&tile_format=png&expression=0.03+%2B+log+%2810e-4+-+log+%280.05+%2F+%280.02+%2B+2+%2A+vv%29%29%29%3B0.05+%2B+exp+%280.25+%2A+%28log+%280.01+%2B+2+%2A+vv%29+%2B+log+%280.02+%2B+5+%2A+vh%29%29%29%3B1+-+log+%280.05+%2F+%280.045+-+0.9+%2A+vv%29%29&asset_as_band=True&rescale=0%2C.8000&rescale=0%2C1.000&rescale=0%2C1.000&format=png"
- type "application/json"
- title "TileJSON with default rendering"
roles [] 1 items
- 0 "tiles"
rendered_preview
- href "https://planetarycomputer.microsoft.com/api/data/v1/item/preview.png?collection=sentinel-1-rtc&item=S1A_IW_GRDH_1SDV_20211231T000314_20211231T000339_041245_04E6D7_rtc&assets=vv&assets=vh&tile_format=png&expression=0.03+%2B+log+%2810e-4+-+log+%280.05+%2F+%280.02+%2B+2+%2A+vv%29%29%29%3B0.05+%2B+exp+%280.25+%2A+%28log+%280.01+%2B+2+%2A+vv%29+%2B+log+%280.02+%2B+5+%2A+vh%29%29%29%3B1+-+log+%280.05+%2F+%280.045+-+0.9+%2A+vv%29%29&asset_as_band=True&rescale=0%2C.8000&rescale=0%2C1.000&rescale=0%2C1.000&format=png"
- type "image/png"
- title "Rendered preview"
- rel "preview"
roles [] 1 items
- 0 "overview"
bbox [] 4 items
- 0 87.30589252
- 1 26.92289114
- 2 90.05046725
- 3 28.84019936
stac_extensions [] 6 items
- 0 "https://stac-extensions.github.io/sar/v1.0.0/schema.json"
- 1 "https://stac-extensions.github.io/sat/v1.0.0/schema.json"
- 2 "https://stac-extensions.github.io/eo/v1.0.0/schema.json"
- 3 "https://stac-extensions.github.io/projection/v1.0.0/schema.json"
- 4 "https://stac-extensions.github.io/file/v2.0.0/schema.json"
- 5 "https://stac-extensions.github.io/raster/v1.1.0/schema.json"
- collection "sentinel-1-rtc"
52
- type "Feature"
- stac_version "1.0.0"
- id "S1A_IW_GRDH_1SDV_20211228T121356_20211228T121421_041209_04E5AB_rtc"
properties
- datetime "2021-12-28T12:14:08.858303Z"
- platform "SENTINEL-1A"
s1:shape [] 2 items
- 0 28244
- 1 21600
proj:bbox [] 4 items
- 0 420940.0
- 1 2916210.0
- 2 703380.0
- 3 3132210.0
- proj:epsg 32645
proj:shape [] 2 items
- 0 21600
- 1 28244
- end_datetime "2021-12-28 12:14:21.358168+00:00"
- constellation "Sentinel-1"
- s1:resolution "high"
proj:transform [] 9 items
- 0 10.0
- 1 0.0
- 2 420940.0
- 3 0.0
- 4 -10.0
- 5 3132210.0
- 6 0.0
- 7 0.0
- 8 1.0
- s1:datatake_id "320939"
- start_datetime "2021-12-28 12:13:56.358437+00:00"
- s1:orbit_source "PREORB"
- s1:slice_number "6"
- s1:total_slices "20"
- sar:looks_range 5
- sat:orbit_state "ascending"
- sar:product_type "GRD"
- sar:looks_azimuth 1
sar:polarizations [] 2 items
- 0 "VV"
- 1 "VH"
- sar:frequency_band "C"
- sat:absolute_orbit 41209
- sat:relative_orbit 12
- s1:processing_level "1"
- sar:instrument_mode "IW"
- sar:center_frequency 5.405
- sar:resolution_range 20
- s1:product_timeliness "Fast-24h"
- sar:resolution_azimuth 22
- sar:pixel_spacing_range 10
- sar:observation_direction "right"
- sar:pixel_spacing_azimuth 10
- sar:looks_equivalent_number 4.4
- s1:instrument_configuration_ID "7"
- sat:platform_international_designator "2014-016A"
geometry
- type "Polygon"
coordinates [] 1 items
0 [] 16 items
0 [] 2 items
- 0 87.865136
- 1 26.5976163
1 [] 2 items
- 0 86.499278
- 1 26.3664154
2 [] 2 items
- 0 86.3554348
- 1 27.1612107
3 [] 2 items
- 0 86.3187742
- 1 27.2313654
4 [] 2 items
- 0 86.3272885
- 1 27.3771159
5 [] 2 items
- 0 86.2776738
- 1 27.4645263
6 [] 2 items
- 0 86.2710756
- 1 27.6973995
7 [] 2 items
- 0 86.2164979
- 1 27.7561392
8 [] 2 items
- 0 86.2346864
- 1 27.7816073
9 [] 2 items
- 0 86.2101141
- 1 27.7830037
10 [] 2 items
- 0 86.2039652
- 1 27.8467896
11 [] 2 items
- 0 86.2111775
- 1 27.88163
12 [] 2 items
- 0 88.7382534
- 1 28.2895165
13 [] 2 items
- 0 88.9225449
- 1 27.3279503
14 [] 2 items
- 0 88.9848699
- 1 26.7768945
15 [] 2 items
- 0 87.865136
- 1 26.5976163
links [] 7 items
0
- rel "collection"
- href "https://planetarycomputer.microsoft.com/api/stac/v1/collections/sentinel-1-rtc"
- type "application/json"
1
- rel "parent"
- href "https://planetarycomputer.microsoft.com/api/stac/v1/collections/sentinel-1-rtc"
- type "application/json"
2
- rel "root"
- href "https://planetarycomputer.microsoft.com/api/stac/v1"
- type "application/json"
- title "Microsoft Planetary Computer STAC API"
3
- rel "self"
- href "https://planetarycomputer.microsoft.com/api/stac/v1/collections/sentinel-1-rtc/items/S1A_IW_GRDH_1SDV_20211228T121356_20211228T121421_041209_04E5AB_rtc"
- type "application/geo+json"
4
- rel "license"
- href "https://sentinel.esa.int/documents/247904/690755/Sentinel_Data_Legal_Notice"
5
- rel "derived_from"
- href "https://planetarycomputer.microsoft.com/api/stac/v1/collections/sentinel-1-grd/items/S1A_IW_GRDH_1SDV_20211228T121356_20211228T121421_041209_04E5AB"
- type "application/json"
- title "Sentinel 1 GRD Item"
6
- rel "preview"
- href "https://planetarycomputer.microsoft.com/api/data/v1/item/map?collection=sentinel-1-rtc&item=S1A_IW_GRDH_1SDV_20211228T121356_20211228T121421_041209_04E5AB_rtc"
- type "text/html"
- title "Map of item"
assets
vh
- href "https://sentinel1euwestrtc.blob.core.windows.net/sentinel1-grd-rtc/GRD/2021/12/28/IW/DV/S1A_IW_GRDH_1SDV_20211228T121356_20211228T121421_041209_04E5AB_8B61/measurement/iw-vh.rtc.tiff"
- type "image/tiff; application=geotiff; profile=cloud-optimized"
- title "VH: vertical transmit, horizontal receive"
- description "Terrain-corrected gamma naught values of signal transmitted with vertical polarization and received with horizontal polarization with radiometric terrain correction applied."
- file:size 1873308921
- file:checksum "88c01ed6a1ffcfe0c9108d59dcd26716"
raster:bands [] 1 items
0
- nodata -32768
- data_type "float32"
- spatial_resolution 10.0
roles [] 1 items
- 0 "data"
vv
- href "https://sentinel1euwestrtc.blob.core.windows.net/sentinel1-grd-rtc/GRD/2021/12/28/IW/DV/S1A_IW_GRDH_1SDV_20211228T121356_20211228T121421_041209_04E5AB_8B61/measurement/iw-vv.rtc.tiff"
- type "image/tiff; application=geotiff; profile=cloud-optimized"
- title "VV: vertical transmit, vertical receive"
- description "Terrain-corrected gamma naught values of signal transmitted with vertical polarization and received with vertical polarization with radiometric terrain correction applied."
- file:size 1880212329
- file:checksum "be6c9774b3516ecaf85ffc9e610a76aa"
raster:bands [] 1 items
0
- nodata -32768
- data_type "float32"
- spatial_resolution 10.0
roles [] 1 items
- 0 "data"
tilejson
- href "https://planetarycomputer.microsoft.com/api/data/v1/item/tilejson.json?collection=sentinel-1-rtc&item=S1A_IW_GRDH_1SDV_20211228T121356_20211228T121421_041209_04E5AB_rtc&assets=vv&assets=vh&tile_format=png&expression=0.03+%2B+log+%2810e-4+-+log+%280.05+%2F+%280.02+%2B+2+%2A+vv%29%29%29%3B0.05+%2B+exp+%280.25+%2A+%28log+%280.01+%2B+2+%2A+vv%29+%2B+log+%280.02+%2B+5+%2A+vh%29%29%29%3B1+-+log+%280.05+%2F+%280.045+-+0.9+%2A+vv%29%29&asset_as_band=True&rescale=0%2C.8000&rescale=0%2C1.000&rescale=0%2C1.000&format=png"
- type "application/json"
- title "TileJSON with default rendering"
roles [] 1 items
- 0 "tiles"
rendered_preview
- href "https://planetarycomputer.microsoft.com/api/data/v1/item/preview.png?collection=sentinel-1-rtc&item=S1A_IW_GRDH_1SDV_20211228T121356_20211228T121421_041209_04E5AB_rtc&assets=vv&assets=vh&tile_format=png&expression=0.03+%2B+log+%2810e-4+-+log+%280.05+%2F+%280.02+%2B+2+%2A+vv%29%29%29%3B0.05+%2B+exp+%280.25+%2A+%28log+%280.01+%2B+2+%2A+vv%29+%2B+log+%280.02+%2B+5+%2A+vh%29%29%29%3B1+-+log+%280.05+%2F+%280.045+-+0.9+%2A+vv%29%29&asset_as_band=True&rescale=0%2C.8000&rescale=0%2C1.000&rescale=0%2C1.000&format=png"
- type "image/png"
- title "Rendered preview"
- rel "preview"
roles [] 1 items
- 0 "overview"
bbox [] 4 items
- 0 86.20396522
- 1 26.36641537
- 2 88.98486987
- 3 28.28951651
stac_extensions [] 6 items
- 0 "https://stac-extensions.github.io/sar/v1.0.0/schema.json"
- 1 "https://stac-extensions.github.io/sat/v1.0.0/schema.json"
- 2 "https://stac-extensions.github.io/eo/v1.0.0/schema.json"
- 3 "https://stac-extensions.github.io/projection/v1.0.0/schema.json"
- 4 "https://stac-extensions.github.io/file/v2.0.0/schema.json"
- 5 "https://stac-extensions.github.io/raster/v1.1.0/schema.json"
- collection "sentinel-1-rtc"
53
- type "Feature"
- stac_version "1.0.0"
- id "S1A_IW_GRDH_1SDV_20211223T120549_20211223T120614_041136_04E340_rtc"
properties
- datetime "2021-12-23T12:06:01.793721Z"
- platform "SENTINEL-1A"
s1:shape [] 2 items
- 0 28429
- 1 21971
proj:bbox [] 4 items
- 0 618170.0
- 1 2960440.0
- 2 902460.0
- 3 3180150.0
- proj:epsg 32645
proj:shape [] 2 items
- 0 21971
- 1 28429
- end_datetime "2021-12-23 12:06:14.292909+00:00"
- constellation "Sentinel-1"
- s1:resolution "high"
proj:transform [] 9 items
- 0 10.0
- 1 0.0
- 2 618170.0
- 3 0.0
- 4 -10.0
- 5 3180150.0
- 6 0.0
- 7 0.0
- 8 1.0
- s1:datatake_id "320320"
- start_datetime "2021-12-23 12:05:49.294533+00:00"
- s1:orbit_source "PREORB"
- s1:slice_number "6"
- s1:total_slices "21"
- sar:looks_range 5
- sat:orbit_state "ascending"
- sar:product_type "GRD"
- sar:looks_azimuth 1
sar:polarizations [] 2 items
- 0 "VV"
- 1 "VH"
- sar:frequency_band "C"
- sat:absolute_orbit 41136
- sat:relative_orbit 114
- s1:processing_level "1"
- sar:instrument_mode "IW"
- sar:center_frequency 5.405
- sar:resolution_range 20
- s1:product_timeliness "Fast-24h"
- sar:resolution_azimuth 22
- sar:pixel_spacing_range 10
- sar:observation_direction "right"
- sar:pixel_spacing_azimuth 10
- sar:looks_equivalent_number 4.4
- s1:instrument_configuration_ID "7"
- sat:platform_international_designator "2014-016A"
geometry
- type "Polygon"
coordinates [] 1 items
0 [] 14 items
0 [] 2 items
- 0 89.9824455
- 1 27.0125883
1 [] 2 items
- 0 90.9936373
- 1 27.1728369
2 [] 2 items
- 0 90.7247495
- 1 28.6818284
3 [] 2 items
- 0 88.2174779
- 1 28.279674
4 [] 2 items
- 0 88.354868
- 1 27.7231987
5 [] 2 items
- 0 88.3297539
- 1 27.5841657
6 [] 2 items
- 0 88.376287
- 1 27.5219718
7 [] 2 items
- 0 88.3578918
- 1 27.40896
8 [] 2 items
- 0 88.4002673
- 1 27.3364187
9 [] 2 items
- 0 88.3791282
- 1 27.3025985
10 [] 2 items
- 0 88.4160075
- 1 27.2067278
11 [] 2 items
- 0 88.4041401
- 1 27.0893182
12 [] 2 items
- 0 88.4752301
- 1 26.7595138
13 [] 2 items
- 0 89.9824455
- 1 27.0125883
links [] 7 items
0
- rel "collection"
- href "https://planetarycomputer.microsoft.com/api/stac/v1/collections/sentinel-1-rtc"
- type "application/json"
1
- rel "parent"
- href "https://planetarycomputer.microsoft.com/api/stac/v1/collections/sentinel-1-rtc"
- type "application/json"
2
- rel "root"
- href "https://planetarycomputer.microsoft.com/api/stac/v1"
- type "application/json"
- title "Microsoft Planetary Computer STAC API"
3
- rel "self"
- href "https://planetarycomputer.microsoft.com/api/stac/v1/collections/sentinel-1-rtc/items/S1A_IW_GRDH_1SDV_20211223T120549_20211223T120614_041136_04E340_rtc"
- type "application/geo+json"
4
- rel "license"
- href "https://sentinel.esa.int/documents/247904/690755/Sentinel_Data_Legal_Notice"
5
- rel "derived_from"
- href "https://planetarycomputer.microsoft.com/api/stac/v1/collections/sentinel-1-grd/items/S1A_IW_GRDH_1SDV_20211223T120549_20211223T120614_041136_04E340"
- type "application/json"
- title "Sentinel 1 GRD Item"
6
- rel "preview"
- href "https://planetarycomputer.microsoft.com/api/data/v1/item/map?collection=sentinel-1-rtc&item=S1A_IW_GRDH_1SDV_20211223T120549_20211223T120614_041136_04E340_rtc"
- type "text/html"
- title "Map of item"
assets
vh
- href "https://sentinel1euwestrtc.blob.core.windows.net/sentinel1-grd-rtc/GRD/2021/12/23/IW/DV/S1A_IW_GRDH_1SDV_20211223T120549_20211223T120614_041136_04E340_1239/measurement/iw-vh.rtc.tiff"
- type "image/tiff; application=geotiff; profile=cloud-optimized"
- title "VH: vertical transmit, horizontal receive"
- description "Terrain-corrected gamma naught values of signal transmitted with vertical polarization and received with horizontal polarization with radiometric terrain correction applied."
- file:size 1853713181
- file:checksum "fc58122890f1275ba52fc0effd48afb2"
raster:bands [] 1 items
0
- nodata -32768
- data_type "float32"
- spatial_resolution 10.0
roles [] 1 items
- 0 "data"
vv
- href "https://sentinel1euwestrtc.blob.core.windows.net/sentinel1-grd-rtc/GRD/2021/12/23/IW/DV/S1A_IW_GRDH_1SDV_20211223T120549_20211223T120614_041136_04E340_1239/measurement/iw-vv.rtc.tiff"
- type "image/tiff; application=geotiff; profile=cloud-optimized"
- title "VV: vertical transmit, vertical receive"
- description "Terrain-corrected gamma naught values of signal transmitted with vertical polarization and received with vertical polarization with radiometric terrain correction applied."
- file:size 1859861533
- file:checksum "851592fd3da9cce0f032b703aea5e6bc"
raster:bands [] 1 items
0
- nodata -32768
- data_type "float32"
- spatial_resolution 10.0
roles [] 1 items
- 0 "data"
tilejson
- href "https://planetarycomputer.microsoft.com/api/data/v1/item/tilejson.json?collection=sentinel-1-rtc&item=S1A_IW_GRDH_1SDV_20211223T120549_20211223T120614_041136_04E340_rtc&assets=vv&assets=vh&tile_format=png&expression=0.03+%2B+log+%2810e-4+-+log+%280.05+%2F+%280.02+%2B+2+%2A+vv%29%29%29%3B0.05+%2B+exp+%280.25+%2A+%28log+%280.01+%2B+2+%2A+vv%29+%2B+log+%280.02+%2B+5+%2A+vh%29%29%29%3B1+-+log+%280.05+%2F+%280.045+-+0.9+%2A+vv%29%29&asset_as_band=True&rescale=0%2C.8000&rescale=0%2C1.000&rescale=0%2C1.000&format=png"
- type "application/json"
- title "TileJSON with default rendering"
roles [] 1 items
- 0 "tiles"
rendered_preview
- href "https://planetarycomputer.microsoft.com/api/data/v1/item/preview.png?collection=sentinel-1-rtc&item=S1A_IW_GRDH_1SDV_20211223T120549_20211223T120614_041136_04E340_rtc&assets=vv&assets=vh&tile_format=png&expression=0.03+%2B+log+%2810e-4+-+log+%280.05+%2F+%280.02+%2B+2+%2A+vv%29%29%29%3B0.05+%2B+exp+%280.25+%2A+%28log+%280.01+%2B+2+%2A+vv%29+%2B+log+%280.02+%2B+5+%2A+vh%29%29%29%3B1+-+log+%280.05+%2F+%280.045+-+0.9+%2A+vv%29%29&asset_as_band=True&rescale=0%2C.8000&rescale=0%2C1.000&rescale=0%2C1.000&format=png"
- type "image/png"
- title "Rendered preview"
- rel "preview"
roles [] 1 items
- 0 "overview"
bbox [] 4 items
- 0 88.21747786
- 1 26.75951376
- 2 90.99363729
- 3 28.6818284
stac_extensions [] 6 items
- 0 "https://stac-extensions.github.io/sar/v1.0.0/schema.json"
- 1 "https://stac-extensions.github.io/sat/v1.0.0/schema.json"
- 2 "https://stac-extensions.github.io/eo/v1.0.0/schema.json"
- 3 "https://stac-extensions.github.io/projection/v1.0.0/schema.json"
- 4 "https://stac-extensions.github.io/file/v2.0.0/schema.json"
- 5 "https://stac-extensions.github.io/raster/v1.1.0/schema.json"
- collection "sentinel-1-rtc"
54
- type "Feature"
- stac_version "1.0.0"
- id "S1A_IW_GRDH_1SDV_20211219T000315_20211219T000340_041070_04E110_rtc"
properties
- datetime "2021-12-19T00:03:28.141449Z"
- platform "SENTINEL-1A"
s1:shape [] 2 items
- 0 27541
- 1 21084
proj:bbox [] 4 items
- 0 524380.0
- 1 2980850.0
- 2 799790.0
- 3 3191690.0
- proj:epsg 32645
proj:shape [] 2 items
- 0 21084
- 1 27541
- end_datetime "2021-12-19 00:03:40.640936+00:00"
- constellation "Sentinel-1"
- s1:resolution "high"
proj:transform [] 9 items
- 0 10.0
- 1 0.0
- 2 524380.0
- 3 0.0
- 4 -10.0
- 5 3191690.0
- 6 0.0
- 7 0.0
- 8 1.0
- s1:datatake_id "319760"
- start_datetime "2021-12-19 00:03:15.641961+00:00"
- s1:orbit_source "RESORB"
- s1:slice_number "12"
- s1:total_slices "17"
- sar:looks_range 5
- sat:orbit_state "descending"
- sar:product_type "GRD"
- sar:looks_azimuth 1
sar:polarizations [] 2 items
- 0 "VV"
- 1 "VH"
- sar:frequency_band "C"
- sat:absolute_orbit 41070
- sat:relative_orbit 48
- s1:processing_level "1"
- sar:instrument_mode "IW"
- sar:center_frequency 5.405
- sar:resolution_range 20
- s1:product_timeliness "Fast-24h"
- sar:resolution_azimuth 22
- sar:pixel_spacing_range 10
- sar:observation_direction "right"
- sar:pixel_spacing_azimuth 10
- sar:looks_equivalent_number 4.4
- s1:instrument_configuration_ID "7"
- sat:platform_international_designator "2014-016A"
geometry
- type "Polygon"
coordinates [] 1 items
0 [] 18 items
0 [] 2 items
- 0 89.8053729
- 1 27.0654006
1 [] 2 items
- 0 89.7847721
- 1 26.9227167
2 [] 2 items
- 0 87.3047776
- 1 27.3295626
3 [] 2 items
- 0 87.4256899
- 1 28.193807
4 [] 2 items
- 0 87.558328
- 1 28.8402057
5 [] 2 items
- 0 90.0497508
- 1 28.4417738
6 [] 2 items
- 0 90.0262327
- 1 28.2910813
7 [] 2 items
- 0 89.9732389
- 1 28.1918512
8 [] 2 items
- 0 89.9977787
- 1 28.1481991
9 [] 2 items
- 0 89.9711833
- 1 28.0842833
10 [] 2 items
- 0 89.9875127
- 1 28.0017531
11 [] 2 items
- 0 89.9442464
- 1 27.9504579
12 [] 2 items
- 0 89.9292632
- 1 27.8242165
13 [] 2 items
- 0 89.9525169
- 1 27.6783958
14 [] 2 items
- 0 89.9217048
- 1 27.6324109
15 [] 2 items
- 0 89.903036
- 1 27.4310885
16 [] 2 items
- 0 89.8291903
- 1 27.2746376
17 [] 2 items
- 0 89.8053729
- 1 27.0654006
links [] 7 items
0
- rel "collection"
- href "https://planetarycomputer.microsoft.com/api/stac/v1/collections/sentinel-1-rtc"
- type "application/json"
1
- rel "parent"
- href "https://planetarycomputer.microsoft.com/api/stac/v1/collections/sentinel-1-rtc"
- type "application/json"
2
- rel "root"
- href "https://planetarycomputer.microsoft.com/api/stac/v1"
- type "application/json"
- title "Microsoft Planetary Computer STAC API"
3
- rel "self"
- href "https://planetarycomputer.microsoft.com/api/stac/v1/collections/sentinel-1-rtc/items/S1A_IW_GRDH_1SDV_20211219T000315_20211219T000340_041070_04E110_rtc"
- type "application/geo+json"
4
- rel "license"
- href "https://sentinel.esa.int/documents/247904/690755/Sentinel_Data_Legal_Notice"
5
- rel "derived_from"
- href "https://planetarycomputer.microsoft.com/api/stac/v1/collections/sentinel-1-grd/items/S1A_IW_GRDH_1SDV_20211219T000315_20211219T000340_041070_04E110"
- type "application/json"
- title "Sentinel 1 GRD Item"
6
- rel "preview"
- href "https://planetarycomputer.microsoft.com/api/data/v1/item/map?collection=sentinel-1-rtc&item=S1A_IW_GRDH_1SDV_20211219T000315_20211219T000340_041070_04E110_rtc"
- type "text/html"
- title "Map of item"
assets
vh
- href "https://sentinel1euwestrtc.blob.core.windows.net/sentinel1-grd-rtc/GRD/2021/12/19/IW/DV/S1A_IW_GRDH_1SDV_20211219T000315_20211219T000340_041070_04E110_C898/measurement/iw-vh.rtc.tiff"
- type "image/tiff; application=geotiff; profile=cloud-optimized"
- title "VH: vertical transmit, horizontal receive"
- description "Terrain-corrected gamma naught values of signal transmitted with vertical polarization and received with horizontal polarization with radiometric terrain correction applied."
- file:size 1842110892
- file:checksum "619030dee3444106a656e488592c657e"
raster:bands [] 1 items
0
- nodata -32768
- data_type "float32"
- spatial_resolution 10.0
roles [] 1 items
- 0 "data"
vv
- href "https://sentinel1euwestrtc.blob.core.windows.net/sentinel1-grd-rtc/GRD/2021/12/19/IW/DV/S1A_IW_GRDH_1SDV_20211219T000315_20211219T000340_041070_04E110_C898/measurement/iw-vv.rtc.tiff"
- type "image/tiff; application=geotiff; profile=cloud-optimized"
- title "VV: vertical transmit, vertical receive"
- description "Terrain-corrected gamma naught values of signal transmitted with vertical polarization and received with vertical polarization with radiometric terrain correction applied."
- file:size 1847934060
- file:checksum "aec8188fc0c5786e053f18cffbc54a35"
raster:bands [] 1 items
0
- nodata -32768
- data_type "float32"
- spatial_resolution 10.0
roles [] 1 items
- 0 "data"
tilejson
- href "https://planetarycomputer.microsoft.com/api/data/v1/item/tilejson.json?collection=sentinel-1-rtc&item=S1A_IW_GRDH_1SDV_20211219T000315_20211219T000340_041070_04E110_rtc&assets=vv&assets=vh&tile_format=png&expression=0.03+%2B+log+%2810e-4+-+log+%280.05+%2F+%280.02+%2B+2+%2A+vv%29%29%29%3B0.05+%2B+exp+%280.25+%2A+%28log+%280.01+%2B+2+%2A+vv%29+%2B+log+%280.02+%2B+5+%2A+vh%29%29%29%3B1+-+log+%280.05+%2F+%280.045+-+0.9+%2A+vv%29%29&asset_as_band=True&rescale=0%2C.8000&rescale=0%2C1.000&rescale=0%2C1.000&format=png"
- type "application/json"
- title "TileJSON with default rendering"
roles [] 1 items
- 0 "tiles"
rendered_preview
- href "https://planetarycomputer.microsoft.com/api/data/v1/item/preview.png?collection=sentinel-1-rtc&item=S1A_IW_GRDH_1SDV_20211219T000315_20211219T000340_041070_04E110_rtc&assets=vv&assets=vh&tile_format=png&expression=0.03+%2B+log+%2810e-4+-+log+%280.05+%2F+%280.02+%2B+2+%2A+vv%29%29%29%3B0.05+%2B+exp+%280.25+%2A+%28log+%280.01+%2B+2+%2A+vv%29+%2B+log+%280.02+%2B+5+%2A+vh%29%29%29%3B1+-+log+%280.05+%2F+%280.045+-+0.9+%2A+vv%29%29&asset_as_band=True&rescale=0%2C.8000&rescale=0%2C1.000&rescale=0%2C1.000&format=png"
- type "image/png"
- title "Rendered preview"
- rel "preview"
roles [] 1 items
- 0 "overview"
bbox [] 4 items
- 0 87.3047776
- 1 26.92271674
- 2 90.0497508
- 3 28.84020573
stac_extensions [] 6 items
- 0 "https://stac-extensions.github.io/sar/v1.0.0/schema.json"
- 1 "https://stac-extensions.github.io/sat/v1.0.0/schema.json"
- 2 "https://stac-extensions.github.io/eo/v1.0.0/schema.json"
- 3 "https://stac-extensions.github.io/projection/v1.0.0/schema.json"
- 4 "https://stac-extensions.github.io/file/v2.0.0/schema.json"
- 5 "https://stac-extensions.github.io/raster/v1.1.0/schema.json"
- collection "sentinel-1-rtc"
55
- type "Feature"
- stac_version "1.0.0"
- id "S1A_IW_GRDH_1SDV_20211216T121357_20211216T121422_041034_04DFDD_rtc"
properties
- datetime "2021-12-16T12:14:09.596874Z"
- platform "SENTINEL-1A"
s1:shape [] 2 items
- 0 28242
- 1 21599
proj:bbox [] 4 items
- 0 420920.0
- 1 2916210.0
- 2 703340.0
- 3 3132200.0
- proj:epsg 32645
proj:shape [] 2 items
- 0 21599
- 1 28242
- end_datetime "2021-12-16 12:14:22.096009+00:00"
- constellation "Sentinel-1"
- s1:resolution "high"
proj:transform [] 9 items
- 0 10.0
- 1 0.0
- 2 420920.0
- 3 0.0
- 4 -10.0
- 5 3132200.0
- 6 0.0
- 7 0.0
- 8 1.0
- s1:datatake_id "319453"
- start_datetime "2021-12-16 12:13:57.097740+00:00"
- s1:orbit_source "PREORB"
- s1:slice_number "6"
- s1:total_slices "20"
- sar:looks_range 5
- sat:orbit_state "ascending"
- sar:product_type "GRD"
- sar:looks_azimuth 1
sar:polarizations [] 2 items
- 0 "VV"
- 1 "VH"
- sar:frequency_band "C"
- sat:absolute_orbit 41034
- sat:relative_orbit 12
- s1:processing_level "1"
- sar:instrument_mode "IW"
- sar:center_frequency 5.405
- sar:resolution_range 20
- s1:product_timeliness "Fast-24h"
- sar:resolution_azimuth 22
- sar:pixel_spacing_range 10
- sar:observation_direction "right"
- sar:pixel_spacing_azimuth 10
- sar:looks_equivalent_number 4.4
- s1:instrument_configuration_ID "7"
- sat:platform_international_designator "2014-016A"
geometry
- type "Polygon"
coordinates [] 1 items
0 [] 16 items
0 [] 2 items
- 0 87.8643319
- 1 26.5975309
1 [] 2 items
- 0 86.4988771
- 1 26.366414
2 [] 2 items
- 0 86.3551315
- 1 27.1612996
3 [] 2 items
- 0 86.3184713
- 1 27.2313639
4 [] 2 items
- 0 86.3267796
- 1 27.3776551
5 [] 2 items
- 0 86.2773714
- 1 27.4643442
6 [] 2 items
- 0 86.27067
- 1 27.6973974
7 [] 2 items
- 0 86.2161935
- 1 27.7561375
8 [] 2 items
- 0 86.2345875
- 1 27.7812457
9 [] 2 items
- 0 86.2099144
- 1 27.7825512
10 [] 2 items
- 0 86.2037615
- 1 27.8468787
11 [] 2 items
- 0 86.2107718
- 1 27.8815375
12 [] 2 items
- 0 88.7380481
- 1 28.2894289
13 [] 2 items
- 0 88.9224377
- 1 27.3275908
14 [] 2 items
- 0 88.9845667
- 1 26.7768085
15 [] 2 items
- 0 87.8643319
- 1 26.5975309
links [] 7 items
0
- rel "collection"
- href "https://planetarycomputer.microsoft.com/api/stac/v1/collections/sentinel-1-rtc"
- type "application/json"
1
- rel "parent"
- href "https://planetarycomputer.microsoft.com/api/stac/v1/collections/sentinel-1-rtc"
- type "application/json"
2
- rel "root"
- href "https://planetarycomputer.microsoft.com/api/stac/v1"
- type "application/json"
- title "Microsoft Planetary Computer STAC API"
3
- rel "self"
- href "https://planetarycomputer.microsoft.com/api/stac/v1/collections/sentinel-1-rtc/items/S1A_IW_GRDH_1SDV_20211216T121357_20211216T121422_041034_04DFDD_rtc"
- type "application/geo+json"
4
- rel "license"
- href "https://sentinel.esa.int/documents/247904/690755/Sentinel_Data_Legal_Notice"
5
- rel "derived_from"
- href "https://planetarycomputer.microsoft.com/api/stac/v1/collections/sentinel-1-grd/items/S1A_IW_GRDH_1SDV_20211216T121357_20211216T121422_041034_04DFDD"
- type "application/json"
- title "Sentinel 1 GRD Item"
6
- rel "preview"
- href "https://planetarycomputer.microsoft.com/api/data/v1/item/map?collection=sentinel-1-rtc&item=S1A_IW_GRDH_1SDV_20211216T121357_20211216T121422_041034_04DFDD_rtc"
- type "text/html"
- title "Map of item"
assets
vh
- href "https://sentinel1euwestrtc.blob.core.windows.net/sentinel1-grd-rtc/GRD/2021/12/16/IW/DV/S1A_IW_GRDH_1SDV_20211216T121357_20211216T121422_041034_04DFDD_D57B/measurement/iw-vh.rtc.tiff"
- type "image/tiff; application=geotiff; profile=cloud-optimized"
- title "VH: vertical transmit, horizontal receive"
- description "Terrain-corrected gamma naught values of signal transmitted with vertical polarization and received with horizontal polarization with radiometric terrain correction applied."
- file:size 1871629643
- file:checksum "0cf725f32f4d619c3e41a7197c79c4b2"
raster:bands [] 1 items
0
- nodata -32768
- data_type "float32"
- spatial_resolution 10.0
roles [] 1 items
- 0 "data"
vv
- href "https://sentinel1euwestrtc.blob.core.windows.net/sentinel1-grd-rtc/GRD/2021/12/16/IW/DV/S1A_IW_GRDH_1SDV_20211216T121357_20211216T121422_041034_04DFDD_D57B/measurement/iw-vv.rtc.tiff"
- type "image/tiff; application=geotiff; profile=cloud-optimized"
- title "VV: vertical transmit, vertical receive"
- description "Terrain-corrected gamma naught values of signal transmitted with vertical polarization and received with vertical polarization with radiometric terrain correction applied."
- file:size 1878560549
- file:checksum "997e6d72efec6d3232c6f44a6cea2d23"
raster:bands [] 1 items
0
- nodata -32768
- data_type "float32"
- spatial_resolution 10.0
roles [] 1 items
- 0 "data"
tilejson
- href "https://planetarycomputer.microsoft.com/api/data/v1/item/tilejson.json?collection=sentinel-1-rtc&item=S1A_IW_GRDH_1SDV_20211216T121357_20211216T121422_041034_04DFDD_rtc&assets=vv&assets=vh&tile_format=png&expression=0.03+%2B+log+%2810e-4+-+log+%280.05+%2F+%280.02+%2B+2+%2A+vv%29%29%29%3B0.05+%2B+exp+%280.25+%2A+%28log+%280.01+%2B+2+%2A+vv%29+%2B+log+%280.02+%2B+5+%2A+vh%29%29%29%3B1+-+log+%280.05+%2F+%280.045+-+0.9+%2A+vv%29%29&asset_as_band=True&rescale=0%2C.8000&rescale=0%2C1.000&rescale=0%2C1.000&format=png"
- type "application/json"
- title "TileJSON with default rendering"
roles [] 1 items
- 0 "tiles"
rendered_preview
- href "https://planetarycomputer.microsoft.com/api/data/v1/item/preview.png?collection=sentinel-1-rtc&item=S1A_IW_GRDH_1SDV_20211216T121357_20211216T121422_041034_04DFDD_rtc&assets=vv&assets=vh&tile_format=png&expression=0.03+%2B+log+%2810e-4+-+log+%280.05+%2F+%280.02+%2B+2+%2A+vv%29%29%29%3B0.05+%2B+exp+%280.25+%2A+%28log+%280.01+%2B+2+%2A+vv%29+%2B+log+%280.02+%2B+5+%2A+vh%29%29%29%3B1+-+log+%280.05+%2F+%280.045+-+0.9+%2A+vv%29%29&asset_as_band=True&rescale=0%2C.8000&rescale=0%2C1.000&rescale=0%2C1.000&format=png"
- type "image/png"
- title "Rendered preview"
- rel "preview"
roles [] 1 items
- 0 "overview"
bbox [] 4 items
- 0 86.20376146
- 1 26.36641397
- 2 88.9845667
- 3 28.28942888
stac_extensions [] 6 items
- 0 "https://stac-extensions.github.io/sar/v1.0.0/schema.json"
- 1 "https://stac-extensions.github.io/sat/v1.0.0/schema.json"
- 2 "https://stac-extensions.github.io/eo/v1.0.0/schema.json"
- 3 "https://stac-extensions.github.io/projection/v1.0.0/schema.json"
- 4 "https://stac-extensions.github.io/file/v2.0.0/schema.json"
- 5 "https://stac-extensions.github.io/raster/v1.1.0/schema.json"
- collection "sentinel-1-rtc"
56
- type "Feature"
- stac_version "1.0.0"
- id "S1A_IW_GRDH_1SDV_20211211T120550_20211211T120615_040961_04DD71_rtc"
properties
- datetime "2021-12-11T12:06:02.513966Z"
- platform "SENTINEL-1A"
s1:shape [] 2 items
- 0 28433
- 1 21971
proj:bbox [] 4 items
- 0 618070.0
- 1 2960440.0
- 2 902400.0
- 3 3180150.0
- proj:epsg 32645
proj:shape [] 2 items
- 0 21971
- 1 28433
- end_datetime "2021-12-11 12:06:15.013151+00:00"
- constellation "Sentinel-1"
- s1:resolution "high"
proj:transform [] 9 items
- 0 10.0
- 1 0.0
- 2 618070.0
- 3 0.0
- 4 -10.0
- 5 3180150.0
- 6 0.0
- 7 0.0
- 8 1.0
- s1:datatake_id "318833"
- start_datetime "2021-12-11 12:05:50.014780+00:00"
- s1:orbit_source "DOWNLINK"
- s1:slice_number "6"
- s1:total_slices "21"
- sar:looks_range 5
- sat:orbit_state "ascending"
- sar:product_type "GRD"
- sar:looks_azimuth 1
sar:polarizations [] 2 items
- 0 "VV"
- 1 "VH"
- sar:frequency_band "C"
- sat:absolute_orbit 40961
- sat:relative_orbit 114
- s1:processing_level "1"
- sar:instrument_mode "IW"
- sar:center_frequency 5.405
- sar:resolution_range 20
- s1:product_timeliness "Fast-24h"
- sar:resolution_azimuth 22
- sar:pixel_spacing_range 10
- sar:observation_direction "right"
- sar:pixel_spacing_azimuth 10
- sar:looks_equivalent_number 4.4
- s1:instrument_configuration_ID "7"
- sat:platform_international_designator "2014-016A"
geometry
- type "Polygon"
coordinates [] 1 items
0 [] 14 items
0 [] 2 items
- 0 89.9838668
- 1 27.0130092
1 [] 2 items
- 0 90.9926303
- 1 27.1728656
2 [] 2 items
- 0 90.7238303
- 1 28.6818537
3 [] 2 items
- 0 88.2163564
- 1 28.279684
4 [] 2 items
- 0 88.3534481
- 1 27.7232126
5 [] 2 items
- 0 88.3287421
- 1 27.5842656
6 [] 2 items
- 0 88.3752724
- 1 27.5218013
7 [] 2 items
- 0 88.3581551
- 1 27.3974033
8 [] 2 items
- 0 88.3992532
- 1 27.3361581
9 [] 2 items
- 0 88.3785276
- 1 27.3030558
10 [] 2 items
- 0 88.4155016
- 1 27.2066427
11 [] 2 items
- 0 88.4031317
- 1 27.0893282
12 [] 2 items
- 0 88.4741241
- 1 26.7595253
13 [] 2 items
- 0 89.9838668
- 1 27.0130092
links [] 7 items
0
- rel "collection"
- href "https://planetarycomputer.microsoft.com/api/stac/v1/collections/sentinel-1-rtc"
- type "application/json"
1
- rel "parent"
- href "https://planetarycomputer.microsoft.com/api/stac/v1/collections/sentinel-1-rtc"
- type "application/json"
2
- rel "root"
- href "https://planetarycomputer.microsoft.com/api/stac/v1"
- type "application/json"
- title "Microsoft Planetary Computer STAC API"
3
- rel "self"
- href "https://planetarycomputer.microsoft.com/api/stac/v1/collections/sentinel-1-rtc/items/S1A_IW_GRDH_1SDV_20211211T120550_20211211T120615_040961_04DD71_rtc"
- type "application/geo+json"
4
- rel "license"
- href "https://sentinel.esa.int/documents/247904/690755/Sentinel_Data_Legal_Notice"
5
- rel "derived_from"
- href "https://planetarycomputer.microsoft.com/api/stac/v1/collections/sentinel-1-grd/items/S1A_IW_GRDH_1SDV_20211211T120550_20211211T120615_040961_04DD71"
- type "application/json"
- title "Sentinel 1 GRD Item"
6
- rel "preview"
- href "https://planetarycomputer.microsoft.com/api/data/v1/item/map?collection=sentinel-1-rtc&item=S1A_IW_GRDH_1SDV_20211211T120550_20211211T120615_040961_04DD71_rtc"
- type "text/html"
- title "Map of item"
assets
vh
- href "https://sentinel1euwestrtc.blob.core.windows.net/sentinel1-grd-rtc/GRD/2021/12/11/IW/DV/S1A_IW_GRDH_1SDV_20211211T120550_20211211T120615_040961_04DD71_165F/measurement/iw-vh.rtc.tiff"
- type "image/tiff; application=geotiff; profile=cloud-optimized"
- title "VH: vertical transmit, horizontal receive"
- description "Terrain-corrected gamma naught values of signal transmitted with vertical polarization and received with horizontal polarization with radiometric terrain correction applied."
- file:size 1853315434
- file:checksum "11b5f08e0ce1d78ddaa1c86d0328c7e9"
raster:bands [] 1 items
0
- nodata -32768
- data_type "float32"
- spatial_resolution 10.0
roles [] 1 items
- 0 "data"
vv
- href "https://sentinel1euwestrtc.blob.core.windows.net/sentinel1-grd-rtc/GRD/2021/12/11/IW/DV/S1A_IW_GRDH_1SDV_20211211T120550_20211211T120615_040961_04DD71_165F/measurement/iw-vv.rtc.tiff"
- type "image/tiff; application=geotiff; profile=cloud-optimized"
- title "VV: vertical transmit, vertical receive"
- description "Terrain-corrected gamma naught values of signal transmitted with vertical polarization and received with vertical polarization with radiometric terrain correction applied."
- file:size 1859886753
- file:checksum "f2e77c86f3e92ee4c9a6047061b1c81c"
raster:bands [] 1 items
0
- nodata -32768
- data_type "float32"
- spatial_resolution 10.0
roles [] 1 items
- 0 "data"
tilejson
- href "https://planetarycomputer.microsoft.com/api/data/v1/item/tilejson.json?collection=sentinel-1-rtc&item=S1A_IW_GRDH_1SDV_20211211T120550_20211211T120615_040961_04DD71_rtc&assets=vv&assets=vh&tile_format=png&expression=0.03+%2B+log+%2810e-4+-+log+%280.05+%2F+%280.02+%2B+2+%2A+vv%29%29%29%3B0.05+%2B+exp+%280.25+%2A+%28log+%280.01+%2B+2+%2A+vv%29+%2B+log+%280.02+%2B+5+%2A+vh%29%29%29%3B1+-+log+%280.05+%2F+%280.045+-+0.9+%2A+vv%29%29&asset_as_band=True&rescale=0%2C.8000&rescale=0%2C1.000&rescale=0%2C1.000&format=png"
- type "application/json"
- title "TileJSON with default rendering"
roles [] 1 items
- 0 "tiles"
rendered_preview
- href "https://planetarycomputer.microsoft.com/api/data/v1/item/preview.png?collection=sentinel-1-rtc&item=S1A_IW_GRDH_1SDV_20211211T120550_20211211T120615_040961_04DD71_rtc&assets=vv&assets=vh&tile_format=png&expression=0.03+%2B+log+%2810e-4+-+log+%280.05+%2F+%280.02+%2B+2+%2A+vv%29%29%29%3B0.05+%2B+exp+%280.25+%2A+%28log+%280.01+%2B+2+%2A+vv%29+%2B+log+%280.02+%2B+5+%2A+vh%29%29%29%3B1+-+log+%280.05+%2F+%280.045+-+0.9+%2A+vv%29%29&asset_as_band=True&rescale=0%2C.8000&rescale=0%2C1.000&rescale=0%2C1.000&format=png"
- type "image/png"
- title "Rendered preview"
- rel "preview"
roles [] 1 items
- 0 "overview"
bbox [] 4 items
- 0 88.21635644
- 1 26.75952527
- 2 90.99263029
- 3 28.68185372
stac_extensions [] 6 items
- 0 "https://stac-extensions.github.io/sar/v1.0.0/schema.json"
- 1 "https://stac-extensions.github.io/sat/v1.0.0/schema.json"
- 2 "https://stac-extensions.github.io/eo/v1.0.0/schema.json"
- 3 "https://stac-extensions.github.io/projection/v1.0.0/schema.json"
- 4 "https://stac-extensions.github.io/file/v2.0.0/schema.json"
- 5 "https://stac-extensions.github.io/raster/v1.1.0/schema.json"
- collection "sentinel-1-rtc"
57
- type "Feature"
- stac_version "1.0.0"
- id "S1A_IW_GRDH_1SDV_20211207T000316_20211207T000341_040895_04DB21_rtc"
properties
- datetime "2021-12-07T00:03:28.568419Z"
- platform "SENTINEL-1A"
s1:shape [] 2 items
- 0 27541
- 1 21084
proj:bbox [] 4 items
- 0 524390.0
- 1 2980840.0
- 2 799800.0
- 3 3191680.0
- proj:epsg 32645
proj:shape [] 2 items
- 0 21084
- 1 27541
- end_datetime "2021-12-07 00:03:41.067903+00:00"
- constellation "Sentinel-1"
- s1:resolution "high"
proj:transform [] 9 items
- 0 10.0
- 1 0.0
- 2 524390.0
- 3 0.0
- 4 -10.0
- 5 3191680.0
- 6 0.0
- 7 0.0
- 8 1.0
- s1:datatake_id "318241"
- start_datetime "2021-12-07 00:03:16.068935+00:00"
- s1:orbit_source "DOWNLINK"
- s1:slice_number "12"
- s1:total_slices "17"
- sar:looks_range 5
- sat:orbit_state "descending"
- sar:product_type "GRD"
- sar:looks_azimuth 1
sar:polarizations [] 2 items
- 0 "VV"
- 1 "VH"
- sar:frequency_band "C"
- sat:absolute_orbit 40895
- sat:relative_orbit 48
- s1:processing_level "1"
- sar:instrument_mode "IW"
- sar:center_frequency 5.405
- sar:resolution_range 20
- s1:product_timeliness "Fast-24h"
- sar:resolution_azimuth 22
- sar:pixel_spacing_range 10
- sar:observation_direction "right"
- sar:pixel_spacing_azimuth 10
- sar:looks_equivalent_number 4.4
- s1:instrument_configuration_ID "7"
- sat:platform_international_designator "2014-016A"
geometry
- type "Polygon"
coordinates [] 1 items
0 [] 19 items
0 [] 2 items
- 0 89.8044169
- 1 27.0229253
1 [] 2 items
- 0 89.7773381
- 1 26.9950873
2 [] 2 items
- 0 89.7847721
- 1 26.9227167
3 [] 2 items
- 0 87.3048787
- 1 27.3295623
4 [] 2 items
- 0 87.4258951
- 1 28.1941675
5 [] 2 items
- 0 87.558533
- 1 28.8402049
6 [] 2 items
- 0 90.0497508
- 1 28.4417738
7 [] 2 items
- 0 90.026439
- 1 28.2911669
8 [] 2 items
- 0 89.9733406
- 1 28.191849
9 [] 2 items
- 0 89.9978829
- 1 28.148287
10 [] 2 items
- 0 89.9712875
- 1 28.0843713
11 [] 2 items
- 0 89.9877134
- 1 28.0016586
12 [] 2 items
- 0 89.9444494
- 1 27.9504536
13 [] 2 items
- 0 89.9294684
- 1 27.8243024
14 [] 2 items
- 0 89.9526158
- 1 27.6783035
15 [] 2 items
- 0 89.9219145
- 1 27.6326771
16 [] 2 items
- 0 89.9033415
- 1 27.4311724
17 [] 2 items
- 0 89.8292912
- 1 27.2746356
18 [] 2 items
- 0 89.8044169
- 1 27.0229253
links [] 7 items
0
- rel "collection"
- href "https://planetarycomputer.microsoft.com/api/stac/v1/collections/sentinel-1-rtc"
- type "application/json"
1
- rel "parent"
- href "https://planetarycomputer.microsoft.com/api/stac/v1/collections/sentinel-1-rtc"
- type "application/json"
2
- rel "root"
- href "https://planetarycomputer.microsoft.com/api/stac/v1"
- type "application/json"
- title "Microsoft Planetary Computer STAC API"
3
- rel "self"
- href "https://planetarycomputer.microsoft.com/api/stac/v1/collections/sentinel-1-rtc/items/S1A_IW_GRDH_1SDV_20211207T000316_20211207T000341_040895_04DB21_rtc"
- type "application/geo+json"
4
- rel "license"
- href "https://sentinel.esa.int/documents/247904/690755/Sentinel_Data_Legal_Notice"
5
- rel "derived_from"
- href "https://planetarycomputer.microsoft.com/api/stac/v1/collections/sentinel-1-grd/items/S1A_IW_GRDH_1SDV_20211207T000316_20211207T000341_040895_04DB21"
- type "application/json"
- title "Sentinel 1 GRD Item"
6
- rel "preview"
- href "https://planetarycomputer.microsoft.com/api/data/v1/item/map?collection=sentinel-1-rtc&item=S1A_IW_GRDH_1SDV_20211207T000316_20211207T000341_040895_04DB21_rtc"
- type "text/html"
- title "Map of item"
assets
vh
- href "https://sentinel1euwestrtc.blob.core.windows.net/sentinel1-grd-rtc/GRD/2021/12/7/IW/DV/S1A_IW_GRDH_1SDV_20211207T000316_20211207T000341_040895_04DB21_2B97/measurement/iw-vh.rtc.tiff"
- type "image/tiff; application=geotiff; profile=cloud-optimized"
- title "VH: vertical transmit, horizontal receive"
- description "Terrain-corrected gamma naught values of signal transmitted with vertical polarization and received with horizontal polarization with radiometric terrain correction applied."
- file:size 1841189135
- file:checksum "c877550a9de463f58ff32a3a11778c54"
raster:bands [] 1 items
0
- nodata -32768
- data_type "float32"
- spatial_resolution 10.0
roles [] 1 items
- 0 "data"
vv
- href "https://sentinel1euwestrtc.blob.core.windows.net/sentinel1-grd-rtc/GRD/2021/12/7/IW/DV/S1A_IW_GRDH_1SDV_20211207T000316_20211207T000341_040895_04DB21_2B97/measurement/iw-vv.rtc.tiff"
- type "image/tiff; application=geotiff; profile=cloud-optimized"
- title "VV: vertical transmit, vertical receive"
- description "Terrain-corrected gamma naught values of signal transmitted with vertical polarization and received with vertical polarization with radiometric terrain correction applied."
- file:size 1847439958
- file:checksum "9fcb36ebcce2ef6ab7dcf9013bb58681"
raster:bands [] 1 items
0
- nodata -32768
- data_type "float32"
- spatial_resolution 10.0
roles [] 1 items
- 0 "data"
tilejson
- href "https://planetarycomputer.microsoft.com/api/data/v1/item/tilejson.json?collection=sentinel-1-rtc&item=S1A_IW_GRDH_1SDV_20211207T000316_20211207T000341_040895_04DB21_rtc&assets=vv&assets=vh&tile_format=png&expression=0.03+%2B+log+%2810e-4+-+log+%280.05+%2F+%280.02+%2B+2+%2A+vv%29%29%29%3B0.05+%2B+exp+%280.25+%2A+%28log+%280.01+%2B+2+%2A+vv%29+%2B+log+%280.02+%2B+5+%2A+vh%29%29%29%3B1+-+log+%280.05+%2F+%280.045+-+0.9+%2A+vv%29%29&asset_as_band=True&rescale=0%2C.8000&rescale=0%2C1.000&rescale=0%2C1.000&format=png"
- type "application/json"
- title "TileJSON with default rendering"
roles [] 1 items
- 0 "tiles"
rendered_preview
- href "https://planetarycomputer.microsoft.com/api/data/v1/item/preview.png?collection=sentinel-1-rtc&item=S1A_IW_GRDH_1SDV_20211207T000316_20211207T000341_040895_04DB21_rtc&assets=vv&assets=vh&tile_format=png&expression=0.03+%2B+log+%2810e-4+-+log+%280.05+%2F+%280.02+%2B+2+%2A+vv%29%29%29%3B0.05+%2B+exp+%280.25+%2A+%28log+%280.01+%2B+2+%2A+vv%29+%2B+log+%280.02+%2B+5+%2A+vh%29%29%29%3B1+-+log+%280.05+%2F+%280.045+-+0.9+%2A+vv%29%29&asset_as_band=True&rescale=0%2C.8000&rescale=0%2C1.000&rescale=0%2C1.000&format=png"
- type "image/png"
- title "Rendered preview"
- rel "preview"
roles [] 1 items
- 0 "overview"
bbox [] 4 items
- 0 87.30487868
- 1 26.92271674
- 2 90.0497508
- 3 28.84020488
stac_extensions [] 6 items
- 0 "https://stac-extensions.github.io/sar/v1.0.0/schema.json"
- 1 "https://stac-extensions.github.io/sat/v1.0.0/schema.json"
- 2 "https://stac-extensions.github.io/eo/v1.0.0/schema.json"
- 3 "https://stac-extensions.github.io/projection/v1.0.0/schema.json"
- 4 "https://stac-extensions.github.io/file/v2.0.0/schema.json"
- 5 "https://stac-extensions.github.io/raster/v1.1.0/schema.json"
- collection "sentinel-1-rtc"
58
- type "Feature"
- stac_version "1.0.0"
- id "S1A_IW_GRDH_1SDV_20211204T121357_20211204T121422_040859_04D9E8_rtc"
properties
- datetime "2021-12-04T12:14:10.007158Z"
- platform "SENTINEL-1A"
s1:shape [] 2 items
- 0 28242
- 1 21600
proj:bbox [] 4 items
- 0 420930.0
- 1 2916210.0
- 2 703350.0
- 3 3132210.0
- proj:epsg 32645
proj:shape [] 2 items
- 0 21600
- 1 28242
- end_datetime "2021-12-04 12:14:22.507027+00:00"
- constellation "Sentinel-1"
- s1:resolution "high"
proj:transform [] 9 items
- 0 10.0
- 1 0.0
- 2 420930.0
- 3 0.0
- 4 -10.0
- 5 3132210.0
- 6 0.0
- 7 0.0
- 8 1.0
- s1:datatake_id "317928"
- start_datetime "2021-12-04 12:13:57.507290+00:00"
- s1:orbit_source "DOWNLINK"
- s1:slice_number "6"
- s1:total_slices "20"
- sar:looks_range 5
- sat:orbit_state "ascending"
- sar:product_type "GRD"
- sar:looks_azimuth 1
sar:polarizations [] 2 items
- 0 "VV"
- 1 "VH"
- sar:frequency_band "C"
- sat:absolute_orbit 40859
- sat:relative_orbit 12
- s1:processing_level "1"
- sar:instrument_mode "IW"
- sar:center_frequency 5.405
- sar:resolution_range 20
- s1:product_timeliness "Fast-24h"
- sar:resolution_azimuth 22
- sar:pixel_spacing_range 10
- sar:observation_direction "right"
- sar:pixel_spacing_azimuth 10
- sar:looks_equivalent_number 4.4
- s1:instrument_configuration_ID "7"
- sat:platform_international_designator "2014-016A"
geometry
- type "Polygon"
coordinates [] 1 items
0 [] 16 items
0 [] 2 items
- 0 87.8649351
- 1 26.5976175
1 [] 2 items
- 0 86.4989773
- 1 26.3664143
2 [] 2 items
- 0 86.355233
- 1 27.1612098
3 [] 2 items
- 0 86.3185728
- 1 27.2312742
4 [] 2 items
- 0 86.3268807
- 1 27.3776556
5 [] 2 items
- 0 86.277472
- 1 27.464435
6 [] 2 items
- 0 86.2706688
- 1 27.6975779
7 [] 2 items
- 0 86.2161922
- 1 27.756318
8 [] 2 items
- 0 86.2345856
- 1 27.7815165
9 [] 2 items
- 0 86.2099124
- 1 27.782822
10 [] 2 items
- 0 86.203863
- 1 27.8468793
11 [] 2 items
- 0 86.2107711
- 1 27.8816277
12 [] 2 items
- 0 88.7381515
- 1 28.2895178
13 [] 2 items
- 0 88.9224423
- 1 27.3278615
14 [] 2 items
- 0 88.9846672
- 1 26.7768071
15 [] 2 items
- 0 87.8649351
- 1 26.5976175
links [] 7 items
0
- rel "collection"
- href "https://planetarycomputer.microsoft.com/api/stac/v1/collections/sentinel-1-rtc"
- type "application/json"
1
- rel "parent"
- href "https://planetarycomputer.microsoft.com/api/stac/v1/collections/sentinel-1-rtc"
- type "application/json"
2
- rel "root"
- href "https://planetarycomputer.microsoft.com/api/stac/v1"
- type "application/json"
- title "Microsoft Planetary Computer STAC API"
3
- rel "self"
- href "https://planetarycomputer.microsoft.com/api/stac/v1/collections/sentinel-1-rtc/items/S1A_IW_GRDH_1SDV_20211204T121357_20211204T121422_040859_04D9E8_rtc"
- type "application/geo+json"
4
- rel "license"
- href "https://sentinel.esa.int/documents/247904/690755/Sentinel_Data_Legal_Notice"
5
- rel "derived_from"
- href "https://planetarycomputer.microsoft.com/api/stac/v1/collections/sentinel-1-grd/items/S1A_IW_GRDH_1SDV_20211204T121357_20211204T121422_040859_04D9E8"
- type "application/json"
- title "Sentinel 1 GRD Item"
6
- rel "preview"
- href "https://planetarycomputer.microsoft.com/api/data/v1/item/map?collection=sentinel-1-rtc&item=S1A_IW_GRDH_1SDV_20211204T121357_20211204T121422_040859_04D9E8_rtc"
- type "text/html"
- title "Map of item"
assets
vh
- href "https://sentinel1euwestrtc.blob.core.windows.net/sentinel1-grd-rtc/GRD/2021/12/4/IW/DV/S1A_IW_GRDH_1SDV_20211204T121357_20211204T121422_040859_04D9E8_B9B1/measurement/iw-vh.rtc.tiff"
- type "image/tiff; application=geotiff; profile=cloud-optimized"
- title "VH: vertical transmit, horizontal receive"
- description "Terrain-corrected gamma naught values of signal transmitted with vertical polarization and received with horizontal polarization with radiometric terrain correction applied."
- file:size 1871334511
- file:checksum "a9f6c7c36f4c05d02c781c5831e0e475"
raster:bands [] 1 items
0
- nodata -32768
- data_type "float32"
- spatial_resolution 10.0
roles [] 1 items
- 0 "data"
vv
- href "https://sentinel1euwestrtc.blob.core.windows.net/sentinel1-grd-rtc/GRD/2021/12/4/IW/DV/S1A_IW_GRDH_1SDV_20211204T121357_20211204T121422_040859_04D9E8_B9B1/measurement/iw-vv.rtc.tiff"
- type "image/tiff; application=geotiff; profile=cloud-optimized"
- title "VV: vertical transmit, vertical receive"
- description "Terrain-corrected gamma naught values of signal transmitted with vertical polarization and received with vertical polarization with radiometric terrain correction applied."
- file:size 1878924621
- file:checksum "3c0a4474c2201947f0edfa6e659345fd"
raster:bands [] 1 items
0
- nodata -32768
- data_type "float32"
- spatial_resolution 10.0
roles [] 1 items
- 0 "data"
tilejson
- href "https://planetarycomputer.microsoft.com/api/data/v1/item/tilejson.json?collection=sentinel-1-rtc&item=S1A_IW_GRDH_1SDV_20211204T121357_20211204T121422_040859_04D9E8_rtc&assets=vv&assets=vh&tile_format=png&expression=0.03+%2B+log+%2810e-4+-+log+%280.05+%2F+%280.02+%2B+2+%2A+vv%29%29%29%3B0.05+%2B+exp+%280.25+%2A+%28log+%280.01+%2B+2+%2A+vv%29+%2B+log+%280.02+%2B+5+%2A+vh%29%29%29%3B1+-+log+%280.05+%2F+%280.045+-+0.9+%2A+vv%29%29&asset_as_band=True&rescale=0%2C.8000&rescale=0%2C1.000&rescale=0%2C1.000&format=png"
- type "application/json"
- title "TileJSON with default rendering"
roles [] 1 items
- 0 "tiles"
rendered_preview
- href "https://planetarycomputer.microsoft.com/api/data/v1/item/preview.png?collection=sentinel-1-rtc&item=S1A_IW_GRDH_1SDV_20211204T121357_20211204T121422_040859_04D9E8_rtc&assets=vv&assets=vh&tile_format=png&expression=0.03+%2B+log+%2810e-4+-+log+%280.05+%2F+%280.02+%2B+2+%2A+vv%29%29%29%3B0.05+%2B+exp+%280.25+%2A+%28log+%280.01+%2B+2+%2A+vv%29+%2B+log+%280.02+%2B+5+%2A+vh%29%29%29%3B1+-+log+%280.05+%2F+%280.045+-+0.9+%2A+vv%29%29&asset_as_band=True&rescale=0%2C.8000&rescale=0%2C1.000&rescale=0%2C1.000&format=png"
- type "image/png"
- title "Rendered preview"
- rel "preview"
roles [] 1 items
- 0 "overview"
bbox [] 4 items
- 0 86.20386301
- 1 26.36641432
- 2 88.98466723
- 3 28.28951781
stac_extensions [] 6 items
- 0 "https://stac-extensions.github.io/sar/v1.0.0/schema.json"
- 1 "https://stac-extensions.github.io/sat/v1.0.0/schema.json"
- 2 "https://stac-extensions.github.io/eo/v1.0.0/schema.json"
- 3 "https://stac-extensions.github.io/projection/v1.0.0/schema.json"
- 4 "https://stac-extensions.github.io/file/v2.0.0/schema.json"
- 5 "https://stac-extensions.github.io/raster/v1.1.0/schema.json"
- collection "sentinel-1-rtc"
59
- type "Feature"
- stac_version "1.0.0"
- id "S1A_IW_GRDH_1SDV_20211129T120550_20211129T120615_040786_04D761_rtc"
properties
- datetime "2021-11-29T12:06:03.035677Z"
- platform "SENTINEL-1A"
s1:shape [] 2 items
- 0 28430
- 1 21971
proj:bbox [] 4 items
- 0 618130.0
- 1 2960440.0
- 2 902430.0
- 3 3180150.0
- proj:epsg 32645
proj:shape [] 2 items
- 0 21971
- 1 28430
- end_datetime "2021-11-29 12:06:15.534838+00:00"
- constellation "Sentinel-1"
- s1:resolution "high"
proj:transform [] 9 items
- 0 10.0
- 1 0.0
- 2 618130.0
- 3 0.0
- 4 -10.0
- 5 3180150.0
- 6 0.0
- 7 0.0
- 8 1.0
- s1:datatake_id "317281"
- start_datetime "2021-11-29 12:05:50.536515+00:00"
- s1:orbit_source "DOWNLINK"
- s1:slice_number "6"
- s1:total_slices "21"
- sar:looks_range 5
- sat:orbit_state "ascending"
- sar:product_type "GRD"
- sar:looks_azimuth 1
sar:polarizations [] 2 items
- 0 "VV"
- 1 "VH"
- sar:frequency_band "C"
- sat:absolute_orbit 40786
- sat:relative_orbit 114
- s1:processing_level "1"
- sar:instrument_mode "IW"
- sar:center_frequency 5.405
- sar:resolution_range 20
- s1:product_timeliness "Fast-24h"
- sar:resolution_azimuth 22
- sar:pixel_spacing_range 10
- sar:observation_direction "right"
- sar:pixel_spacing_azimuth 10
- sar:looks_equivalent_number 4.4
- s1:instrument_configuration_ID "7"
- sat:platform_international_designator "2014-016A"
geometry
- type "Polygon"
coordinates [] 1 items
0 [] 14 items
0 [] 2 items
- 0 89.9819422
- 1 27.0125989
1 [] 2 items
- 0 90.9932345
- 1 27.1728484
2 [] 2 items
- 0 90.724341
- 1 28.6818397
3 [] 2 items
- 0 88.2169692
- 1 28.2797688
4 [] 2 items
- 0 88.3541558
- 1 27.7230252
5 [] 2 items
- 0 88.3292497
- 1 27.584351
6 [] 2 items
- 0 88.3757808
- 1 27.5219768
7 [] 2 items
- 0 88.3573861
- 1 27.4089649
8 [] 2 items
- 0 88.399762
- 1 27.3364238
9 [] 2 items
- 0 88.3788285
- 1 27.3028723
10 [] 2 items
- 0 88.4158044
- 1 27.2066396
11 [] 2 items
- 0 88.4036381
- 1 27.0895037
12 [] 2 items
- 0 88.4747274
- 1 26.759519
13 [] 2 items
- 0 89.9819422
- 1 27.0125989
links [] 7 items
0
- rel "collection"
- href "https://planetarycomputer.microsoft.com/api/stac/v1/collections/sentinel-1-rtc"
- type "application/json"
1
- rel "parent"
- href "https://planetarycomputer.microsoft.com/api/stac/v1/collections/sentinel-1-rtc"
- type "application/json"
2
- rel "root"
- href "https://planetarycomputer.microsoft.com/api/stac/v1"
- type "application/json"
- title "Microsoft Planetary Computer STAC API"
3
- rel "self"
- href "https://planetarycomputer.microsoft.com/api/stac/v1/collections/sentinel-1-rtc/items/S1A_IW_GRDH_1SDV_20211129T120550_20211129T120615_040786_04D761_rtc"
- type "application/geo+json"
4
- rel "license"
- href "https://sentinel.esa.int/documents/247904/690755/Sentinel_Data_Legal_Notice"
5
- rel "derived_from"
- href "https://planetarycomputer.microsoft.com/api/stac/v1/collections/sentinel-1-grd/items/S1A_IW_GRDH_1SDV_20211129T120550_20211129T120615_040786_04D761"
- type "application/json"
- title "Sentinel 1 GRD Item"
6
- rel "preview"
- href "https://planetarycomputer.microsoft.com/api/data/v1/item/map?collection=sentinel-1-rtc&item=S1A_IW_GRDH_1SDV_20211129T120550_20211129T120615_040786_04D761_rtc"
- type "text/html"
- title "Map of item"
assets
vh
- href "https://sentinel1euwestrtc.blob.core.windows.net/sentinel1-grd-rtc/GRD/2021/11/29/IW/DV/S1A_IW_GRDH_1SDV_20211129T120550_20211129T120615_040786_04D761_08C0/measurement/iw-vh.rtc.tiff"
- type "image/tiff; application=geotiff; profile=cloud-optimized"
- title "VH: vertical transmit, horizontal receive"
- description "Terrain-corrected gamma naught values of signal transmitted with vertical polarization and received with horizontal polarization with radiometric terrain correction applied."
- file:size 1853191760
- file:checksum "f686c8b13f6634b231b067ae6e7adf4a"
raster:bands [] 1 items
0
- nodata -32768
- data_type "float32"
- spatial_resolution 10.0
roles [] 1 items
- 0 "data"
vv
- href "https://sentinel1euwestrtc.blob.core.windows.net/sentinel1-grd-rtc/GRD/2021/11/29/IW/DV/S1A_IW_GRDH_1SDV_20211129T120550_20211129T120615_040786_04D761_08C0/measurement/iw-vv.rtc.tiff"
- type "image/tiff; application=geotiff; profile=cloud-optimized"
- title "VV: vertical transmit, vertical receive"
- description "Terrain-corrected gamma naught values of signal transmitted with vertical polarization and received with vertical polarization with radiometric terrain correction applied."
- file:size 1860107120
- file:checksum "991799f593a0f389e89f5b2f229976f5"
raster:bands [] 1 items
0
- nodata -32768
- data_type "float32"
- spatial_resolution 10.0
roles [] 1 items
- 0 "data"
tilejson
- href "https://planetarycomputer.microsoft.com/api/data/v1/item/tilejson.json?collection=sentinel-1-rtc&item=S1A_IW_GRDH_1SDV_20211129T120550_20211129T120615_040786_04D761_rtc&assets=vv&assets=vh&tile_format=png&expression=0.03+%2B+log+%2810e-4+-+log+%280.05+%2F+%280.02+%2B+2+%2A+vv%29%29%29%3B0.05+%2B+exp+%280.25+%2A+%28log+%280.01+%2B+2+%2A+vv%29+%2B+log+%280.02+%2B+5+%2A+vh%29%29%29%3B1+-+log+%280.05+%2F+%280.045+-+0.9+%2A+vv%29%29&asset_as_band=True&rescale=0%2C.8000&rescale=0%2C1.000&rescale=0%2C1.000&format=png"
- type "application/json"
- title "TileJSON with default rendering"
roles [] 1 items
- 0 "tiles"
rendered_preview
- href "https://planetarycomputer.microsoft.com/api/data/v1/item/preview.png?collection=sentinel-1-rtc&item=S1A_IW_GRDH_1SDV_20211129T120550_20211129T120615_040786_04D761_rtc&assets=vv&assets=vh&tile_format=png&expression=0.03+%2B+log+%2810e-4+-+log+%280.05+%2F+%280.02+%2B+2+%2A+vv%29%29%29%3B0.05+%2B+exp+%280.25+%2A+%28log+%280.01+%2B+2+%2A+vv%29+%2B+log+%280.02+%2B+5+%2A+vh%29%29%29%3B1+-+log+%280.05+%2F+%280.045+-+0.9+%2A+vv%29%29&asset_as_band=True&rescale=0%2C.8000&rescale=0%2C1.000&rescale=0%2C1.000&format=png"
- type "image/png"
- title "Rendered preview"
- rel "preview"
roles [] 1 items
- 0 "overview"
bbox [] 4 items
- 0 88.21696915
- 1 26.75951899
- 2 90.99323449
- 3 28.68183965
stac_extensions [] 6 items
- 0 "https://stac-extensions.github.io/sar/v1.0.0/schema.json"
- 1 "https://stac-extensions.github.io/sat/v1.0.0/schema.json"
- 2 "https://stac-extensions.github.io/eo/v1.0.0/schema.json"
- 3 "https://stac-extensions.github.io/projection/v1.0.0/schema.json"
- 4 "https://stac-extensions.github.io/file/v2.0.0/schema.json"
- 5 "https://stac-extensions.github.io/raster/v1.1.0/schema.json"
- collection "sentinel-1-rtc"
60
- type "Feature"
- stac_version "1.0.0"
- id "S1A_IW_GRDH_1SDV_20211125T000316_20211125T000341_040720_04D50E_rtc"
properties
- datetime "2021-11-25T00:03:29.120003Z"
- platform "SENTINEL-1A"
s1:shape [] 2 items
- 0 27541
- 1 21084
proj:bbox [] 4 items
- 0 524380.0
- 1 2980840.0
- 2 799790.0
- 3 3191680.0
- proj:epsg 32645
proj:shape [] 2 items
- 0 21084
- 1 27541
- end_datetime "2021-11-25 00:03:41.619475+00:00"
- constellation "Sentinel-1"
- s1:resolution "high"
proj:transform [] 9 items
- 0 10.0
- 1 0.0
- 2 524380.0
- 3 0.0
- 4 -10.0
- 5 3191680.0
- 6 0.0
- 7 0.0
- 8 1.0
- s1:datatake_id "316686"
- start_datetime "2021-11-25 00:03:16.620531+00:00"
- s1:orbit_source "DOWNLINK"
- s1:slice_number "12"
- s1:total_slices "17"
- sar:looks_range 5
- sat:orbit_state "descending"
- sar:product_type "GRD"
- sar:looks_azimuth 1
sar:polarizations [] 2 items
- 0 "VV"
- 1 "VH"
- sar:frequency_band "C"
- sat:absolute_orbit 40720
- sat:relative_orbit 48
- s1:processing_level "1"
- sar:instrument_mode "IW"
- sar:center_frequency 5.405
- sar:resolution_range 20
- s1:product_timeliness "Fast-24h"
- sar:resolution_azimuth 22
- sar:pixel_spacing_range 10
- sar:observation_direction "right"
- sar:pixel_spacing_azimuth 10
- sar:looks_equivalent_number 4.4
- s1:instrument_configuration_ID "7"
- sat:platform_international_designator "2014-016A"
geometry
- type "Polygon"
coordinates [] 1 items
0 [] 19 items
0 [] 2 items
- 0 89.8042133
- 1 27.0228392
1 [] 2 items
- 0 89.7770383
- 1 26.9951834
2 [] 2 items
- 0 89.7843697
- 1 26.9227247
3 [] 2 items
- 0 87.3047776
- 1 27.3295626
4 [] 2 items
- 0 87.4256899
- 1 28.193807
5 [] 2 items
- 0 87.5582255
- 1 28.8402062
6 [] 2 items
- 0 90.0497482
- 1 28.4416837
7 [] 2 items
- 0 90.0262302
- 1 28.2909911
8 [] 2 items
- 0 89.9732389
- 1 28.1918512
9 [] 2 items
- 0 89.9977812
- 1 28.1482892
10 [] 2 items
- 0 89.9711833
- 1 28.0842833
11 [] 2 items
- 0 89.9875127
- 1 28.0017531
12 [] 2 items
- 0 89.9442464
- 1 27.9504579
13 [] 2 items
- 0 89.9292632
- 1 27.8242165
14 [] 2 items
- 0 89.9525169
- 1 27.6783958
15 [] 2 items
- 0 89.9217048
- 1 27.6324109
16 [] 2 items
- 0 89.9030384
- 1 27.4311787
17 [] 2 items
- 0 89.8291903
- 1 27.2746376
18 [] 2 items
- 0 89.8042133
- 1 27.0228392
links [] 7 items
0
- rel "collection"
- href "https://planetarycomputer.microsoft.com/api/stac/v1/collections/sentinel-1-rtc"
- type "application/json"
1
- rel "parent"
- href "https://planetarycomputer.microsoft.com/api/stac/v1/collections/sentinel-1-rtc"
- type "application/json"
2
- rel "root"
- href "https://planetarycomputer.microsoft.com/api/stac/v1"
- type "application/json"
- title "Microsoft Planetary Computer STAC API"
3
- rel "self"
- href "https://planetarycomputer.microsoft.com/api/stac/v1/collections/sentinel-1-rtc/items/S1A_IW_GRDH_1SDV_20211125T000316_20211125T000341_040720_04D50E_rtc"
- type "application/geo+json"
4
- rel "license"
- href "https://sentinel.esa.int/documents/247904/690755/Sentinel_Data_Legal_Notice"
5
- rel "derived_from"
- href "https://planetarycomputer.microsoft.com/api/stac/v1/collections/sentinel-1-grd/items/S1A_IW_GRDH_1SDV_20211125T000316_20211125T000341_040720_04D50E"
- type "application/json"
- title "Sentinel 1 GRD Item"
6
- rel "preview"
- href "https://planetarycomputer.microsoft.com/api/data/v1/item/map?collection=sentinel-1-rtc&item=S1A_IW_GRDH_1SDV_20211125T000316_20211125T000341_040720_04D50E_rtc"
- type "text/html"
- title "Map of item"
assets
vh
- href "https://sentinel1euwestrtc.blob.core.windows.net/sentinel1-grd-rtc/GRD/2021/11/25/IW/DV/S1A_IW_GRDH_1SDV_20211125T000316_20211125T000341_040720_04D50E_5D0E/measurement/iw-vh.rtc.tiff"
- type "image/tiff; application=geotiff; profile=cloud-optimized"
- title "VH: vertical transmit, horizontal receive"
- description "Terrain-corrected gamma naught values of signal transmitted with vertical polarization and received with horizontal polarization with radiometric terrain correction applied."
- file:size 1840989028
- file:checksum "4c940df17f6b98c705b47c1ceaf5a492"
raster:bands [] 1 items
0
- nodata -32768
- data_type "float32"
- spatial_resolution 10.0
roles [] 1 items
- 0 "data"
vv
- href "https://sentinel1euwestrtc.blob.core.windows.net/sentinel1-grd-rtc/GRD/2021/11/25/IW/DV/S1A_IW_GRDH_1SDV_20211125T000316_20211125T000341_040720_04D50E_5D0E/measurement/iw-vv.rtc.tiff"
- type "image/tiff; application=geotiff; profile=cloud-optimized"
- title "VV: vertical transmit, vertical receive"
- description "Terrain-corrected gamma naught values of signal transmitted with vertical polarization and received with vertical polarization with radiometric terrain correction applied."
- file:size 1847405525
- file:checksum "b9e4f8bd6ec911f274eea0adc48374af"
raster:bands [] 1 items
0
- nodata -32768
- data_type "float32"
- spatial_resolution 10.0
roles [] 1 items
- 0 "data"
tilejson
- href "https://planetarycomputer.microsoft.com/api/data/v1/item/tilejson.json?collection=sentinel-1-rtc&item=S1A_IW_GRDH_1SDV_20211125T000316_20211125T000341_040720_04D50E_rtc&assets=vv&assets=vh&tile_format=png&expression=0.03+%2B+log+%2810e-4+-+log+%280.05+%2F+%280.02+%2B+2+%2A+vv%29%29%29%3B0.05+%2B+exp+%280.25+%2A+%28log+%280.01+%2B+2+%2A+vv%29+%2B+log+%280.02+%2B+5+%2A+vh%29%29%29%3B1+-+log+%280.05+%2F+%280.045+-+0.9+%2A+vv%29%29&asset_as_band=True&rescale=0%2C.8000&rescale=0%2C1.000&rescale=0%2C1.000&format=png"
- type "application/json"
- title "TileJSON with default rendering"
roles [] 1 items
- 0 "tiles"
rendered_preview
- href "https://planetarycomputer.microsoft.com/api/data/v1/item/preview.png?collection=sentinel-1-rtc&item=S1A_IW_GRDH_1SDV_20211125T000316_20211125T000341_040720_04D50E_rtc&assets=vv&assets=vh&tile_format=png&expression=0.03+%2B+log+%2810e-4+-+log+%280.05+%2F+%280.02+%2B+2+%2A+vv%29%29%29%3B0.05+%2B+exp+%280.25+%2A+%28log+%280.01+%2B+2+%2A+vv%29+%2B+log+%280.02+%2B+5+%2A+vh%29%29%29%3B1+-+log+%280.05+%2F+%280.045+-+0.9+%2A+vv%29%29&asset_as_band=True&rescale=0%2C.8000&rescale=0%2C1.000&rescale=0%2C1.000&format=png"
- type "image/png"
- title "Rendered preview"
- rel "preview"
roles [] 1 items
- 0 "overview"
bbox [] 4 items
- 0 87.3047776
- 1 26.92272468
- 2 90.04974821
- 3 28.84020615
stac_extensions [] 6 items
- 0 "https://stac-extensions.github.io/sar/v1.0.0/schema.json"
- 1 "https://stac-extensions.github.io/sat/v1.0.0/schema.json"
- 2 "https://stac-extensions.github.io/eo/v1.0.0/schema.json"
- 3 "https://stac-extensions.github.io/projection/v1.0.0/schema.json"
- 4 "https://stac-extensions.github.io/file/v2.0.0/schema.json"
- 5 "https://stac-extensions.github.io/raster/v1.1.0/schema.json"
- collection "sentinel-1-rtc"
61
- type "Feature"
- stac_version "1.0.0"
- id "S1A_IW_GRDH_1SDV_20211122T121358_20211122T121423_040684_04D3CC_rtc"
properties
- datetime "2021-11-22T12:14:10.576899Z"
- platform "SENTINEL-1A"
s1:shape [] 2 items
- 0 28174
- 1 21599
proj:bbox [] 4 items
- 0 421550.0
- 1 2916220.0
- 2 703290.0
- 3 3132210.0
- proj:epsg 32645
proj:shape [] 2 items
- 0 21599
- 1 28174
- end_datetime "2021-11-22 12:14:23.076767+00:00"
- constellation "Sentinel-1"
- s1:resolution "high"
proj:transform [] 9 items
- 0 10.0
- 1 0.0
- 2 421550.0
- 3 0.0
- 4 -10.0
- 5 3132210.0
- 6 0.0
- 7 0.0
- 8 1.0
- s1:datatake_id "316364"
- start_datetime "2021-11-22 12:13:58.077031+00:00"
- s1:orbit_source "DOWNLINK"
- s1:slice_number "6"
- s1:total_slices "20"
- sar:looks_range 5
- sat:orbit_state "ascending"
- sar:product_type "GRD"
- sar:looks_azimuth 1
sar:polarizations [] 2 items
- 0 "VV"
- 1 "VH"
- sar:frequency_band "C"
- sat:absolute_orbit 40684
- sat:relative_orbit 12
- s1:processing_level "1"
- sar:instrument_mode "IW"
- sar:center_frequency 5.405
- sar:resolution_range 20
- s1:product_timeliness "Fast-24h"
- sar:resolution_azimuth 22
- sar:pixel_spacing_range 10
- sar:observation_direction "right"
- sar:pixel_spacing_azimuth 10
- sar:looks_equivalent_number 4.4
- s1:instrument_configuration_ID "7"
- sat:platform_international_designator "2014-016A"
geometry
- type "Polygon"
coordinates [] 1 items
0 [] 15 items
0 [] 2 items
- 0 86.2032553
- 1 27.8466501
1 [] 2 items
- 0 86.2105673
- 1 27.8817168
2 [] 2 items
- 0 88.7374379
- 1 28.2895269
3 [] 2 items
- 0 88.9220304
- 1 27.3274159
4 [] 2 items
- 0 88.9839635
- 1 26.7768169
5 [] 2 items
- 0 86.4983759
- 1 26.3664122
6 [] 2 items
- 0 86.3547294
- 1 27.1610269
7 [] 2 items
- 0 86.3179658
- 1 27.2314518
8 [] 2 items
- 0 86.3263833
- 1 27.3762991
9 [] 2 items
- 0 86.2767653
- 1 27.4641605
10 [] 2 items
- 0 86.2700621
- 1 27.6973039
11 [] 2 items
- 0 86.2156868
- 1 27.7560443
12 [] 2 items
- 0 86.2341796
- 1 27.7815142
13 [] 2 items
- 0 86.2093074
- 1 27.7822769
14 [] 2 items
- 0 86.2032553
- 1 27.8466501
links [] 7 items
0
- rel "collection"
- href "https://planetarycomputer.microsoft.com/api/stac/v1/collections/sentinel-1-rtc"
- type "application/json"
1
- rel "parent"
- href "https://planetarycomputer.microsoft.com/api/stac/v1/collections/sentinel-1-rtc"
- type "application/json"
2
- rel "root"
- href "https://planetarycomputer.microsoft.com/api/stac/v1"
- type "application/json"
- title "Microsoft Planetary Computer STAC API"
3
- rel "self"
- href "https://planetarycomputer.microsoft.com/api/stac/v1/collections/sentinel-1-rtc/items/S1A_IW_GRDH_1SDV_20211122T121358_20211122T121423_040684_04D3CC_rtc"
- type "application/geo+json"
4
- rel "license"
- href "https://sentinel.esa.int/documents/247904/690755/Sentinel_Data_Legal_Notice"
5
- rel "derived_from"
- href "https://planetarycomputer.microsoft.com/api/stac/v1/collections/sentinel-1-grd/items/S1A_IW_GRDH_1SDV_20211122T121358_20211122T121423_040684_04D3CC"
- type "application/json"
- title "Sentinel 1 GRD Item"
6
- rel "preview"
- href "https://planetarycomputer.microsoft.com/api/data/v1/item/map?collection=sentinel-1-rtc&item=S1A_IW_GRDH_1SDV_20211122T121358_20211122T121423_040684_04D3CC_rtc"
- type "text/html"
- title "Map of item"
assets
vh
- href "https://sentinel1euwestrtc.blob.core.windows.net/sentinel1-grd-rtc/GRD/2021/11/22/IW/DV/S1A_IW_GRDH_1SDV_20211122T121358_20211122T121423_040684_04D3CC_A87D/measurement/iw-vh.rtc.tiff"
- type "image/tiff; application=geotiff; profile=cloud-optimized"
- title "VH: vertical transmit, horizontal receive"
- description "Terrain-corrected gamma naught values of signal transmitted with vertical polarization and received with horizontal polarization with radiometric terrain correction applied."
- file:size 1870599543
- file:checksum "e5cecf2e132a545865c27179dff63a45"
raster:bands [] 1 items
0
- nodata -32768
- data_type "float32"
- spatial_resolution 10.0
roles [] 1 items
- 0 "data"
vv
- href "https://sentinel1euwestrtc.blob.core.windows.net/sentinel1-grd-rtc/GRD/2021/11/22/IW/DV/S1A_IW_GRDH_1SDV_20211122T121358_20211122T121423_040684_04D3CC_A87D/measurement/iw-vv.rtc.tiff"
- type "image/tiff; application=geotiff; profile=cloud-optimized"
- title "VV: vertical transmit, vertical receive"
- description "Terrain-corrected gamma naught values of signal transmitted with vertical polarization and received with vertical polarization with radiometric terrain correction applied."
- file:size 1877510105
- file:checksum "90ed96cf67d709802337ab7645025ce9"
raster:bands [] 1 items
0
- nodata -32768
- data_type "float32"
- spatial_resolution 10.0
roles [] 1 items
- 0 "data"
tilejson
- href "https://planetarycomputer.microsoft.com/api/data/v1/item/tilejson.json?collection=sentinel-1-rtc&item=S1A_IW_GRDH_1SDV_20211122T121358_20211122T121423_040684_04D3CC_rtc&assets=vv&assets=vh&tile_format=png&expression=0.03+%2B+log+%2810e-4+-+log+%280.05+%2F+%280.02+%2B+2+%2A+vv%29%29%29%3B0.05+%2B+exp+%280.25+%2A+%28log+%280.01+%2B+2+%2A+vv%29+%2B+log+%280.02+%2B+5+%2A+vh%29%29%29%3B1+-+log+%280.05+%2F+%280.045+-+0.9+%2A+vv%29%29&asset_as_band=True&rescale=0%2C.8000&rescale=0%2C1.000&rescale=0%2C1.000&format=png"
- type "application/json"
- title "TileJSON with default rendering"
roles [] 1 items
- 0 "tiles"
rendered_preview
- href "https://planetarycomputer.microsoft.com/api/data/v1/item/preview.png?collection=sentinel-1-rtc&item=S1A_IW_GRDH_1SDV_20211122T121358_20211122T121423_040684_04D3CC_rtc&assets=vv&assets=vh&tile_format=png&expression=0.03+%2B+log+%2810e-4+-+log+%280.05+%2F+%280.02+%2B+2+%2A+vv%29%29%29%3B0.05+%2B+exp+%280.25+%2A+%28log+%280.01+%2B+2+%2A+vv%29+%2B+log+%280.02+%2B+5+%2A+vh%29%29%29%3B1+-+log+%280.05+%2F+%280.045+-+0.9+%2A+vv%29%29&asset_as_band=True&rescale=0%2C.8000&rescale=0%2C1.000&rescale=0%2C1.000&format=png"
- type "image/png"
- title "Rendered preview"
- rel "preview"
roles [] 1 items
- 0 "overview"
bbox [] 4 items
- 0 86.20325534
- 1 26.36641222
- 2 88.98396351
- 3 28.28952689
stac_extensions [] 6 items
- 0 "https://stac-extensions.github.io/sar/v1.0.0/schema.json"
- 1 "https://stac-extensions.github.io/sat/v1.0.0/schema.json"
- 2 "https://stac-extensions.github.io/eo/v1.0.0/schema.json"
- 3 "https://stac-extensions.github.io/projection/v1.0.0/schema.json"
- 4 "https://stac-extensions.github.io/file/v2.0.0/schema.json"
- 5 "https://stac-extensions.github.io/raster/v1.1.0/schema.json"
- collection "sentinel-1-rtc"
62
- type "Feature"
- stac_version "1.0.0"
- id "S1A_IW_GRDH_1SDV_20211117T120551_20211117T120616_040611_04D14F_rtc"
properties
- datetime "2021-11-17T12:06:03.560526Z"
- platform "SENTINEL-1A"
s1:shape [] 2 items
- 0 28429
- 1 21971
proj:bbox [] 4 items
- 0 618160.0
- 1 2960440.0
- 2 902450.0
- 3 3180150.0
- proj:epsg 32645
proj:shape [] 2 items
- 0 21971
- 1 28429
- end_datetime "2021-11-17 12:06:16.059690+00:00"
- constellation "Sentinel-1"
- s1:resolution "high"
proj:transform [] 9 items
- 0 10.0
- 1 0.0
- 2 618160.0
- 3 0.0
- 4 -10.0
- 5 3180150.0
- 6 0.0
- 7 0.0
- 8 1.0
- s1:datatake_id "315727"
- start_datetime "2021-11-17 12:05:51.061362+00:00"
- s1:orbit_source "DOWNLINK"
- s1:slice_number "6"
- s1:total_slices "21"
- sar:looks_range 5
- sat:orbit_state "ascending"
- sar:product_type "GRD"
- sar:looks_azimuth 1
sar:polarizations [] 2 items
- 0 "VV"
- 1 "VH"
- sar:frequency_band "C"
- sat:absolute_orbit 40611
- sat:relative_orbit 114
- s1:processing_level "1"
- sar:instrument_mode "IW"
- sar:center_frequency 5.405
- sar:resolution_range 20
- s1:product_timeliness "Fast-24h"
- sar:resolution_azimuth 22
- sar:pixel_spacing_range 10
- sar:observation_direction "right"
- sar:pixel_spacing_azimuth 10
- sar:looks_equivalent_number 4.4
- s1:instrument_configuration_ID "7"
- sat:platform_international_designator "2014-016A"
geometry
- type "Polygon"
coordinates [] 1 items
0 [] 14 items
0 [] 2 items
- 0 89.9822442
- 1 27.0125925
1 [] 2 items
- 0 90.9935366
- 1 27.1728398
2 [] 2 items
- 0 90.7246474
- 1 28.6818312
3 [] 2 items
- 0 88.2173769
- 1 28.2797652
4 [] 2 items
- 0 88.3547643
- 1 27.7230192
5 [] 2 items
- 0 88.3296526
- 1 27.5841666
6 [] 2 items
- 0 88.3761857
- 1 27.5219728
7 [] 2 items
- 0 88.3577907
- 1 27.4089609
8 [] 2 items
- 0 88.4001662
- 1 27.3364197
9 [] 2 items
- 0 88.3790283
- 1 27.3026898
10 [] 2 items
- 0 88.4160052
- 1 27.2065473
11 [] 2 items
- 0 88.4040392
- 1 27.0893192
12 [] 2 items
- 0 88.4751307
- 1 26.7596051
13 [] 2 items
- 0 89.9822442
- 1 27.0125925
links [] 7 items
0
- rel "collection"
- href "https://planetarycomputer.microsoft.com/api/stac/v1/collections/sentinel-1-rtc"
- type "application/json"
1
- rel "parent"
- href "https://planetarycomputer.microsoft.com/api/stac/v1/collections/sentinel-1-rtc"
- type "application/json"
2
- rel "root"
- href "https://planetarycomputer.microsoft.com/api/stac/v1"
- type "application/json"
- title "Microsoft Planetary Computer STAC API"
3
- rel "self"
- href "https://planetarycomputer.microsoft.com/api/stac/v1/collections/sentinel-1-rtc/items/S1A_IW_GRDH_1SDV_20211117T120551_20211117T120616_040611_04D14F_rtc"
- type "application/geo+json"
4
- rel "license"
- href "https://sentinel.esa.int/documents/247904/690755/Sentinel_Data_Legal_Notice"
5
- rel "derived_from"
- href "https://planetarycomputer.microsoft.com/api/stac/v1/collections/sentinel-1-grd/items/S1A_IW_GRDH_1SDV_20211117T120551_20211117T120616_040611_04D14F"
- type "application/json"
- title "Sentinel 1 GRD Item"
6
- rel "preview"
- href "https://planetarycomputer.microsoft.com/api/data/v1/item/map?collection=sentinel-1-rtc&item=S1A_IW_GRDH_1SDV_20211117T120551_20211117T120616_040611_04D14F_rtc"
- type "text/html"
- title "Map of item"
assets
vh
- href "https://sentinel1euwestrtc.blob.core.windows.net/sentinel1-grd-rtc/GRD/2021/11/17/IW/DV/S1A_IW_GRDH_1SDV_20211117T120551_20211117T120616_040611_04D14F_64D1/measurement/iw-vh.rtc.tiff"
- type "image/tiff; application=geotiff; profile=cloud-optimized"
- title "VH: vertical transmit, horizontal receive"
- description "Terrain-corrected gamma naught values of signal transmitted with vertical polarization and received with horizontal polarization with radiometric terrain correction applied."
- file:size 1852341839
- file:checksum "6ef51d64339eb1d546afe13e73938ff5"
raster:bands [] 1 items
0
- nodata -32768
- data_type "float32"
- spatial_resolution 10.0
roles [] 1 items
- 0 "data"
vv
- href "https://sentinel1euwestrtc.blob.core.windows.net/sentinel1-grd-rtc/GRD/2021/11/17/IW/DV/S1A_IW_GRDH_1SDV_20211117T120551_20211117T120616_040611_04D14F_64D1/measurement/iw-vv.rtc.tiff"
- type "image/tiff; application=geotiff; profile=cloud-optimized"
- title "VV: vertical transmit, vertical receive"
- description "Terrain-corrected gamma naught values of signal transmitted with vertical polarization and received with vertical polarization with radiometric terrain correction applied."
- file:size 1859006695
- file:checksum "e68bd272e8585b829484e3337c2b3368"
raster:bands [] 1 items
0
- nodata -32768
- data_type "float32"
- spatial_resolution 10.0
roles [] 1 items
- 0 "data"
tilejson
- href "https://planetarycomputer.microsoft.com/api/data/v1/item/tilejson.json?collection=sentinel-1-rtc&item=S1A_IW_GRDH_1SDV_20211117T120551_20211117T120616_040611_04D14F_rtc&assets=vv&assets=vh&tile_format=png&expression=0.03+%2B+log+%2810e-4+-+log+%280.05+%2F+%280.02+%2B+2+%2A+vv%29%29%29%3B0.05+%2B+exp+%280.25+%2A+%28log+%280.01+%2B+2+%2A+vv%29+%2B+log+%280.02+%2B+5+%2A+vh%29%29%29%3B1+-+log+%280.05+%2F+%280.045+-+0.9+%2A+vv%29%29&asset_as_band=True&rescale=0%2C.8000&rescale=0%2C1.000&rescale=0%2C1.000&format=png"
- type "application/json"
- title "TileJSON with default rendering"
roles [] 1 items
- 0 "tiles"
rendered_preview
- href "https://planetarycomputer.microsoft.com/api/data/v1/item/preview.png?collection=sentinel-1-rtc&item=S1A_IW_GRDH_1SDV_20211117T120551_20211117T120616_040611_04D14F_rtc&assets=vv&assets=vh&tile_format=png&expression=0.03+%2B+log+%2810e-4+-+log+%280.05+%2F+%280.02+%2B+2+%2A+vv%29%29%29%3B0.05+%2B+exp+%280.25+%2A+%28log+%280.01+%2B+2+%2A+vv%29+%2B+log+%280.02+%2B+5+%2A+vh%29%29%29%3B1+-+log+%280.05+%2F+%280.045+-+0.9+%2A+vv%29%29&asset_as_band=True&rescale=0%2C.8000&rescale=0%2C1.000&rescale=0%2C1.000&format=png"
- type "image/png"
- title "Rendered preview"
- rel "preview"
roles [] 1 items
- 0 "overview"
bbox [] 4 items
- 0 88.21737694
- 1 26.75960507
- 2 90.99353659
- 3 28.68183121
stac_extensions [] 6 items
- 0 "https://stac-extensions.github.io/sar/v1.0.0/schema.json"
- 1 "https://stac-extensions.github.io/sat/v1.0.0/schema.json"
- 2 "https://stac-extensions.github.io/eo/v1.0.0/schema.json"
- 3 "https://stac-extensions.github.io/projection/v1.0.0/schema.json"
- 4 "https://stac-extensions.github.io/file/v2.0.0/schema.json"
- 5 "https://stac-extensions.github.io/raster/v1.1.0/schema.json"
- collection "sentinel-1-rtc"
63
- type "Feature"
- stac_version "1.0.0"
- id "S1A_IW_GRDH_1SDV_20211113T000316_20211113T000341_040545_04CEFF_rtc"
properties
- datetime "2021-11-13T00:03:29.481869Z"
- platform "SENTINEL-1A"
s1:shape [] 2 items
- 0 27536
- 1 21083
proj:bbox [] 4 items
- 0 524470.0
- 1 2980850.0
- 2 799830.0
- 3 3191680.0
- proj:epsg 32645
proj:shape [] 2 items
- 0 21083
- 1 27536
- end_datetime "2021-11-13 00:03:41.981337+00:00"
- constellation "Sentinel-1"
- s1:resolution "high"
proj:transform [] 9 items
- 0 10.0
- 1 0.0
- 2 524470.0
- 3 0.0
- 4 -10.0
- 5 3191680.0
- 6 0.0
- 7 0.0
- 8 1.0
- s1:datatake_id "315135"
- start_datetime "2021-11-13 00:03:16.982401+00:00"
- s1:orbit_source "DOWNLINK"
- s1:slice_number "12"
- s1:total_slices "17"
- sar:looks_range 5
- sat:orbit_state "descending"
- sar:product_type "GRD"
- sar:looks_azimuth 1
sar:polarizations [] 2 items
- 0 "VV"
- 1 "VH"
- sar:frequency_band "C"
- sat:absolute_orbit 40545
- sat:relative_orbit 48
- s1:processing_level "1"
- sar:instrument_mode "IW"
- sar:center_frequency 5.405
- sar:resolution_range 20
- s1:product_timeliness "Fast-24h"
- sar:resolution_azimuth 22
- sar:pixel_spacing_range 10
- sar:observation_direction "right"
- sar:pixel_spacing_azimuth 10
- sar:looks_equivalent_number 4.4
- s1:instrument_configuration_ID "7"
- sat:platform_international_designator "2014-016A"
geometry
- type "Polygon"
coordinates [] 1 items
0 [] 16 items
0 [] 2 items
- 0 89.8052112
- 1 27.0224584
1 [] 2 items
- 0 89.7782308
- 1 26.9945283
2 [] 2 items
- 0 89.7851745
- 1 26.9227088
3 [] 2 items
- 0 87.3053841
- 1 27.3295612
4 [] 2 items
- 0 87.4263027
- 1 28.1941662
5 [] 2 items
- 0 87.5592506
- 1 28.8402019
6 [] 2 items
- 0 90.0501587
- 1 28.4417647
7 [] 2 items
- 0 89.9858697
- 1 28.188419
8 [] 2 items
- 0 89.9883103
- 1 28.0011945
9 [] 2 items
- 0 89.9455038
- 1 27.9518743
10 [] 2 items
- 0 89.93192
- 1 27.8513127
11 [] 2 items
- 0 89.9531221
- 1 27.6782927
12 [] 2 items
- 0 89.9234876
- 1 27.6385076
13 [] 2 items
- 0 89.9034704
- 1 27.4283731
14 [] 2 items
- 0 89.8296926
- 1 27.2745373
15 [] 2 items
- 0 89.8052112
- 1 27.0224584
links [] 7 items
0
- rel "collection"
- href "https://planetarycomputer.microsoft.com/api/stac/v1/collections/sentinel-1-rtc"
- type "application/json"
1
- rel "parent"
- href "https://planetarycomputer.microsoft.com/api/stac/v1/collections/sentinel-1-rtc"
- type "application/json"
2
- rel "root"
- href "https://planetarycomputer.microsoft.com/api/stac/v1"
- type "application/json"
- title "Microsoft Planetary Computer STAC API"
3
- rel "self"
- href "https://planetarycomputer.microsoft.com/api/stac/v1/collections/sentinel-1-rtc/items/S1A_IW_GRDH_1SDV_20211113T000316_20211113T000341_040545_04CEFF_rtc"
- type "application/geo+json"
4
- rel "license"
- href "https://sentinel.esa.int/documents/247904/690755/Sentinel_Data_Legal_Notice"
5
- rel "derived_from"
- href "https://planetarycomputer.microsoft.com/api/stac/v1/collections/sentinel-1-grd/items/S1A_IW_GRDH_1SDV_20211113T000316_20211113T000341_040545_04CEFF"
- type "application/json"
- title "Sentinel 1 GRD Item"
6
- rel "preview"
- href "https://planetarycomputer.microsoft.com/api/data/v1/item/map?collection=sentinel-1-rtc&item=S1A_IW_GRDH_1SDV_20211113T000316_20211113T000341_040545_04CEFF_rtc"
- type "text/html"
- title "Map of item"
assets
vh
- href "https://sentinel1euwestrtc.blob.core.windows.net/sentinel1-grd-rtc/GRD/2021/11/13/IW/DV/S1A_IW_GRDH_1SDV_20211113T000316_20211113T000341_040545_04CEFF_65EE/measurement/iw-vh.rtc.tiff"
- type "image/tiff; application=geotiff; profile=cloud-optimized"
- title "VH: vertical transmit, horizontal receive"
- description "Terrain-corrected gamma naught values of signal transmitted with vertical polarization and received with horizontal polarization with radiometric terrain correction applied."
- file:size 1841635009
- file:checksum "c1ce8c96f4d4e6564a7b5143190cf358"
raster:bands [] 1 items
0
- nodata -32768
- data_type "float32"
- spatial_resolution 10.0
roles [] 1 items
- 0 "data"
vv
- href "https://sentinel1euwestrtc.blob.core.windows.net/sentinel1-grd-rtc/GRD/2021/11/13/IW/DV/S1A_IW_GRDH_1SDV_20211113T000316_20211113T000341_040545_04CEFF_65EE/measurement/iw-vv.rtc.tiff"
- type "image/tiff; application=geotiff; profile=cloud-optimized"
- title "VV: vertical transmit, vertical receive"
- description "Terrain-corrected gamma naught values of signal transmitted with vertical polarization and received with vertical polarization with radiometric terrain correction applied."
- file:size 1848328891
- file:checksum "8f0b65e3e799f3ce45fb0738d62e5df5"
raster:bands [] 1 items
0
- nodata -32768
- data_type "float32"
- spatial_resolution 10.0
roles [] 1 items
- 0 "data"
tilejson
- href "https://planetarycomputer.microsoft.com/api/data/v1/item/tilejson.json?collection=sentinel-1-rtc&item=S1A_IW_GRDH_1SDV_20211113T000316_20211113T000341_040545_04CEFF_rtc&assets=vv&assets=vh&tile_format=png&expression=0.03+%2B+log+%2810e-4+-+log+%280.05+%2F+%280.02+%2B+2+%2A+vv%29%29%29%3B0.05+%2B+exp+%280.25+%2A+%28log+%280.01+%2B+2+%2A+vv%29+%2B+log+%280.02+%2B+5+%2A+vh%29%29%29%3B1+-+log+%280.05+%2F+%280.045+-+0.9+%2A+vv%29%29&asset_as_band=True&rescale=0%2C.8000&rescale=0%2C1.000&rescale=0%2C1.000&format=png"
- type "application/json"
- title "TileJSON with default rendering"
roles [] 1 items
- 0 "tiles"
rendered_preview
- href "https://planetarycomputer.microsoft.com/api/data/v1/item/preview.png?collection=sentinel-1-rtc&item=S1A_IW_GRDH_1SDV_20211113T000316_20211113T000341_040545_04CEFF_rtc&assets=vv&assets=vh&tile_format=png&expression=0.03+%2B+log+%2810e-4+-+log+%280.05+%2F+%280.02+%2B+2+%2A+vv%29%29%29%3B0.05+%2B+exp+%280.25+%2A+%28log+%280.01+%2B+2+%2A+vv%29+%2B+log+%280.02+%2B+5+%2A+vh%29%29%29%3B1+-+log+%280.05+%2F+%280.045+-+0.9+%2A+vv%29%29&asset_as_band=True&rescale=0%2C.8000&rescale=0%2C1.000&rescale=0%2C1.000&format=png"
- type "image/png"
- title "Rendered preview"
- rel "preview"
roles [] 1 items
- 0 "overview"
bbox [] 4 items
- 0 87.30538411
- 1 26.92270879
- 2 90.05015872
- 3 28.84020191
stac_extensions [] 6 items
- 0 "https://stac-extensions.github.io/sar/v1.0.0/schema.json"
- 1 "https://stac-extensions.github.io/sat/v1.0.0/schema.json"
- 2 "https://stac-extensions.github.io/eo/v1.0.0/schema.json"
- 3 "https://stac-extensions.github.io/projection/v1.0.0/schema.json"
- 4 "https://stac-extensions.github.io/file/v2.0.0/schema.json"
- 5 "https://stac-extensions.github.io/raster/v1.1.0/schema.json"
- collection "sentinel-1-rtc"
64
- type "Feature"
- stac_version "1.0.0"
- id "S1A_IW_GRDH_1SDV_20211110T121358_20211110T121423_040509_04CDC8_rtc"
properties
- datetime "2021-11-10T12:14:10.742983Z"
- platform "SENTINEL-1A"
s1:shape [] 2 items
- 0 28238
- 1 21599
proj:bbox [] 4 items
- 0 420890.0
- 1 2916220.0
- 2 703270.0
- 3 3132210.0
- proj:epsg 32645
proj:shape [] 2 items
- 0 21599
- 1 28238
- end_datetime "2021-11-10 12:14:23.242066+00:00"
- constellation "Sentinel-1"
- s1:resolution "high"
proj:transform [] 9 items
- 0 10.0
- 1 0.0
- 2 420890.0
- 3 0.0
- 4 -10.0
- 5 3132210.0
- 6 0.0
- 7 0.0
- 8 1.0
- s1:datatake_id "314824"
- start_datetime "2021-11-10 12:13:58.243900+00:00"
- s1:orbit_source "DOWNLINK"
- s1:slice_number "6"
- s1:total_slices "20"
- sar:looks_range 5
- sat:orbit_state "ascending"
- sar:product_type "GRD"
- sar:looks_azimuth 1
sar:polarizations [] 2 items
- 0 "VV"
- 1 "VH"
- sar:frequency_band "C"
- sat:absolute_orbit 40509
- sat:relative_orbit 12
- s1:processing_level "1"
- sar:instrument_mode "IW"
- sar:center_frequency 5.405
- sar:resolution_range 20
- s1:product_timeliness "Fast-24h"
- sar:resolution_azimuth 22
- sar:pixel_spacing_range 10
- sar:observation_direction "right"
- sar:pixel_spacing_azimuth 10
- sar:looks_equivalent_number 4.4
- s1:instrument_configuration_ID "7"
- sat:platform_international_designator "2014-016A"
geometry
- type "Polygon"
coordinates [] 1 items
0 [] 16 items
0 [] 2 items
- 0 87.8602111
- 1 26.5971045
1 [] 2 items
- 0 86.4983751
- 1 26.3665928
2 [] 2 items
- 0 86.3547294
- 1 27.1610269
3 [] 2 items
- 0 86.3179663
- 1 27.2313615
4 [] 2 items
- 0 86.3263833
- 1 27.3762991
5 [] 2 items
- 0 86.2767659
- 1 27.4640702
6 [] 2 items
- 0 86.2700627
- 1 27.6972136
7 [] 2 items
- 0 86.2155841
- 1 27.7562243
8 [] 2 items
- 0 86.2341809
- 1 27.7813337
9 [] 2 items
- 0 86.2092046
- 1 27.7824568
10 [] 2 items
- 0 86.2032537
- 1 27.8468757
11 [] 2 items
- 0 86.2104657
- 1 27.8817162
12 [] 2 items
- 0 88.7372341
- 1 28.2895295
13 [] 2 items
- 0 88.9220304
- 1 27.3274159
14 [] 2 items
- 0 88.9838661
- 1 26.7769988
15 [] 2 items
- 0 87.8602111
- 1 26.5971045
links [] 7 items
0
- rel "collection"
- href "https://planetarycomputer.microsoft.com/api/stac/v1/collections/sentinel-1-rtc"
- type "application/json"
1
- rel "parent"
- href "https://planetarycomputer.microsoft.com/api/stac/v1/collections/sentinel-1-rtc"
- type "application/json"
2
- rel "root"
- href "https://planetarycomputer.microsoft.com/api/stac/v1"
- type "application/json"
- title "Microsoft Planetary Computer STAC API"
3
- rel "self"
- href "https://planetarycomputer.microsoft.com/api/stac/v1/collections/sentinel-1-rtc/items/S1A_IW_GRDH_1SDV_20211110T121358_20211110T121423_040509_04CDC8_rtc"
- type "application/geo+json"
4
- rel "license"
- href "https://sentinel.esa.int/documents/247904/690755/Sentinel_Data_Legal_Notice"
5
- rel "derived_from"
- href "https://planetarycomputer.microsoft.com/api/stac/v1/collections/sentinel-1-grd/items/S1A_IW_GRDH_1SDV_20211110T121358_20211110T121423_040509_04CDC8"
- type "application/json"
- title "Sentinel 1 GRD Item"
6
- rel "preview"
- href "https://planetarycomputer.microsoft.com/api/data/v1/item/map?collection=sentinel-1-rtc&item=S1A_IW_GRDH_1SDV_20211110T121358_20211110T121423_040509_04CDC8_rtc"
- type "text/html"
- title "Map of item"
assets
vh
- href "https://sentinel1euwestrtc.blob.core.windows.net/sentinel1-grd-rtc/GRD/2021/11/10/IW/DV/S1A_IW_GRDH_1SDV_20211110T121358_20211110T121423_040509_04CDC8_A5D0/measurement/iw-vh.rtc.tiff"
- type "image/tiff; application=geotiff; profile=cloud-optimized"
- title "VH: vertical transmit, horizontal receive"
- description "Terrain-corrected gamma naught values of signal transmitted with vertical polarization and received with horizontal polarization with radiometric terrain correction applied."
- file:size 1869823182
- file:checksum "877e086c714d6c32dd757b12b2362172"
raster:bands [] 1 items
0
- nodata -32768
- data_type "float32"
- spatial_resolution 10.0
roles [] 1 items
- 0 "data"
vv
- href "https://sentinel1euwestrtc.blob.core.windows.net/sentinel1-grd-rtc/GRD/2021/11/10/IW/DV/S1A_IW_GRDH_1SDV_20211110T121358_20211110T121423_040509_04CDC8_A5D0/measurement/iw-vv.rtc.tiff"
- type "image/tiff; application=geotiff; profile=cloud-optimized"
- title "VV: vertical transmit, vertical receive"
- description "Terrain-corrected gamma naught values of signal transmitted with vertical polarization and received with vertical polarization with radiometric terrain correction applied."
- file:size 1877247836
- file:checksum "f656d73a0cb42cf49a9cc112042aa920"
raster:bands [] 1 items
0
- nodata -32768
- data_type "float32"
- spatial_resolution 10.0
roles [] 1 items
- 0 "data"
tilejson
- href "https://planetarycomputer.microsoft.com/api/data/v1/item/tilejson.json?collection=sentinel-1-rtc&item=S1A_IW_GRDH_1SDV_20211110T121358_20211110T121423_040509_04CDC8_rtc&assets=vv&assets=vh&tile_format=png&expression=0.03+%2B+log+%2810e-4+-+log+%280.05+%2F+%280.02+%2B+2+%2A+vv%29%29%29%3B0.05+%2B+exp+%280.25+%2A+%28log+%280.01+%2B+2+%2A+vv%29+%2B+log+%280.02+%2B+5+%2A+vh%29%29%29%3B1+-+log+%280.05+%2F+%280.045+-+0.9+%2A+vv%29%29&asset_as_band=True&rescale=0%2C.8000&rescale=0%2C1.000&rescale=0%2C1.000&format=png"
- type "application/json"
- title "TileJSON with default rendering"
roles [] 1 items
- 0 "tiles"
rendered_preview
- href "https://planetarycomputer.microsoft.com/api/data/v1/item/preview.png?collection=sentinel-1-rtc&item=S1A_IW_GRDH_1SDV_20211110T121358_20211110T121423_040509_04CDC8_rtc&assets=vv&assets=vh&tile_format=png&expression=0.03+%2B+log+%2810e-4+-+log+%280.05+%2F+%280.02+%2B+2+%2A+vv%29%29%29%3B0.05+%2B+exp+%280.25+%2A+%28log+%280.01+%2B+2+%2A+vv%29+%2B+log+%280.02+%2B+5+%2A+vh%29%29%29%3B1+-+log+%280.05+%2F+%280.045+-+0.9+%2A+vv%29%29&asset_as_band=True&rescale=0%2C.8000&rescale=0%2C1.000&rescale=0%2C1.000&format=png"
- type "image/png"
- title "Rendered preview"
- rel "preview"
roles [] 1 items
- 0 "overview"
bbox [] 4 items
- 0 86.20325369
- 1 26.3665928
- 2 88.98386611
- 3 28.28952948
stac_extensions [] 6 items
- 0 "https://stac-extensions.github.io/sar/v1.0.0/schema.json"
- 1 "https://stac-extensions.github.io/sat/v1.0.0/schema.json"
- 2 "https://stac-extensions.github.io/eo/v1.0.0/schema.json"
- 3 "https://stac-extensions.github.io/projection/v1.0.0/schema.json"
- 4 "https://stac-extensions.github.io/file/v2.0.0/schema.json"
- 5 "https://stac-extensions.github.io/raster/v1.1.0/schema.json"
- collection "sentinel-1-rtc"
65
- type "Feature"
- stac_version "1.0.0"
- id "S1A_IW_GRDH_1SDV_20211105T120551_20211105T120616_040436_04CB46_rtc"
properties
- datetime "2021-11-05T12:06:03.645002Z"
- platform "SENTINEL-1A"
s1:shape [] 2 items
- 0 28427
- 1 21971
proj:bbox [] 4 items
- 0 618220.0
- 1 2960440.0
- 2 902490.0
- 3 3180150.0
- proj:epsg 32645
proj:shape [] 2 items
- 0 21971
- 1 28427
- end_datetime "2021-11-05 12:06:16.144152+00:00"
- constellation "Sentinel-1"
- s1:resolution "high"
proj:transform [] 9 items
- 0 10.0
- 1 0.0
- 2 618220.0
- 3 0.0
- 4 -10.0
- 5 3180150.0
- 6 0.0
- 7 0.0
- 8 1.0
- s1:datatake_id "314182"
- start_datetime "2021-11-05 12:05:51.145852+00:00"
- s1:orbit_source "DOWNLINK"
- s1:slice_number "6"
- s1:total_slices "21"
- sar:looks_range 5
- sat:orbit_state "ascending"
- sar:product_type "GRD"
- sar:looks_azimuth 1
sar:polarizations [] 2 items
- 0 "VV"
- 1 "VH"
- sar:frequency_band "C"
- sat:absolute_orbit 40436
- sat:relative_orbit 114
- s1:processing_level "1"
- sar:instrument_mode "IW"
- sar:center_frequency 5.405
- sar:resolution_range 20
- s1:product_timeliness "Fast-24h"
- sar:resolution_azimuth 22
- sar:pixel_spacing_range 10
- sar:observation_direction "right"
- sar:pixel_spacing_azimuth 10
- sar:looks_equivalent_number 4.4
- s1:instrument_configuration_ID "7"
- sat:platform_international_designator "2014-016A"
geometry
- type "Polygon"
coordinates [] 1 items
0 [] 14 items
0 [] 2 items
- 0 89.9826469
- 1 27.012584
1 [] 2 items
- 0 90.9938387
- 1 27.1728312
2 [] 2 items
- 0 90.725056
- 1 28.68182
3 [] 2 items
- 0 88.2178867
- 1 28.2797606
4 [] 2 items
- 0 88.3555779
- 1 27.7231918
5 [] 2 items
- 0 88.3301602
- 1 27.5842521
6 [] 2 items
- 0 88.3767954
- 1 27.5221473
7 [] 2 items
- 0 88.3584975
- 1 27.4088638
8 [] 2 items
- 0 88.4007737
- 1 27.3365039
9 [] 2 items
- 0 88.3794291
- 1 27.302415
10 [] 2 items
- 0 88.4163046
- 1 27.2062735
11 [] 2 items
- 0 88.4045457
- 1 27.0894946
12 [] 2 items
- 0 88.4755329
- 1 26.7596009
13 [] 2 items
- 0 89.9826469
- 1 27.012584
links [] 7 items
0
- rel "collection"
- href "https://planetarycomputer.microsoft.com/api/stac/v1/collections/sentinel-1-rtc"
- type "application/json"
1
- rel "parent"
- href "https://planetarycomputer.microsoft.com/api/stac/v1/collections/sentinel-1-rtc"
- type "application/json"
2
- rel "root"
- href "https://planetarycomputer.microsoft.com/api/stac/v1"
- type "application/json"
- title "Microsoft Planetary Computer STAC API"
3
- rel "self"
- href "https://planetarycomputer.microsoft.com/api/stac/v1/collections/sentinel-1-rtc/items/S1A_IW_GRDH_1SDV_20211105T120551_20211105T120616_040436_04CB46_rtc"
- type "application/geo+json"
4
- rel "license"
- href "https://sentinel.esa.int/documents/247904/690755/Sentinel_Data_Legal_Notice"
5
- rel "derived_from"
- href "https://planetarycomputer.microsoft.com/api/stac/v1/collections/sentinel-1-grd/items/S1A_IW_GRDH_1SDV_20211105T120551_20211105T120616_040436_04CB46"
- type "application/json"
- title "Sentinel 1 GRD Item"
6
- rel "preview"
- href "https://planetarycomputer.microsoft.com/api/data/v1/item/map?collection=sentinel-1-rtc&item=S1A_IW_GRDH_1SDV_20211105T120551_20211105T120616_040436_04CB46_rtc"
- type "text/html"
- title "Map of item"
assets
vh
- href "https://sentinel1euwestrtc.blob.core.windows.net/sentinel1-grd-rtc/GRD/2021/11/5/IW/DV/S1A_IW_GRDH_1SDV_20211105T120551_20211105T120616_040436_04CB46_AC9D/measurement/iw-vh.rtc.tiff"
- type "image/tiff; application=geotiff; profile=cloud-optimized"
- title "VH: vertical transmit, horizontal receive"
- description "Terrain-corrected gamma naught values of signal transmitted with vertical polarization and received with horizontal polarization with radiometric terrain correction applied."
- file:size 1851984556
- file:checksum "1be600080a631f476395f32955b7af76"
raster:bands [] 1 items
0
- nodata -32768
- data_type "float32"
- spatial_resolution 10.0
roles [] 1 items
- 0 "data"
vv
- href "https://sentinel1euwestrtc.blob.core.windows.net/sentinel1-grd-rtc/GRD/2021/11/5/IW/DV/S1A_IW_GRDH_1SDV_20211105T120551_20211105T120616_040436_04CB46_AC9D/measurement/iw-vv.rtc.tiff"
- type "image/tiff; application=geotiff; profile=cloud-optimized"
- title "VV: vertical transmit, vertical receive"
- description "Terrain-corrected gamma naught values of signal transmitted with vertical polarization and received with vertical polarization with radiometric terrain correction applied."
- file:size 1859036305
- file:checksum "d9b99842b6c817e9e2d9a1ed894b67dd"
raster:bands [] 1 items
0
- nodata -32768
- data_type "float32"
- spatial_resolution 10.0
roles [] 1 items
- 0 "data"
tilejson
- href "https://planetarycomputer.microsoft.com/api/data/v1/item/tilejson.json?collection=sentinel-1-rtc&item=S1A_IW_GRDH_1SDV_20211105T120551_20211105T120616_040436_04CB46_rtc&assets=vv&assets=vh&tile_format=png&expression=0.03+%2B+log+%2810e-4+-+log+%280.05+%2F+%280.02+%2B+2+%2A+vv%29%29%29%3B0.05+%2B+exp+%280.25+%2A+%28log+%280.01+%2B+2+%2A+vv%29+%2B+log+%280.02+%2B+5+%2A+vh%29%29%29%3B1+-+log+%280.05+%2F+%280.045+-+0.9+%2A+vv%29%29&asset_as_band=True&rescale=0%2C.8000&rescale=0%2C1.000&rescale=0%2C1.000&format=png"
- type "application/json"
- title "TileJSON with default rendering"
roles [] 1 items
- 0 "tiles"
rendered_preview
- href "https://planetarycomputer.microsoft.com/api/data/v1/item/preview.png?collection=sentinel-1-rtc&item=S1A_IW_GRDH_1SDV_20211105T120551_20211105T120616_040436_04CB46_rtc&assets=vv&assets=vh&tile_format=png&expression=0.03+%2B+log+%2810e-4+-+log+%280.05+%2F+%280.02+%2B+2+%2A+vv%29%29%29%3B0.05+%2B+exp+%280.25+%2A+%28log+%280.01+%2B+2+%2A+vv%29+%2B+log+%280.02+%2B+5+%2A+vh%29%29%29%3B1+-+log+%280.05+%2F+%280.045+-+0.9+%2A+vv%29%29&asset_as_band=True&rescale=0%2C.8000&rescale=0%2C1.000&rescale=0%2C1.000&format=png"
- type "image/png"
- title "Rendered preview"
- rel "preview"
roles [] 1 items
- 0 "overview"
bbox [] 4 items
- 0 88.21788668
- 1 26.75960088
- 2 90.99383869
- 3 28.68181995
stac_extensions [] 6 items
- 0 "https://stac-extensions.github.io/sar/v1.0.0/schema.json"
- 1 "https://stac-extensions.github.io/sat/v1.0.0/schema.json"
- 2 "https://stac-extensions.github.io/eo/v1.0.0/schema.json"
- 3 "https://stac-extensions.github.io/projection/v1.0.0/schema.json"
- 4 "https://stac-extensions.github.io/file/v2.0.0/schema.json"
- 5 "https://stac-extensions.github.io/raster/v1.1.0/schema.json"
- collection "sentinel-1-rtc"
66
- type "Feature"
- stac_version "1.0.0"
- id "S1A_IW_GRDH_1SDV_20211101T000317_20211101T000342_040370_04C8E9_rtc"
properties
- datetime "2021-11-01T00:03:29.702246Z"
- platform "SENTINEL-1A"
s1:shape [] 2 items
- 0 27537
- 1 21082
proj:bbox [] 4 items
- 0 524450.0
- 1 2980840.0
- 2 799820.0
- 3 3191660.0
- proj:epsg 32645
proj:shape [] 2 items
- 0 21082
- 1 27537
- end_datetime "2021-11-01 00:03:42.200949+00:00"
- constellation "Sentinel-1"
- s1:resolution "high"
proj:transform [] 9 items
- 0 10.0
- 1 0.0
- 2 524450.0
- 3 0.0
- 4 -10.0
- 5 3191660.0
- 6 0.0
- 7 0.0
- 8 1.0
- s1:datatake_id "313577"
- start_datetime "2021-11-01 00:03:17.203544+00:00"
- s1:orbit_source "DOWNLINK"
- s1:slice_number "12"
- s1:total_slices "17"
- sar:looks_range 5
- sat:orbit_state "descending"
- sar:product_type "GRD"
- sar:looks_azimuth 1
sar:polarizations [] 2 items
- 0 "VV"
- 1 "VH"
- sar:frequency_band "C"
- sat:absolute_orbit 40370
- sat:relative_orbit 48
- s1:processing_level "1"
- sar:instrument_mode "IW"
- sar:center_frequency 5.405
- sar:resolution_range 20
- s1:product_timeliness "Fast-24h"
- sar:resolution_azimuth 22
- sar:pixel_spacing_range 10
- sar:observation_direction "right"
- sar:pixel_spacing_azimuth 10
- sar:looks_equivalent_number 4.4
- s1:instrument_configuration_ID "7"
- sat:platform_international_designator "2014-016A"
geometry
- type "Polygon"
coordinates [] 1 items
0 [] 19 items
0 [] 2 items
- 0 89.8049226
- 1 27.0230055
1 [] 2 items
- 0 89.7779354
- 1 26.9948048
2 [] 2 items
- 0 89.7849733
- 1 26.9227128
3 [] 2 items
- 0 87.305283
- 1 27.3295615
4 [] 2 items
- 0 87.4262004
- 1 28.1940762
5 [] 2 items
- 0 87.5587375
- 1 28.8401138
6 [] 2 items
- 0 90.0501535
- 1 28.4415844
7 [] 2 items
- 0 90.0268489
- 1 28.291248
8 [] 2 items
- 0 89.9736459
- 1 28.1918424
9 [] 2 items
- 0 89.9982873
- 1 28.1481879
10 [] 2 items
- 0 89.9714908
- 1 28.0843669
11 [] 2 items
- 0 89.9881246
- 1 28.00183
12 [] 2 items
- 0 89.9452959
- 1 27.9516983
13 [] 2 items
- 0 89.9297848
- 1 27.8247467
14 [] 2 items
- 0 89.9529196
- 1 27.678297
15 [] 2 items
- 0 89.9233887
- 1 27.6385999
16 [] 2 items
- 0 89.9030592
- 1 27.428111
17 [] 2 items
- 0 89.8294907
- 1 27.2745413
18 [] 2 items
- 0 89.8049226
- 1 27.0230055
links [] 7 items
0
- rel "collection"
- href "https://planetarycomputer.microsoft.com/api/stac/v1/collections/sentinel-1-rtc"
- type "application/json"
1
- rel "parent"
- href "https://planetarycomputer.microsoft.com/api/stac/v1/collections/sentinel-1-rtc"
- type "application/json"
2
- rel "root"
- href "https://planetarycomputer.microsoft.com/api/stac/v1"
- type "application/json"
- title "Microsoft Planetary Computer STAC API"
3
- rel "self"
- href "https://planetarycomputer.microsoft.com/api/stac/v1/collections/sentinel-1-rtc/items/S1A_IW_GRDH_1SDV_20211101T000317_20211101T000342_040370_04C8E9_rtc"
- type "application/geo+json"
4
- rel "license"
- href "https://sentinel.esa.int/documents/247904/690755/Sentinel_Data_Legal_Notice"
5
- rel "derived_from"
- href "https://planetarycomputer.microsoft.com/api/stac/v1/collections/sentinel-1-grd/items/S1A_IW_GRDH_1SDV_20211101T000317_20211101T000342_040370_04C8E9"
- type "application/json"
- title "Sentinel 1 GRD Item"
6
- rel "preview"
- href "https://planetarycomputer.microsoft.com/api/data/v1/item/map?collection=sentinel-1-rtc&item=S1A_IW_GRDH_1SDV_20211101T000317_20211101T000342_040370_04C8E9_rtc"
- type "text/html"
- title "Map of item"
assets
vh
- href "https://sentinel1euwestrtc.blob.core.windows.net/sentinel1-grd-rtc/GRD/2021/11/1/IW/DV/S1A_IW_GRDH_1SDV_20211101T000317_20211101T000342_040370_04C8E9_B7EB/measurement/iw-vh.rtc.tiff"
- type "image/tiff; application=geotiff; profile=cloud-optimized"
- title "VH: vertical transmit, horizontal receive"
- description "Terrain-corrected gamma naught values of signal transmitted with vertical polarization and received with horizontal polarization with radiometric terrain correction applied."
- file:size 1840626091
- file:checksum "951c0d146b9181384e2d444db1f52d4f"
raster:bands [] 1 items
0
- nodata -32768
- data_type "float32"
- spatial_resolution 10.0
roles [] 1 items
- 0 "data"
vv
- href "https://sentinel1euwestrtc.blob.core.windows.net/sentinel1-grd-rtc/GRD/2021/11/1/IW/DV/S1A_IW_GRDH_1SDV_20211101T000317_20211101T000342_040370_04C8E9_B7EB/measurement/iw-vv.rtc.tiff"
- type "image/tiff; application=geotiff; profile=cloud-optimized"
- title "VV: vertical transmit, vertical receive"
- description "Terrain-corrected gamma naught values of signal transmitted with vertical polarization and received with vertical polarization with radiometric terrain correction applied."
- file:size 1847834258
- file:checksum "07dc7190d3d8404f6ef7ffd31bcffcab"
raster:bands [] 1 items
0
- nodata -32768
- data_type "float32"
- spatial_resolution 10.0
roles [] 1 items
- 0 "data"
tilejson
- href "https://planetarycomputer.microsoft.com/api/data/v1/item/tilejson.json?collection=sentinel-1-rtc&item=S1A_IW_GRDH_1SDV_20211101T000317_20211101T000342_040370_04C8E9_rtc&assets=vv&assets=vh&tile_format=png&expression=0.03+%2B+log+%2810e-4+-+log+%280.05+%2F+%280.02+%2B+2+%2A+vv%29%29%29%3B0.05+%2B+exp+%280.25+%2A+%28log+%280.01+%2B+2+%2A+vv%29+%2B+log+%280.02+%2B+5+%2A+vh%29%29%29%3B1+-+log+%280.05+%2F+%280.045+-+0.9+%2A+vv%29%29&asset_as_band=True&rescale=0%2C.8000&rescale=0%2C1.000&rescale=0%2C1.000&format=png"
- type "application/json"
- title "TileJSON with default rendering"
roles [] 1 items
- 0 "tiles"
rendered_preview
- href "https://planetarycomputer.microsoft.com/api/data/v1/item/preview.png?collection=sentinel-1-rtc&item=S1A_IW_GRDH_1SDV_20211101T000317_20211101T000342_040370_04C8E9_rtc&assets=vv&assets=vh&tile_format=png&expression=0.03+%2B+log+%2810e-4+-+log+%280.05+%2F+%280.02+%2B+2+%2A+vv%29%29%29%3B0.05+%2B+exp+%280.25+%2A+%28log+%280.01+%2B+2+%2A+vv%29+%2B+log+%280.02+%2B+5+%2A+vh%29%29%29%3B1+-+log+%280.05+%2F+%280.045+-+0.9+%2A+vv%29%29&asset_as_band=True&rescale=0%2C.8000&rescale=0%2C1.000&rescale=0%2C1.000&format=png"
- type "image/png"
- title "Rendered preview"
- rel "preview"
roles [] 1 items
- 0 "overview"
bbox [] 4 items
- 0 87.30528303
- 1 26.92271277
- 2 90.05015354
- 3 28.84011377
stac_extensions [] 6 items
- 0 "https://stac-extensions.github.io/sar/v1.0.0/schema.json"
- 1 "https://stac-extensions.github.io/sat/v1.0.0/schema.json"
- 2 "https://stac-extensions.github.io/eo/v1.0.0/schema.json"
- 3 "https://stac-extensions.github.io/projection/v1.0.0/schema.json"
- 4 "https://stac-extensions.github.io/file/v2.0.0/schema.json"
- 5 "https://stac-extensions.github.io/raster/v1.1.0/schema.json"
- collection "sentinel-1-rtc"
67
- type "Feature"
- stac_version "1.0.0"
- id "S1A_IW_GRDH_1SDV_20211029T121358_20211029T121423_040334_04C7A8_rtc"
properties
- datetime "2021-10-29T12:14:11.052769Z"
- platform "SENTINEL-1A"
s1:shape [] 2 items
- 0 28237
- 1 21598
proj:bbox [] 4 items
- 0 420890.0
- 1 2916230.0
- 2 703260.0
- 3 3132210.0
- proj:epsg 32645
proj:shape [] 2 items
- 0 21598
- 1 28237
- end_datetime "2021-10-29 12:14:23.551845+00:00"
- constellation "Sentinel-1"
- s1:resolution "high"
proj:transform [] 9 items
- 0 10.0
- 1 0.0
- 2 420890.0
- 3 0.0
- 4 -10.0
- 5 3132210.0
- 6 0.0
- 7 0.0
- 8 1.0
- s1:datatake_id "313256"
- start_datetime "2021-10-29 12:13:58.553693+00:00"
- s1:orbit_source "DOWNLINK"
- s1:slice_number "6"
- s1:total_slices "20"
- sar:looks_range 5
- sat:orbit_state "ascending"
- sar:product_type "GRD"
- sar:looks_azimuth 1
sar:polarizations [] 2 items
- 0 "VV"
- 1 "VH"
- sar:frequency_band "C"
- sat:absolute_orbit 40334
- sat:relative_orbit 12
- s1:processing_level "1"
- sar:instrument_mode "IW"
- sar:center_frequency 5.405
- sar:resolution_range 20
- s1:product_timeliness "Fast-24h"
- sar:resolution_azimuth 22
- sar:pixel_spacing_range 10
- sar:observation_direction "right"
- sar:pixel_spacing_azimuth 10
- sar:looks_equivalent_number 4.4
- s1:instrument_configuration_ID "7"
- sat:platform_international_designator "2014-016A"
geometry
- type "Polygon"
coordinates [] 1 items
0 [] 16 items
0 [] 2 items
- 0 87.8601107
- 1 26.5971051
1 [] 2 items
- 0 86.4981747
- 1 26.3665921
2 [] 2 items
- 0 86.3546284
- 1 27.1610265
3 [] 2 items
- 0 86.3178653
- 1 27.231361
4 [] 2 items
- 0 86.3262822
- 1 27.3762986
5 [] 2 items
- 0 86.2766653
- 1 27.4639794
6 [] 2 items
- 0 86.2699619
- 1 27.6971228
7 [] 2 items
- 0 86.215586
- 1 27.7559535
8 [] 2 items
- 0 86.2340781
- 1 27.7815137
9 [] 2 items
- 0 86.2091037
- 1 27.782366
10 [] 2 items
- 0 86.2031521
- 1 27.8468752
11 [] 2 items
- 0 86.2103641
- 1 27.8817157
12 [] 2 items
- 0 88.7371321
- 1 28.2895308
13 [] 2 items
- 0 88.921931
- 1 27.3275075
14 [] 2 items
- 0 88.9837656
- 1 26.7770002
15 [] 2 items
- 0 87.8601107
- 1 26.5971051
links [] 7 items
0
- rel "collection"
- href "https://planetarycomputer.microsoft.com/api/stac/v1/collections/sentinel-1-rtc"
- type "application/json"
1
- rel "parent"
- href "https://planetarycomputer.microsoft.com/api/stac/v1/collections/sentinel-1-rtc"
- type "application/json"
2
- rel "root"
- href "https://planetarycomputer.microsoft.com/api/stac/v1"
- type "application/json"
- title "Microsoft Planetary Computer STAC API"
3
- rel "self"
- href "https://planetarycomputer.microsoft.com/api/stac/v1/collections/sentinel-1-rtc/items/S1A_IW_GRDH_1SDV_20211029T121358_20211029T121423_040334_04C7A8_rtc"
- type "application/geo+json"
4
- rel "license"
- href "https://sentinel.esa.int/documents/247904/690755/Sentinel_Data_Legal_Notice"
5
- rel "derived_from"
- href "https://planetarycomputer.microsoft.com/api/stac/v1/collections/sentinel-1-grd/items/S1A_IW_GRDH_1SDV_20211029T121358_20211029T121423_040334_04C7A8"
- type "application/json"
- title "Sentinel 1 GRD Item"
6
- rel "preview"
- href "https://planetarycomputer.microsoft.com/api/data/v1/item/map?collection=sentinel-1-rtc&item=S1A_IW_GRDH_1SDV_20211029T121358_20211029T121423_040334_04C7A8_rtc"
- type "text/html"
- title "Map of item"
assets
vh
- href "https://sentinel1euwestrtc.blob.core.windows.net/sentinel1-grd-rtc/GRD/2021/10/29/IW/DV/S1A_IW_GRDH_1SDV_20211029T121358_20211029T121423_040334_04C7A8_C4DB/measurement/iw-vh.rtc.tiff"
- type "image/tiff; application=geotiff; profile=cloud-optimized"
- title "VH: vertical transmit, horizontal receive"
- description "Terrain-corrected gamma naught values of signal transmitted with vertical polarization and received with horizontal polarization with radiometric terrain correction applied."
- file:size 1868096021
- file:checksum "28bc610a1d14686677a955e1541b6463"
raster:bands [] 1 items
0
- nodata -32768
- data_type "float32"
- spatial_resolution 10.0
roles [] 1 items
- 0 "data"
vv
- href "https://sentinel1euwestrtc.blob.core.windows.net/sentinel1-grd-rtc/GRD/2021/10/29/IW/DV/S1A_IW_GRDH_1SDV_20211029T121358_20211029T121423_040334_04C7A8_C4DB/measurement/iw-vv.rtc.tiff"
- type "image/tiff; application=geotiff; profile=cloud-optimized"
- title "VV: vertical transmit, vertical receive"
- description "Terrain-corrected gamma naught values of signal transmitted with vertical polarization and received with vertical polarization with radiometric terrain correction applied."
- file:size 1876325502
- file:checksum "cbdaf76c5f862445c665865d3433ad4c"
raster:bands [] 1 items
0
- nodata -32768
- data_type "float32"
- spatial_resolution 10.0
roles [] 1 items
- 0 "data"
tilejson
- href "https://planetarycomputer.microsoft.com/api/data/v1/item/tilejson.json?collection=sentinel-1-rtc&item=S1A_IW_GRDH_1SDV_20211029T121358_20211029T121423_040334_04C7A8_rtc&assets=vv&assets=vh&tile_format=png&expression=0.03+%2B+log+%2810e-4+-+log+%280.05+%2F+%280.02+%2B+2+%2A+vv%29%29%29%3B0.05+%2B+exp+%280.25+%2A+%28log+%280.01+%2B+2+%2A+vv%29+%2B+log+%280.02+%2B+5+%2A+vh%29%29%29%3B1+-+log+%280.05+%2F+%280.045+-+0.9+%2A+vv%29%29&asset_as_band=True&rescale=0%2C.8000&rescale=0%2C1.000&rescale=0%2C1.000&format=png"
- type "application/json"
- title "TileJSON with default rendering"
roles [] 1 items
- 0 "tiles"
rendered_preview
- href "https://planetarycomputer.microsoft.com/api/data/v1/item/preview.png?collection=sentinel-1-rtc&item=S1A_IW_GRDH_1SDV_20211029T121358_20211029T121423_040334_04C7A8_rtc&assets=vv&assets=vh&tile_format=png&expression=0.03+%2B+log+%2810e-4+-+log+%280.05+%2F+%280.02+%2B+2+%2A+vv%29%29%29%3B0.05+%2B+exp+%280.25+%2A+%28log+%280.01+%2B+2+%2A+vv%29+%2B+log+%280.02+%2B+5+%2A+vh%29%29%29%3B1+-+log+%280.05+%2F+%280.045+-+0.9+%2A+vv%29%29&asset_as_band=True&rescale=0%2C.8000&rescale=0%2C1.000&rescale=0%2C1.000&format=png"
- type "image/png"
- title "Rendered preview"
- rel "preview"
roles [] 1 items
- 0 "overview"
bbox [] 4 items
- 0 86.20315214
- 1 26.36659209
- 2 88.98376558
- 3 28.28953078
stac_extensions [] 6 items
- 0 "https://stac-extensions.github.io/sar/v1.0.0/schema.json"
- 1 "https://stac-extensions.github.io/sat/v1.0.0/schema.json"
- 2 "https://stac-extensions.github.io/eo/v1.0.0/schema.json"
- 3 "https://stac-extensions.github.io/projection/v1.0.0/schema.json"
- 4 "https://stac-extensions.github.io/file/v2.0.0/schema.json"
- 5 "https://stac-extensions.github.io/raster/v1.1.0/schema.json"
- collection "sentinel-1-rtc"
68
- type "Feature"
- stac_version "1.0.0"
- id "S1A_IW_GRDH_1SDV_20211024T120551_20211024T120616_040261_04C52E_rtc"
properties
- datetime "2021-10-24T12:06:03.954256Z"
- platform "SENTINEL-1A"
s1:shape [] 2 items
- 0 28429
- 1 21972
proj:bbox [] 4 items
- 0 618130.0
- 1 2960440.0
- 2 902420.0
- 3 3180160.0
- proj:epsg 32645
proj:shape [] 2 items
- 0 21972
- 1 28429
- end_datetime "2021-10-24 12:06:16.454118+00:00"
- constellation "Sentinel-1"
- s1:resolution "high"
proj:transform [] 9 items
- 0 10.0
- 1 0.0
- 2 618130.0
- 3 0.0
- 4 -10.0
- 5 3180160.0
- 6 0.0
- 7 0.0
- 8 1.0
- s1:datatake_id "312622"
- start_datetime "2021-10-24 12:05:51.454394+00:00"
- s1:orbit_source "DOWNLINK"
- s1:slice_number "6"
- s1:total_slices "21"
- sar:looks_range 5
- sat:orbit_state "ascending"
- sar:product_type "GRD"
- sar:looks_azimuth 1
sar:polarizations [] 2 items
- 0 "VV"
- 1 "VH"
- sar:frequency_band "C"
- sat:absolute_orbit 40261
- sat:relative_orbit 114
- s1:processing_level "1"
- sar:instrument_mode "IW"
- sar:center_frequency 5.405
- sar:resolution_range 20
- s1:product_timeliness "Fast-24h"
- sar:resolution_azimuth 22
- sar:pixel_spacing_range 10
- sar:observation_direction "right"
- sar:pixel_spacing_azimuth 10
- sar:looks_equivalent_number 4.4
- s1:instrument_configuration_ID "7"
- sat:platform_international_designator "2014-016A"
geometry
- type "Polygon"
coordinates [] 1 items
0 [] 14 items
0 [] 2 items
- 0 89.9820453
- 1 27.012687
1 [] 2 items
- 0 90.993137
- 1 27.1729413
2 [] 2 items
- 0 90.7242452
- 1 28.6820226
3 [] 2 items
- 0 88.2169702
- 1 28.2798591
4 [] 2 items
- 0 88.3541569
- 1 27.7231154
5 [] 2 items
- 0 88.3293477
- 1 27.5840793
6 [] 2 items
- 0 88.3757808
- 1 27.5219768
7 [] 2 items
- 0 88.3573873
- 1 27.4090551
8 [] 2 items
- 0 88.399762
- 1 27.3364238
9 [] 2 items
- 0 88.3788285
- 1 27.3028723
10 [] 2 items
- 0 88.4158044
- 1 27.2066396
11 [] 2 items
- 0 88.4036392
- 1 27.089594
12 [] 2 items
- 0 88.4747285
- 1 26.7596093
13 [] 2 items
- 0 89.9820453
- 1 27.012687
links [] 7 items
0
- rel "collection"
- href "https://planetarycomputer.microsoft.com/api/stac/v1/collections/sentinel-1-rtc"
- type "application/json"
1
- rel "parent"
- href "https://planetarycomputer.microsoft.com/api/stac/v1/collections/sentinel-1-rtc"
- type "application/json"
2
- rel "root"
- href "https://planetarycomputer.microsoft.com/api/stac/v1"
- type "application/json"
- title "Microsoft Planetary Computer STAC API"
3
- rel "self"
- href "https://planetarycomputer.microsoft.com/api/stac/v1/collections/sentinel-1-rtc/items/S1A_IW_GRDH_1SDV_20211024T120551_20211024T120616_040261_04C52E_rtc"
- type "application/geo+json"
4
- rel "license"
- href "https://sentinel.esa.int/documents/247904/690755/Sentinel_Data_Legal_Notice"
5
- rel "derived_from"
- href "https://planetarycomputer.microsoft.com/api/stac/v1/collections/sentinel-1-grd/items/S1A_IW_GRDH_1SDV_20211024T120551_20211024T120616_040261_04C52E"
- type "application/json"
- title "Sentinel 1 GRD Item"
6
- rel "preview"
- href "https://planetarycomputer.microsoft.com/api/data/v1/item/map?collection=sentinel-1-rtc&item=S1A_IW_GRDH_1SDV_20211024T120551_20211024T120616_040261_04C52E_rtc"
- type "text/html"
- title "Map of item"
assets
vh
- href "https://sentinel1euwestrtc.blob.core.windows.net/sentinel1-grd-rtc/GRD/2021/10/24/IW/DV/S1A_IW_GRDH_1SDV_20211024T120551_20211024T120616_040261_04C52E_779A/measurement/iw-vh.rtc.tiff"
- type "image/tiff; application=geotiff; profile=cloud-optimized"
- title "VH: vertical transmit, horizontal receive"
- description "Terrain-corrected gamma naught values of signal transmitted with vertical polarization and received with horizontal polarization with radiometric terrain correction applied."
- file:size 1850705799
- file:checksum "a934b657a0cfa7171320d8e582bb2910"
raster:bands [] 1 items
0
- nodata -32768
- data_type "float32"
- spatial_resolution 10.0
roles [] 1 items
- 0 "data"
vv
- href "https://sentinel1euwestrtc.blob.core.windows.net/sentinel1-grd-rtc/GRD/2021/10/24/IW/DV/S1A_IW_GRDH_1SDV_20211024T120551_20211024T120616_040261_04C52E_779A/measurement/iw-vv.rtc.tiff"
- type "image/tiff; application=geotiff; profile=cloud-optimized"
- title "VV: vertical transmit, vertical receive"
- description "Terrain-corrected gamma naught values of signal transmitted with vertical polarization and received with vertical polarization with radiometric terrain correction applied."
- file:size 1859367383
- file:checksum "077b9a4b6436345ba4788cb2713061e5"
raster:bands [] 1 items
0
- nodata -32768
- data_type "float32"
- spatial_resolution 10.0
roles [] 1 items
- 0 "data"
tilejson
- href "https://planetarycomputer.microsoft.com/api/data/v1/item/tilejson.json?collection=sentinel-1-rtc&item=S1A_IW_GRDH_1SDV_20211024T120551_20211024T120616_040261_04C52E_rtc&assets=vv&assets=vh&tile_format=png&expression=0.03+%2B+log+%2810e-4+-+log+%280.05+%2F+%280.02+%2B+2+%2A+vv%29%29%29%3B0.05+%2B+exp+%280.25+%2A+%28log+%280.01+%2B+2+%2A+vv%29+%2B+log+%280.02+%2B+5+%2A+vh%29%29%29%3B1+-+log+%280.05+%2F+%280.045+-+0.9+%2A+vv%29%29&asset_as_band=True&rescale=0%2C.8000&rescale=0%2C1.000&rescale=0%2C1.000&format=png"
- type "application/json"
- title "TileJSON with default rendering"
roles [] 1 items
- 0 "tiles"
rendered_preview
- href "https://planetarycomputer.microsoft.com/api/data/v1/item/preview.png?collection=sentinel-1-rtc&item=S1A_IW_GRDH_1SDV_20211024T120551_20211024T120616_040261_04C52E_rtc&assets=vv&assets=vh&tile_format=png&expression=0.03+%2B+log+%2810e-4+-+log+%280.05+%2F+%280.02+%2B+2+%2A+vv%29%29%29%3B0.05+%2B+exp+%280.25+%2A+%28log+%280.01+%2B+2+%2A+vv%29+%2B+log+%280.02+%2B+5+%2A+vh%29%29%29%3B1+-+log+%280.05+%2F+%280.045+-+0.9+%2A+vv%29%29&asset_as_band=True&rescale=0%2C.8000&rescale=0%2C1.000&rescale=0%2C1.000&format=png"
- type "image/png"
- title "Rendered preview"
- rel "preview"
roles [] 1 items
- 0 "overview"
bbox [] 4 items
- 0 88.21697018
- 1 26.75960925
- 2 90.993137
- 3 28.68202261
stac_extensions [] 6 items
- 0 "https://stac-extensions.github.io/sar/v1.0.0/schema.json"
- 1 "https://stac-extensions.github.io/sat/v1.0.0/schema.json"
- 2 "https://stac-extensions.github.io/eo/v1.0.0/schema.json"
- 3 "https://stac-extensions.github.io/projection/v1.0.0/schema.json"
- 4 "https://stac-extensions.github.io/file/v2.0.0/schema.json"
- 5 "https://stac-extensions.github.io/raster/v1.1.0/schema.json"
- collection "sentinel-1-rtc"
69
- type "Feature"
- stac_version "1.0.0"
- id "S1A_IW_GRDH_1SDV_20211020T000317_20211020T000342_040195_04C2D6_rtc"
properties
- datetime "2021-10-20T00:03:29.919736Z"
- platform "SENTINEL-1A"
s1:shape [] 2 items
- 0 27541
- 1 21083
proj:bbox [] 4 items
- 0 524380.0
- 1 2980840.0
- 2 799790.0
- 3 3191670.0
- proj:epsg 32645
proj:shape [] 2 items
- 0 21083
- 1 27541
- end_datetime "2021-10-20 00:03:42.418433+00:00"
- constellation "Sentinel-1"
- s1:resolution "high"
proj:transform [] 9 items
- 0 10.0
- 1 0.0
- 2 524380.0
- 3 0.0
- 4 -10.0
- 5 3191670.0
- 6 0.0
- 7 0.0
- 8 1.0
- s1:datatake_id "312022"
- start_datetime "2021-10-20 00:03:17.421040+00:00"
- s1:orbit_source "DOWNLINK"
- s1:slice_number "12"
- s1:total_slices "17"
- sar:looks_range 5
- sat:orbit_state "descending"
- sar:product_type "GRD"
- sar:looks_azimuth 1
sar:polarizations [] 2 items
- 0 "VV"
- 1 "VH"
- sar:frequency_band "C"
- sat:absolute_orbit 40195
- sat:relative_orbit 48
- s1:processing_level "1"
- sar:instrument_mode "IW"
- sar:center_frequency 5.405
- sar:resolution_range 20
- s1:product_timeliness "Fast-24h"
- sar:resolution_azimuth 22
- sar:pixel_spacing_range 10
- sar:observation_direction "right"
- sar:pixel_spacing_azimuth 10
- sar:looks_equivalent_number 4.4
- s1:instrument_configuration_ID "7"
- sat:platform_international_designator "2014-016A"
geometry
- type "Polygon"
coordinates [] 1 items
0 [] 19 items
0 [] 2 items
- 0 89.8043162
- 1 27.0229273
1 [] 2 items
- 0 89.7771389
- 1 26.9951815
2 [] 2 items
- 0 89.7847699
- 1 26.9226266
3 [] 2 items
- 0 87.3047769
- 1 27.3292917
4 [] 2 items
- 0 87.4257918
- 1 28.1938067
5 [] 2 items
- 0 87.558327
- 1 28.8400252
6 [] 2 items
- 0 90.0497456
- 1 28.4415936
7 [] 2 items
- 0 90.0262276
- 1 28.290901
8 [] 2 items
- 0 89.9732364
- 1 28.1917611
9 [] 2 items
- 0 89.9977812
- 1 28.1482892
10 [] 2 items
- 0 89.9711833
- 1 28.0842833
11 [] 2 items
- 0 89.9876168
- 1 28.0018411
12 [] 2 items
- 0 89.9442439
- 1 27.9503678
13 [] 2 items
- 0 89.9292608
- 1 27.8241264
14 [] 2 items
- 0 89.9525145
- 1 27.6783057
15 [] 2 items
- 0 89.9218132
- 1 27.6326792
16 [] 2 items
- 0 89.9031394
- 1 27.4311766
17 [] 2 items
- 0 89.8291857
- 1 27.2744573
18 [] 2 items
- 0 89.8043162
- 1 27.0229273
links [] 7 items
0
- rel "collection"
- href "https://planetarycomputer.microsoft.com/api/stac/v1/collections/sentinel-1-rtc"
- type "application/json"
1
- rel "parent"
- href "https://planetarycomputer.microsoft.com/api/stac/v1/collections/sentinel-1-rtc"
- type "application/json"
2
- rel "root"
- href "https://planetarycomputer.microsoft.com/api/stac/v1"
- type "application/json"
- title "Microsoft Planetary Computer STAC API"
3
- rel "self"
- href "https://planetarycomputer.microsoft.com/api/stac/v1/collections/sentinel-1-rtc/items/S1A_IW_GRDH_1SDV_20211020T000317_20211020T000342_040195_04C2D6_rtc"
- type "application/geo+json"
4
- rel "license"
- href "https://sentinel.esa.int/documents/247904/690755/Sentinel_Data_Legal_Notice"
5
- rel "derived_from"
- href "https://planetarycomputer.microsoft.com/api/stac/v1/collections/sentinel-1-grd/items/S1A_IW_GRDH_1SDV_20211020T000317_20211020T000342_040195_04C2D6"
- type "application/json"
- title "Sentinel 1 GRD Item"
6
- rel "preview"
- href "https://planetarycomputer.microsoft.com/api/data/v1/item/map?collection=sentinel-1-rtc&item=S1A_IW_GRDH_1SDV_20211020T000317_20211020T000342_040195_04C2D6_rtc"
- type "text/html"
- title "Map of item"
assets
vh
- href "https://sentinel1euwestrtc.blob.core.windows.net/sentinel1-grd-rtc/GRD/2021/10/20/IW/DV/S1A_IW_GRDH_1SDV_20211020T000317_20211020T000342_040195_04C2D6_30CD/measurement/iw-vh.rtc.tiff"
- type "image/tiff; application=geotiff; profile=cloud-optimized"
- title "VH: vertical transmit, horizontal receive"
- description "Terrain-corrected gamma naught values of signal transmitted with vertical polarization and received with horizontal polarization with radiometric terrain correction applied."
- file:size 1837388933
- file:checksum "367bb9da12894c3f90ce59088d994f53"
raster:bands [] 1 items
0
- nodata -32768
- data_type "float32"
- spatial_resolution 10.0
roles [] 1 items
- 0 "data"
vv
- href "https://sentinel1euwestrtc.blob.core.windows.net/sentinel1-grd-rtc/GRD/2021/10/20/IW/DV/S1A_IW_GRDH_1SDV_20211020T000317_20211020T000342_040195_04C2D6_30CD/measurement/iw-vv.rtc.tiff"
- type "image/tiff; application=geotiff; profile=cloud-optimized"
- title "VV: vertical transmit, vertical receive"
- description "Terrain-corrected gamma naught values of signal transmitted with vertical polarization and received with vertical polarization with radiometric terrain correction applied."
- file:size 1845275938
- file:checksum "809bf64527b13dc436748d6d3eae6cfb"
raster:bands [] 1 items
0
- nodata -32768
- data_type "float32"
- spatial_resolution 10.0
roles [] 1 items
- 0 "data"
tilejson
- href "https://planetarycomputer.microsoft.com/api/data/v1/item/tilejson.json?collection=sentinel-1-rtc&item=S1A_IW_GRDH_1SDV_20211020T000317_20211020T000342_040195_04C2D6_rtc&assets=vv&assets=vh&tile_format=png&expression=0.03+%2B+log+%2810e-4+-+log+%280.05+%2F+%280.02+%2B+2+%2A+vv%29%29%29%3B0.05+%2B+exp+%280.25+%2A+%28log+%280.01+%2B+2+%2A+vv%29+%2B+log+%280.02+%2B+5+%2A+vh%29%29%29%3B1+-+log+%280.05+%2F+%280.045+-+0.9+%2A+vv%29%29&asset_as_band=True&rescale=0%2C.8000&rescale=0%2C1.000&rescale=0%2C1.000&format=png"
- type "application/json"
- title "TileJSON with default rendering"
roles [] 1 items
- 0 "tiles"
rendered_preview
- href "https://planetarycomputer.microsoft.com/api/data/v1/item/preview.png?collection=sentinel-1-rtc&item=S1A_IW_GRDH_1SDV_20211020T000317_20211020T000342_040195_04C2D6_rtc&assets=vv&assets=vh&tile_format=png&expression=0.03+%2B+log+%2810e-4+-+log+%280.05+%2F+%280.02+%2B+2+%2A+vv%29%29%29%3B0.05+%2B+exp+%280.25+%2A+%28log+%280.01+%2B+2+%2A+vv%29+%2B+log+%280.02+%2B+5+%2A+vh%29%29%29%3B1+-+log+%280.05+%2F+%280.045+-+0.9+%2A+vv%29%29&asset_as_band=True&rescale=0%2C.8000&rescale=0%2C1.000&rescale=0%2C1.000&format=png"
- type "image/png"
- title "Rendered preview"
- rel "preview"
roles [] 1 items
- 0 "overview"
bbox [] 4 items
- 0 87.30477686
- 1 26.92262656
- 2 90.04974562
- 3 28.84002521
stac_extensions [] 6 items
- 0 "https://stac-extensions.github.io/sar/v1.0.0/schema.json"
- 1 "https://stac-extensions.github.io/sat/v1.0.0/schema.json"
- 2 "https://stac-extensions.github.io/eo/v1.0.0/schema.json"
- 3 "https://stac-extensions.github.io/projection/v1.0.0/schema.json"
- 4 "https://stac-extensions.github.io/file/v2.0.0/schema.json"
- 5 "https://stac-extensions.github.io/raster/v1.1.0/schema.json"
- collection "sentinel-1-rtc"
70
- type "Feature"
- stac_version "1.0.0"
- id "S1A_IW_GRDH_1SDV_20211017T121358_20211017T121423_040159_04C195_rtc"
properties
- datetime "2021-10-17T12:14:11.200359Z"
- platform "SENTINEL-1A"
s1:shape [] 2 items
- 0 28151
- 1 21598
proj:bbox [] 4 items
- 0 421810.0
- 1 2916230.0
- 2 703320.0
- 3 3132210.0
- proj:epsg 32645
proj:shape [] 2 items
- 0 21598
- 1 28151
- end_datetime "2021-10-17 12:14:23.699399+00:00"
- constellation "Sentinel-1"
- s1:resolution "high"
proj:transform [] 9 items
- 0 10.0
- 1 0.0
- 2 421810.0
- 3 0.0
- 4 -10.0
- 5 3132210.0
- 6 0.0
- 7 0.0
- 8 1.0
- s1:datatake_id "311701"
- start_datetime "2021-10-17 12:13:58.701319+00:00"
- s1:orbit_source "DOWNLINK"
- s1:slice_number "6"
- s1:total_slices "20"
- sar:looks_range 5
- sat:orbit_state "ascending"
- sar:product_type "GRD"
- sar:looks_azimuth 1
sar:polarizations [] 2 items
- 0 "VV"
- 1 "VH"
- sar:frequency_band "C"
- sat:absolute_orbit 40159
- sat:relative_orbit 12
- s1:processing_level "1"
- sar:instrument_mode "IW"
- sar:center_frequency 5.405
- sar:resolution_range 20
- s1:product_timeliness "Fast-24h"
- sar:resolution_azimuth 22
- sar:pixel_spacing_range 10
- sar:observation_direction "right"
- sar:pixel_spacing_azimuth 10
- sar:looks_equivalent_number 4.4
- s1:instrument_configuration_ID "7"
- sat:platform_international_designator "2014-016A"
geometry
- type "Polygon"
coordinates [] 1 items
0 [] 15 items
0 [] 2 items
- 0 86.2059148
- 1 27.8440476
1 [] 2 items
- 0 86.2109736
- 1 27.8817191
2 [] 2 items
- 0 88.7379476
- 1 28.2895204
3 [] 2 items
- 0 88.9223335
- 1 27.3274117
4 [] 2 items
- 0 88.9844693
- 1 26.7769904
5 [] 2 items
- 0 86.4988763
- 1 26.3665946
6 [] 2 items
- 0 86.3552335
- 1 27.1611195
7 [] 2 items
- 0 86.3184702
- 1 27.2315445
8 [] 2 items
- 0 86.3267791
- 1 27.3777454
9 [] 2 items
- 0 86.2773708
- 1 27.4644345
10 [] 2 items
- 0 86.2706694
- 1 27.6974876
11 [] 2 items
- 0 86.2161929
- 1 27.7562277
12 [] 2 items
- 0 86.2345862
- 1 27.7814262
13 [] 2 items
- 0 86.2099137
- 1 27.7826414
14 [] 2 items
- 0 86.2059148
- 1 27.8440476
links [] 7 items
0
- rel "collection"
- href "https://planetarycomputer.microsoft.com/api/stac/v1/collections/sentinel-1-rtc"
- type "application/json"
1
- rel "parent"
- href "https://planetarycomputer.microsoft.com/api/stac/v1/collections/sentinel-1-rtc"
- type "application/json"
2
- rel "root"
- href "https://planetarycomputer.microsoft.com/api/stac/v1"
- type "application/json"
- title "Microsoft Planetary Computer STAC API"
3
- rel "self"
- href "https://planetarycomputer.microsoft.com/api/stac/v1/collections/sentinel-1-rtc/items/S1A_IW_GRDH_1SDV_20211017T121358_20211017T121423_040159_04C195_rtc"
- type "application/geo+json"
4
- rel "license"
- href "https://sentinel.esa.int/documents/247904/690755/Sentinel_Data_Legal_Notice"
5
- rel "derived_from"
- href "https://planetarycomputer.microsoft.com/api/stac/v1/collections/sentinel-1-grd/items/S1A_IW_GRDH_1SDV_20211017T121358_20211017T121423_040159_04C195"
- type "application/json"
- title "Sentinel 1 GRD Item"
6
- rel "preview"
- href "https://planetarycomputer.microsoft.com/api/data/v1/item/map?collection=sentinel-1-rtc&item=S1A_IW_GRDH_1SDV_20211017T121358_20211017T121423_040159_04C195_rtc"
- type "text/html"
- title "Map of item"
assets
vh
- href "https://sentinel1euwestrtc.blob.core.windows.net/sentinel1-grd-rtc/GRD/2021/10/17/IW/DV/S1A_IW_GRDH_1SDV_20211017T121358_20211017T121423_040159_04C195_E0B1/measurement/iw-vh.rtc.tiff"
- type "image/tiff; application=geotiff; profile=cloud-optimized"
- title "VH: vertical transmit, horizontal receive"
- description "Terrain-corrected gamma naught values of signal transmitted with vertical polarization and received with horizontal polarization with radiometric terrain correction applied."
- file:size 1866566882
- file:checksum "5a20cbca9e7a5acda9ba0705a3d75828"
raster:bands [] 1 items
0
- nodata -32768
- data_type "float32"
- spatial_resolution 10.0
roles [] 1 items
- 0 "data"
vv
- href "https://sentinel1euwestrtc.blob.core.windows.net/sentinel1-grd-rtc/GRD/2021/10/17/IW/DV/S1A_IW_GRDH_1SDV_20211017T121358_20211017T121423_040159_04C195_E0B1/measurement/iw-vv.rtc.tiff"
- type "image/tiff; application=geotiff; profile=cloud-optimized"
- title "VV: vertical transmit, vertical receive"
- description "Terrain-corrected gamma naught values of signal transmitted with vertical polarization and received with vertical polarization with radiometric terrain correction applied."
- file:size 1874668635
- file:checksum "dea3f11d3fb08a7ff1a3354e182a6e97"
raster:bands [] 1 items
0
- nodata -32768
- data_type "float32"
- spatial_resolution 10.0
roles [] 1 items
- 0 "data"
tilejson
- href "https://planetarycomputer.microsoft.com/api/data/v1/item/tilejson.json?collection=sentinel-1-rtc&item=S1A_IW_GRDH_1SDV_20211017T121358_20211017T121423_040159_04C195_rtc&assets=vv&assets=vh&tile_format=png&expression=0.03+%2B+log+%2810e-4+-+log+%280.05+%2F+%280.02+%2B+2+%2A+vv%29%29%29%3B0.05+%2B+exp+%280.25+%2A+%28log+%280.01+%2B+2+%2A+vv%29+%2B+log+%280.02+%2B+5+%2A+vh%29%29%29%3B1+-+log+%280.05+%2F+%280.045+-+0.9+%2A+vv%29%29&asset_as_band=True&rescale=0%2C.8000&rescale=0%2C1.000&rescale=0%2C1.000&format=png"
- type "application/json"
- title "TileJSON with default rendering"
roles [] 1 items
- 0 "tiles"
rendered_preview
- href "https://planetarycomputer.microsoft.com/api/data/v1/item/preview.png?collection=sentinel-1-rtc&item=S1A_IW_GRDH_1SDV_20211017T121358_20211017T121423_040159_04C195_rtc&assets=vv&assets=vh&tile_format=png&expression=0.03+%2B+log+%2810e-4+-+log+%280.05+%2F+%280.02+%2B+2+%2A+vv%29%29%29%3B0.05+%2B+exp+%280.25+%2A+%28log+%280.01+%2B+2+%2A+vv%29+%2B+log+%280.02+%2B+5+%2A+vh%29%29%29%3B1+-+log+%280.05+%2F+%280.045+-+0.9+%2A+vv%29%29&asset_as_band=True&rescale=0%2C.8000&rescale=0%2C1.000&rescale=0%2C1.000&format=png"
- type "image/png"
- title "Rendered preview"
- rel "preview"
roles [] 1 items
- 0 "overview"
bbox [] 4 items
- 0 86.20591478
- 1 26.36659455
- 2 88.98446931
- 3 28.2895204
stac_extensions [] 6 items
- 0 "https://stac-extensions.github.io/sar/v1.0.0/schema.json"
- 1 "https://stac-extensions.github.io/sat/v1.0.0/schema.json"
- 2 "https://stac-extensions.github.io/eo/v1.0.0/schema.json"
- 3 "https://stac-extensions.github.io/projection/v1.0.0/schema.json"
- 4 "https://stac-extensions.github.io/file/v2.0.0/schema.json"
- 5 "https://stac-extensions.github.io/raster/v1.1.0/schema.json"
- collection "sentinel-1-rtc"
71
- type "Feature"
- stac_version "1.0.0"
- id "S1A_IW_GRDH_1SDV_20211012T120551_20211012T120616_040086_04BF12_rtc"
properties
- datetime "2021-10-12T12:06:03.850150Z"
- platform "SENTINEL-1A"
s1:shape [] 2 items
- 0 28429
- 1 21971
proj:bbox [] 4 items
- 0 618120.0
- 1 2960460.0
- 2 902410.0
- 3 3180170.0
- proj:epsg 32645
proj:shape [] 2 items
- 0 21971
- 1 28429
- end_datetime "2021-10-12 12:06:16.349229+00:00"
- constellation "Sentinel-1"
- s1:resolution "high"
proj:transform [] 9 items
- 0 10.0
- 1 0.0
- 2 618120.0
- 3 0.0
- 4 -10.0
- 5 3180170.0
- 6 0.0
- 7 0.0
- 8 1.0
- s1:datatake_id "311058"
- start_datetime "2021-10-12 12:05:51.351071+00:00"
- s1:orbit_source "DOWNLINK"
- s1:slice_number "6"
- s1:total_slices "21"
- sar:looks_range 5
- sat:orbit_state "ascending"
- sar:product_type "GRD"
- sar:looks_azimuth 1
sar:polarizations [] 2 items
- 0 "VV"
- 1 "VH"
- sar:frequency_band "C"
- sat:absolute_orbit 40086
- sat:relative_orbit 114
- s1:processing_level "1"
- sar:instrument_mode "IW"
- sar:center_frequency 5.405
- sar:resolution_range 20
- s1:product_timeliness "Fast-24h"
- sar:resolution_azimuth 22
- sar:pixel_spacing_range 10
- sar:observation_direction "right"
- sar:pixel_spacing_azimuth 10
- sar:looks_equivalent_number 4.4
- s1:instrument_configuration_ID "7"
- sat:platform_international_designator "2014-016A"
geometry
- type "Polygon"
coordinates [] 1 items
0 [] 14 items
0 [] 2 items
- 0 89.9815443
- 1 27.0127878
1 [] 2 items
- 0 90.9928381
- 1 27.17304
2 [] 2 items
- 0 90.7241463
- 1 28.6821155
3 [] 2 items
- 0 88.2168693
- 1 28.2799502
4 [] 2 items
- 0 88.3540533
- 1 27.7229359
5 [] 2 items
- 0 88.3292475
- 1 27.5841705
6 [] 2 items
- 0 88.3757786
- 1 27.5217963
7 [] 2 items
- 0 88.3572861
- 1 27.4090561
8 [] 2 items
- 0 88.3997586
- 1 27.336153
9 [] 2 items
- 0 88.3787308
- 1 27.3031441
10 [] 2 items
- 0 88.4158022
- 1 27.2064591
11 [] 2 items
- 0 88.4035384
- 1 27.089595
12 [] 2 items
- 0 88.4746303
- 1 26.7597908
13 [] 2 items
- 0 89.9815443
- 1 27.0127878
links [] 7 items
0
- rel "collection"
- href "https://planetarycomputer.microsoft.com/api/stac/v1/collections/sentinel-1-rtc"
- type "application/json"
1
- rel "parent"
- href "https://planetarycomputer.microsoft.com/api/stac/v1/collections/sentinel-1-rtc"
- type "application/json"
2
- rel "root"
- href "https://planetarycomputer.microsoft.com/api/stac/v1"
- type "application/json"
- title "Microsoft Planetary Computer STAC API"
3
- rel "self"
- href "https://planetarycomputer.microsoft.com/api/stac/v1/collections/sentinel-1-rtc/items/S1A_IW_GRDH_1SDV_20211012T120551_20211012T120616_040086_04BF12_rtc"
- type "application/geo+json"
4
- rel "license"
- href "https://sentinel.esa.int/documents/247904/690755/Sentinel_Data_Legal_Notice"
5
- rel "derived_from"
- href "https://planetarycomputer.microsoft.com/api/stac/v1/collections/sentinel-1-grd/items/S1A_IW_GRDH_1SDV_20211012T120551_20211012T120616_040086_04BF12"
- type "application/json"
- title "Sentinel 1 GRD Item"
6
- rel "preview"
- href "https://planetarycomputer.microsoft.com/api/data/v1/item/map?collection=sentinel-1-rtc&item=S1A_IW_GRDH_1SDV_20211012T120551_20211012T120616_040086_04BF12_rtc"
- type "text/html"
- title "Map of item"
assets
vh
- href "https://sentinel1euwestrtc.blob.core.windows.net/sentinel1-grd-rtc/GRD/2021/10/12/IW/DV/S1A_IW_GRDH_1SDV_20211012T120551_20211012T120616_040086_04BF12_3ED7/measurement/iw-vh.rtc.tiff"
- type "image/tiff; application=geotiff; profile=cloud-optimized"
- title "VH: vertical transmit, horizontal receive"
- description "Terrain-corrected gamma naught values of signal transmitted with vertical polarization and received with horizontal polarization with radiometric terrain correction applied."
- file:size 1850216981
- file:checksum "ea0091b9d9488e7eb5c9fe12d060c6cd"
raster:bands [] 1 items
0
- nodata -32768
- data_type "float32"
- spatial_resolution 10.0
roles [] 1 items
- 0 "data"
vv
- href "https://sentinel1euwestrtc.blob.core.windows.net/sentinel1-grd-rtc/GRD/2021/10/12/IW/DV/S1A_IW_GRDH_1SDV_20211012T120551_20211012T120616_040086_04BF12_3ED7/measurement/iw-vv.rtc.tiff"
- type "image/tiff; application=geotiff; profile=cloud-optimized"
- title "VV: vertical transmit, vertical receive"
- description "Terrain-corrected gamma naught values of signal transmitted with vertical polarization and received with vertical polarization with radiometric terrain correction applied."
- file:size 1858234391
- file:checksum "657a19e3caded899a4e23753d02dd530"
raster:bands [] 1 items
0
- nodata -32768
- data_type "float32"
- spatial_resolution 10.0
roles [] 1 items
- 0 "data"
tilejson
- href "https://planetarycomputer.microsoft.com/api/data/v1/item/tilejson.json?collection=sentinel-1-rtc&item=S1A_IW_GRDH_1SDV_20211012T120551_20211012T120616_040086_04BF12_rtc&assets=vv&assets=vh&tile_format=png&expression=0.03+%2B+log+%2810e-4+-+log+%280.05+%2F+%280.02+%2B+2+%2A+vv%29%29%29%3B0.05+%2B+exp+%280.25+%2A+%28log+%280.01+%2B+2+%2A+vv%29+%2B+log+%280.02+%2B+5+%2A+vh%29%29%29%3B1+-+log+%280.05+%2F+%280.045+-+0.9+%2A+vv%29%29&asset_as_band=True&rescale=0%2C.8000&rescale=0%2C1.000&rescale=0%2C1.000&format=png"
- type "application/json"
- title "TileJSON with default rendering"
roles [] 1 items
- 0 "tiles"
rendered_preview
- href "https://planetarycomputer.microsoft.com/api/data/v1/item/preview.png?collection=sentinel-1-rtc&item=S1A_IW_GRDH_1SDV_20211012T120551_20211012T120616_040086_04BF12_rtc&assets=vv&assets=vh&tile_format=png&expression=0.03+%2B+log+%2810e-4+-+log+%280.05+%2F+%280.02+%2B+2+%2A+vv%29%29%29%3B0.05+%2B+exp+%280.25+%2A+%28log+%280.01+%2B+2+%2A+vv%29+%2B+log+%280.02+%2B+5+%2A+vh%29%29%29%3B1+-+log+%280.05+%2F+%280.045+-+0.9+%2A+vv%29%29&asset_as_band=True&rescale=0%2C.8000&rescale=0%2C1.000&rescale=0%2C1.000&format=png"
- type "image/png"
- title "Rendered preview"
- rel "preview"
roles [] 1 items
- 0 "overview"
bbox [] 4 items
- 0 88.21686926
- 1 26.75979082
- 2 90.99283811
- 3 28.6821155
stac_extensions [] 6 items
- 0 "https://stac-extensions.github.io/sar/v1.0.0/schema.json"
- 1 "https://stac-extensions.github.io/sat/v1.0.0/schema.json"
- 2 "https://stac-extensions.github.io/eo/v1.0.0/schema.json"
- 3 "https://stac-extensions.github.io/projection/v1.0.0/schema.json"
- 4 "https://stac-extensions.github.io/file/v2.0.0/schema.json"
- 5 "https://stac-extensions.github.io/raster/v1.1.0/schema.json"
- collection "sentinel-1-rtc"
72
- type "Feature"
- stac_version "1.0.0"
- id "S1A_IW_GRDH_1SDV_20211008T000317_20211008T000342_040020_04BCB8_rtc"
properties
- datetime "2021-10-08T00:03:29.713275Z"
- platform "SENTINEL-1A"
s1:shape [] 2 items
- 0 27538
- 1 21082
proj:bbox [] 4 items
- 0 524430.0
- 1 2980840.0
- 2 799810.0
- 3 3191660.0
- proj:epsg 32645
proj:shape [] 2 items
- 0 21082
- 1 27538
- end_datetime "2021-10-08 00:03:42.211968+00:00"
- constellation "Sentinel-1"
- s1:resolution "high"
proj:transform [] 9 items
- 0 10.0
- 1 0.0
- 2 524430.0
- 3 0.0
- 4 -10.0
- 5 3191660.0
- 6 0.0
- 7 0.0
- 8 1.0
- s1:datatake_id "310456"
- start_datetime "2021-10-08 00:03:17.214581+00:00"
- s1:orbit_source "DOWNLINK"
- s1:slice_number "12"
- s1:total_slices "17"
- sar:looks_range 5
- sat:orbit_state "descending"
- sar:product_type "GRD"
- sar:looks_azimuth 1
sar:polarizations [] 2 items
- 0 "VV"
- 1 "VH"
- sar:frequency_band "C"
- sat:absolute_orbit 40020
- sat:relative_orbit 48
- s1:processing_level "1"
- sar:instrument_mode "IW"
- sar:center_frequency 5.405
- sar:resolution_range 20
- s1:product_timeliness "Fast-24h"
- sar:resolution_azimuth 22
- sar:pixel_spacing_range 10
- sar:observation_direction "right"
- sar:pixel_spacing_azimuth 10
- sar:looks_equivalent_number 4.4
- s1:instrument_configuration_ID "7"
- sat:platform_international_designator "2014-016A"
geometry
- type "Polygon"
coordinates [] 1 items
0 [] 19 items
0 [] 2 items
- 0 89.8049271
- 1 27.0231858
1 [] 2 items
- 0 89.7778347
- 1 26.9948068
2 [] 2 items
- 0 89.7847721
- 1 26.9227167
3 [] 2 items
- 0 87.3051814
- 1 27.3293811
4 [] 2 items
- 0 87.4260986
- 1 28.1940766
5 [] 2 items
- 0 87.5589421
- 1 28.8400227
6 [] 2 items
- 0 90.0500516
- 1 28.4415867
7 [] 2 items
- 0 90.0267419
- 1 28.29107
8 [] 2 items
- 0 89.9736509
- 1 28.1920227
9 [] 2 items
- 0 89.9981906
- 1 28.1483705
10 [] 2 items
- 0 89.9713866
- 1 28.0842789
11 [] 2 items
- 0 89.9880181
- 1 28.0016519
12 [] 2 items
- 0 89.9452983
- 1 27.9517885
13 [] 2 items
- 0 89.9297848
- 1 27.8247467
14 [] 2 items
- 0 89.952922
- 1 27.6783872
15 [] 2 items
- 0 89.9233887
- 1 27.6385999
16 [] 2 items
- 0 89.9030615
- 1 27.4282012
17 [] 2 items
- 0 89.829493
- 1 27.2746315
18 [] 2 items
- 0 89.8049271
- 1 27.0231858
links [] 7 items
0
- rel "collection"
- href "https://planetarycomputer.microsoft.com/api/stac/v1/collections/sentinel-1-rtc"
- type "application/json"
1
- rel "parent"
- href "https://planetarycomputer.microsoft.com/api/stac/v1/collections/sentinel-1-rtc"
- type "application/json"
2
- rel "root"
- href "https://planetarycomputer.microsoft.com/api/stac/v1"
- type "application/json"
- title "Microsoft Planetary Computer STAC API"
3
- rel "self"
- href "https://planetarycomputer.microsoft.com/api/stac/v1/collections/sentinel-1-rtc/items/S1A_IW_GRDH_1SDV_20211008T000317_20211008T000342_040020_04BCB8_rtc"
- type "application/geo+json"
4
- rel "license"
- href "https://sentinel.esa.int/documents/247904/690755/Sentinel_Data_Legal_Notice"
5
- rel "derived_from"
- href "https://planetarycomputer.microsoft.com/api/stac/v1/collections/sentinel-1-grd/items/S1A_IW_GRDH_1SDV_20211008T000317_20211008T000342_040020_04BCB8"
- type "application/json"
- title "Sentinel 1 GRD Item"
6
- rel "preview"
- href "https://planetarycomputer.microsoft.com/api/data/v1/item/map?collection=sentinel-1-rtc&item=S1A_IW_GRDH_1SDV_20211008T000317_20211008T000342_040020_04BCB8_rtc"
- type "text/html"
- title "Map of item"
assets
vh
- href "https://sentinel1euwestrtc.blob.core.windows.net/sentinel1-grd-rtc/GRD/2021/10/8/IW/DV/S1A_IW_GRDH_1SDV_20211008T000317_20211008T000342_040020_04BCB8_BF4D/measurement/iw-vh.rtc.tiff"
- type "image/tiff; application=geotiff; profile=cloud-optimized"
- title "VH: vertical transmit, horizontal receive"
- description "Terrain-corrected gamma naught values of signal transmitted with vertical polarization and received with horizontal polarization with radiometric terrain correction applied."
- file:size 1840973408
- file:checksum "05b8343583496e24e1a1250d3a3829e0"
raster:bands [] 1 items
0
- nodata -32768
- data_type "float32"
- spatial_resolution 10.0
roles [] 1 items
- 0 "data"
vv
- href "https://sentinel1euwestrtc.blob.core.windows.net/sentinel1-grd-rtc/GRD/2021/10/8/IW/DV/S1A_IW_GRDH_1SDV_20211008T000317_20211008T000342_040020_04BCB8_BF4D/measurement/iw-vv.rtc.tiff"
- type "image/tiff; application=geotiff; profile=cloud-optimized"
- title "VV: vertical transmit, vertical receive"
- description "Terrain-corrected gamma naught values of signal transmitted with vertical polarization and received with vertical polarization with radiometric terrain correction applied."
- file:size 1848183631
- file:checksum "2645256c3392def121b844c32c339d33"
raster:bands [] 1 items
0
- nodata -32768
- data_type "float32"
- spatial_resolution 10.0
roles [] 1 items
- 0 "data"
tilejson
- href "https://planetarycomputer.microsoft.com/api/data/v1/item/tilejson.json?collection=sentinel-1-rtc&item=S1A_IW_GRDH_1SDV_20211008T000317_20211008T000342_040020_04BCB8_rtc&assets=vv&assets=vh&tile_format=png&expression=0.03+%2B+log+%2810e-4+-+log+%280.05+%2F+%280.02+%2B+2+%2A+vv%29%29%29%3B0.05+%2B+exp+%280.25+%2A+%28log+%280.01+%2B+2+%2A+vv%29+%2B+log+%280.02+%2B+5+%2A+vh%29%29%29%3B1+-+log+%280.05+%2F+%280.045+-+0.9+%2A+vv%29%29&asset_as_band=True&rescale=0%2C.8000&rescale=0%2C1.000&rescale=0%2C1.000&format=png"
- type "application/json"
- title "TileJSON with default rendering"
roles [] 1 items
- 0 "tiles"
rendered_preview
- href "https://planetarycomputer.microsoft.com/api/data/v1/item/preview.png?collection=sentinel-1-rtc&item=S1A_IW_GRDH_1SDV_20211008T000317_20211008T000342_040020_04BCB8_rtc&assets=vv&assets=vh&tile_format=png&expression=0.03+%2B+log+%2810e-4+-+log+%280.05+%2F+%280.02+%2B+2+%2A+vv%29%29%29%3B0.05+%2B+exp+%280.25+%2A+%28log+%280.01+%2B+2+%2A+vv%29+%2B+log+%280.02+%2B+5+%2A+vh%29%29%29%3B1+-+log+%280.05+%2F+%280.045+-+0.9+%2A+vv%29%29&asset_as_band=True&rescale=0%2C.8000&rescale=0%2C1.000&rescale=0%2C1.000&format=png"
- type "image/png"
- title "Rendered preview"
- rel "preview"
roles [] 1 items
- 0 "overview"
bbox [] 4 items
- 0 87.30518145
- 1 26.92271674
- 2 90.05005156
- 3 28.84002267
stac_extensions [] 6 items
- 0 "https://stac-extensions.github.io/sar/v1.0.0/schema.json"
- 1 "https://stac-extensions.github.io/sat/v1.0.0/schema.json"
- 2 "https://stac-extensions.github.io/eo/v1.0.0/schema.json"
- 3 "https://stac-extensions.github.io/projection/v1.0.0/schema.json"
- 4 "https://stac-extensions.github.io/file/v2.0.0/schema.json"
- 5 "https://stac-extensions.github.io/raster/v1.1.0/schema.json"
- collection "sentinel-1-rtc"
73
- type "Feature"
- stac_version "1.0.0"
- id "S1A_IW_GRDH_1SDV_20211005T121358_20211005T121423_039984_04BB88_rtc"
properties
- datetime "2021-10-05T12:14:11.035095Z"
- platform "SENTINEL-1A"
s1:shape [] 2 items
- 0 28154
- 1 21599
proj:bbox [] 4 items
- 0 421860.0
- 1 2916230.0
- 2 703400.0
- 3 3132220.0
- proj:epsg 32645
proj:shape [] 2 items
- 0 21599
- 1 28154
- end_datetime "2021-10-05 12:14:23.534843+00:00"
- constellation "Sentinel-1"
- s1:resolution "high"
proj:transform [] 9 items
- 0 10.0
- 1 0.0
- 2 421860.0
- 3 0.0
- 4 -10.0
- 5 3132220.0
- 6 0.0
- 7 0.0
- 8 1.0
- s1:datatake_id "310152"
- start_datetime "2021-10-05 12:13:58.535347+00:00"
- s1:orbit_source "DOWNLINK"
- s1:slice_number "6"
- s1:total_slices "20"
- sar:looks_range 5
- sat:orbit_state "ascending"
- sar:product_type "GRD"
- sar:looks_azimuth 1
sar:polarizations [] 2 items
- 0 "VV"
- 1 "VH"
- sar:frequency_band "C"
- sat:absolute_orbit 39984
- sat:relative_orbit 12
- s1:processing_level "1"
- sar:instrument_mode "IW"
- sar:center_frequency 5.405
- sar:resolution_range 20
- s1:product_timeliness "Fast-24h"
- sar:resolution_azimuth 22
- sar:pixel_spacing_range 10
- sar:observation_direction "right"
- sar:pixel_spacing_azimuth 10
- sar:looks_equivalent_number 4.4
- s1:instrument_configuration_ID "7"
- sat:platform_international_designator "2014-016A"
geometry
- type "Polygon"
coordinates [] 1 items
0 [] 15 items
0 [] 2 items
- 0 86.2064206
- 1 27.8443213
1 [] 2 items
- 0 86.2114809
- 1 27.8818123
2 [] 2 items
- 0 88.7389699
- 1 28.2896879
3 [] 2 items
- 0 88.922949
- 1 27.3279448
4 [] 2 items
- 0 88.985173
- 1 26.7769805
5 [] 2 items
- 0 86.4997784
- 1 26.3665977
6 [] 2 items
- 0 86.3727328
- 1 27.081932
7 [] 2 items
- 0 86.3191727
- 1 27.2322702
8 [] 2 items
- 0 86.3288054
- 1 27.3771232
9 [] 2 items
- 0 86.2788871
- 1 27.4647132
10 [] 2 items
- 0 86.2716817
- 1 27.6977638
11 [] 2 items
- 0 86.2172102
- 1 27.7558724
12 [] 2 items
- 0 86.2350924
- 1 27.7816096
13 [] 2 items
- 0 86.2105142
- 1 27.7838184
14 [] 2 items
- 0 86.2064206
- 1 27.8443213
links [] 7 items
0
- rel "collection"
- href "https://planetarycomputer.microsoft.com/api/stac/v1/collections/sentinel-1-rtc"
- type "application/json"
1
- rel "parent"
- href "https://planetarycomputer.microsoft.com/api/stac/v1/collections/sentinel-1-rtc"
- type "application/json"
2
- rel "root"
- href "https://planetarycomputer.microsoft.com/api/stac/v1"
- type "application/json"
- title "Microsoft Planetary Computer STAC API"
3
- rel "self"
- href "https://planetarycomputer.microsoft.com/api/stac/v1/collections/sentinel-1-rtc/items/S1A_IW_GRDH_1SDV_20211005T121358_20211005T121423_039984_04BB88_rtc"
- type "application/geo+json"
4
- rel "license"
- href "https://sentinel.esa.int/documents/247904/690755/Sentinel_Data_Legal_Notice"
5
- rel "derived_from"
- href "https://planetarycomputer.microsoft.com/api/stac/v1/collections/sentinel-1-grd/items/S1A_IW_GRDH_1SDV_20211005T121358_20211005T121423_039984_04BB88"
- type "application/json"
- title "Sentinel 1 GRD Item"
6
- rel "preview"
- href "https://planetarycomputer.microsoft.com/api/data/v1/item/map?collection=sentinel-1-rtc&item=S1A_IW_GRDH_1SDV_20211005T121358_20211005T121423_039984_04BB88_rtc"
- type "text/html"
- title "Map of item"
assets
vh
- href "https://sentinel1euwestrtc.blob.core.windows.net/sentinel1-grd-rtc/GRD/2021/10/5/IW/DV/S1A_IW_GRDH_1SDV_20211005T121358_20211005T121423_039984_04BB88_68F7/measurement/iw-vh.rtc.tiff"
- type "image/tiff; application=geotiff; profile=cloud-optimized"
- title "VH: vertical transmit, horizontal receive"
- description "Terrain-corrected gamma naught values of signal transmitted with vertical polarization and received with horizontal polarization with radiometric terrain correction applied."
- file:size 1866629861
- file:checksum "683df5f1cfc87127dea2205a0a17ccb4"
raster:bands [] 1 items
0
- nodata -32768
- data_type "float32"
- spatial_resolution 10.0
roles [] 1 items
- 0 "data"
vv
- href "https://sentinel1euwestrtc.blob.core.windows.net/sentinel1-grd-rtc/GRD/2021/10/5/IW/DV/S1A_IW_GRDH_1SDV_20211005T121358_20211005T121423_039984_04BB88_68F7/measurement/iw-vv.rtc.tiff"
- type "image/tiff; application=geotiff; profile=cloud-optimized"
- title "VV: vertical transmit, vertical receive"
- description "Terrain-corrected gamma naught values of signal transmitted with vertical polarization and received with vertical polarization with radiometric terrain correction applied."
- file:size 1875041877
- file:checksum "9880529abf204173922820443cfecbde"
raster:bands [] 1 items
0
- nodata -32768
- data_type "float32"
- spatial_resolution 10.0
roles [] 1 items
- 0 "data"
tilejson
- href "https://planetarycomputer.microsoft.com/api/data/v1/item/tilejson.json?collection=sentinel-1-rtc&item=S1A_IW_GRDH_1SDV_20211005T121358_20211005T121423_039984_04BB88_rtc&assets=vv&assets=vh&tile_format=png&expression=0.03+%2B+log+%2810e-4+-+log+%280.05+%2F+%280.02+%2B+2+%2A+vv%29%29%29%3B0.05+%2B+exp+%280.25+%2A+%28log+%280.01+%2B+2+%2A+vv%29+%2B+log+%280.02+%2B+5+%2A+vh%29%29%29%3B1+-+log+%280.05+%2F+%280.045+-+0.9+%2A+vv%29%29&asset_as_band=True&rescale=0%2C.8000&rescale=0%2C1.000&rescale=0%2C1.000&format=png"
- type "application/json"
- title "TileJSON with default rendering"
roles [] 1 items
- 0 "tiles"
rendered_preview
- href "https://planetarycomputer.microsoft.com/api/data/v1/item/preview.png?collection=sentinel-1-rtc&item=S1A_IW_GRDH_1SDV_20211005T121358_20211005T121423_039984_04BB88_rtc&assets=vv&assets=vh&tile_format=png&expression=0.03+%2B+log+%2810e-4+-+log+%280.05+%2F+%280.02+%2B+2+%2A+vv%29%29%29%3B0.05+%2B+exp+%280.25+%2A+%28log+%280.01+%2B+2+%2A+vv%29+%2B+log+%280.02+%2B+5+%2A+vh%29%29%29%3B1+-+log+%280.05+%2F+%280.045+-+0.9+%2A+vv%29%29&asset_as_band=True&rescale=0%2C.8000&rescale=0%2C1.000&rescale=0%2C1.000&format=png"
- type "image/png"
- title "Rendered preview"
- rel "preview"
roles [] 1 items
- 0 "overview"
bbox [] 4 items
- 0 86.20642056
- 1 26.3665977
- 2 88.98517304
- 3 28.28968788
stac_extensions [] 6 items
- 0 "https://stac-extensions.github.io/sar/v1.0.0/schema.json"
- 1 "https://stac-extensions.github.io/sat/v1.0.0/schema.json"
- 2 "https://stac-extensions.github.io/eo/v1.0.0/schema.json"
- 3 "https://stac-extensions.github.io/projection/v1.0.0/schema.json"
- 4 "https://stac-extensions.github.io/file/v2.0.0/schema.json"
- 5 "https://stac-extensions.github.io/raster/v1.1.0/schema.json"
- collection "sentinel-1-rtc"
74
- type "Feature"
- stac_version "1.0.0"
- id "S1A_IW_GRDH_1SDV_20210930T120551_20210930T120616_039911_04B8FF_rtc"
properties
- datetime "2021-09-30T12:06:03.760613Z"
- platform "SENTINEL-1A"
s1:shape [] 2 items
- 0 28428
- 1 21971
proj:bbox [] 4 items
- 0 618130.0
- 1 2960460.0
- 2 902410.0
- 3 3180170.0
- proj:epsg 32645
proj:shape [] 2 items
- 0 21971
- 1 28428
- end_datetime "2021-09-30 12:06:16.259641+00:00"
- constellation "Sentinel-1"
- s1:resolution "high"
proj:transform [] 9 items
- 0 10.0
- 1 0.0
- 2 618130.0
- 3 0.0
- 4 -10.0
- 5 3180170.0
- 6 0.0
- 7 0.0
- 8 1.0
- s1:datatake_id "309503"
- start_datetime "2021-09-30 12:05:51.261585+00:00"
- s1:orbit_source "DOWNLINK"
- s1:slice_number "6"
- s1:total_slices "21"
- sar:looks_range 5
- sat:orbit_state "ascending"
- sar:product_type "GRD"
- sar:looks_azimuth 1
sar:polarizations [] 2 items
- 0 "VV"
- 1 "VH"
- sar:frequency_band "C"
- sat:absolute_orbit 39911
- sat:relative_orbit 114
- s1:processing_level "1"
- sar:instrument_mode "IW"
- sar:center_frequency 5.405
- sar:resolution_range 20
- s1:product_timeliness "Fast-24h"
- sar:resolution_azimuth 22
- sar:pixel_spacing_range 10
- sar:observation_direction "right"
- sar:pixel_spacing_azimuth 10
- sar:looks_equivalent_number 4.4
- s1:instrument_configuration_ID "7"
- sat:platform_international_designator "2014-016A"
geometry
- type "Polygon"
coordinates [] 1 items
0 [] 14 items
0 [] 2 items
- 0 89.981645
- 1 27.0127856
1 [] 2 items
- 0 90.9929388
- 1 27.1730371
2 [] 2 items
- 0 90.7241431
- 1 28.6820254
3 [] 2 items
- 0 88.2169712
- 1 28.2799493
4 [] 2 items
- 0 88.3541569
- 1 27.7231154
5 [] 2 items
- 0 88.3293488
- 1 27.5841696
6 [] 2 items
- 0 88.3758798
- 1 27.5217953
7 [] 2 items
- 0 88.3573873
- 1 27.4090551
8 [] 2 items
- 0 88.3997631
- 1 27.336514
9 [] 2 items
- 0 88.3788296
- 1 27.3029625
10 [] 2 items
- 0 88.4158056
- 1 27.2067299
11 [] 2 items
- 0 88.4037367
- 1 27.0893222
12 [] 2 items
- 0 88.4747309
- 1 26.7597898
13 [] 2 items
- 0 89.981645
- 1 27.0127856
links [] 7 items
0
- rel "collection"
- href "https://planetarycomputer.microsoft.com/api/stac/v1/collections/sentinel-1-rtc"
- type "application/json"
1
- rel "parent"
- href "https://planetarycomputer.microsoft.com/api/stac/v1/collections/sentinel-1-rtc"
- type "application/json"
2
- rel "root"
- href "https://planetarycomputer.microsoft.com/api/stac/v1"
- type "application/json"
- title "Microsoft Planetary Computer STAC API"
3
- rel "self"
- href "https://planetarycomputer.microsoft.com/api/stac/v1/collections/sentinel-1-rtc/items/S1A_IW_GRDH_1SDV_20210930T120551_20210930T120616_039911_04B8FF_rtc"
- type "application/geo+json"
4
- rel "license"
- href "https://sentinel.esa.int/documents/247904/690755/Sentinel_Data_Legal_Notice"
5
- rel "derived_from"
- href "https://planetarycomputer.microsoft.com/api/stac/v1/collections/sentinel-1-grd/items/S1A_IW_GRDH_1SDV_20210930T120551_20210930T120616_039911_04B8FF"
- type "application/json"
- title "Sentinel 1 GRD Item"
6
- rel "preview"
- href "https://planetarycomputer.microsoft.com/api/data/v1/item/map?collection=sentinel-1-rtc&item=S1A_IW_GRDH_1SDV_20210930T120551_20210930T120616_039911_04B8FF_rtc"
- type "text/html"
- title "Map of item"
assets
vh
- href "https://sentinel1euwestrtc.blob.core.windows.net/sentinel1-grd-rtc/GRD/2021/9/30/IW/DV/S1A_IW_GRDH_1SDV_20210930T120551_20210930T120616_039911_04B8FF_9B25/measurement/iw-vh.rtc.tiff"
- type "image/tiff; application=geotiff; profile=cloud-optimized"
- title "VH: vertical transmit, horizontal receive"
- description "Terrain-corrected gamma naught values of signal transmitted with vertical polarization and received with horizontal polarization with radiometric terrain correction applied."
- file:size 1850859837
- file:checksum "5ef89982114f5e020a97ae3f979d403e"
raster:bands [] 1 items
0
- nodata -32768
- data_type "float32"
- spatial_resolution 10.0
roles [] 1 items
- 0 "data"
vv
- href "https://sentinel1euwestrtc.blob.core.windows.net/sentinel1-grd-rtc/GRD/2021/9/30/IW/DV/S1A_IW_GRDH_1SDV_20210930T120551_20210930T120616_039911_04B8FF_9B25/measurement/iw-vv.rtc.tiff"
- type "image/tiff; application=geotiff; profile=cloud-optimized"
- title "VV: vertical transmit, vertical receive"
- description "Terrain-corrected gamma naught values of signal transmitted with vertical polarization and received with vertical polarization with radiometric terrain correction applied."
- file:size 1858802212
- file:checksum "1d08f38ab7c2a0098507531d17e1f27f"
raster:bands [] 1 items
0
- nodata -32768
- data_type "float32"
- spatial_resolution 10.0
roles [] 1 items
- 0 "data"
tilejson
- href "https://planetarycomputer.microsoft.com/api/data/v1/item/tilejson.json?collection=sentinel-1-rtc&item=S1A_IW_GRDH_1SDV_20210930T120551_20210930T120616_039911_04B8FF_rtc&assets=vv&assets=vh&tile_format=png&expression=0.03+%2B+log+%2810e-4+-+log+%280.05+%2F+%280.02+%2B+2+%2A+vv%29%29%29%3B0.05+%2B+exp+%280.25+%2A+%28log+%280.01+%2B+2+%2A+vv%29+%2B+log+%280.02+%2B+5+%2A+vh%29%29%29%3B1+-+log+%280.05+%2F+%280.045+-+0.9+%2A+vv%29%29&asset_as_band=True&rescale=0%2C.8000&rescale=0%2C1.000&rescale=0%2C1.000&format=png"
- type "application/json"
- title "TileJSON with default rendering"
roles [] 1 items
- 0 "tiles"
rendered_preview
- href "https://planetarycomputer.microsoft.com/api/data/v1/item/preview.png?collection=sentinel-1-rtc&item=S1A_IW_GRDH_1SDV_20210930T120551_20210930T120616_039911_04B8FF_rtc&assets=vv&assets=vh&tile_format=png&expression=0.03+%2B+log+%2810e-4+-+log+%280.05+%2F+%280.02+%2B+2+%2A+vv%29%29%29%3B0.05+%2B+exp+%280.25+%2A+%28log+%280.01+%2B+2+%2A+vv%29+%2B+log+%280.02+%2B+5+%2A+vh%29%29%29%3B1+-+log+%280.05+%2F+%280.045+-+0.9+%2A+vv%29%29&asset_as_band=True&rescale=0%2C.8000&rescale=0%2C1.000&rescale=0%2C1.000&format=png"
- type "image/png"
- title "Rendered preview"
- rel "preview"
roles [] 1 items
- 0 "overview"
bbox [] 4 items
- 0 88.2169712
- 1 26.75978977
- 2 90.99293881
- 3 28.68202543
stac_extensions [] 6 items
- 0 "https://stac-extensions.github.io/sar/v1.0.0/schema.json"
- 1 "https://stac-extensions.github.io/sat/v1.0.0/schema.json"
- 2 "https://stac-extensions.github.io/eo/v1.0.0/schema.json"
- 3 "https://stac-extensions.github.io/projection/v1.0.0/schema.json"
- 4 "https://stac-extensions.github.io/file/v2.0.0/schema.json"
- 5 "https://stac-extensions.github.io/raster/v1.1.0/schema.json"
- collection "sentinel-1-rtc"
75
- type "Feature"
- stac_version "1.0.0"
- id "S1A_IW_GRDH_1SDV_20210926T000317_20210926T000342_039845_04B6AB_rtc"
properties
- datetime "2021-09-26T00:03:29.558327Z"
- platform "SENTINEL-1A"
s1:shape [] 2 items
- 0 27538
- 1 21083
proj:bbox [] 4 items
- 0 524430.0
- 1 2980830.0
- 2 799810.0
- 3 3191660.0
- proj:epsg 32645
proj:shape [] 2 items
- 0 21083
- 1 27538
- end_datetime "2021-09-26 00:03:42.057026+00:00"
- constellation "Sentinel-1"
- s1:resolution "high"
proj:transform [] 9 items
- 0 10.0
- 1 0.0
- 2 524430.0
- 3 0.0
- 4 -10.0
- 5 3191660.0
- 6 0.0
- 7 0.0
- 8 1.0
- s1:datatake_id "308907"
- start_datetime "2021-09-26 00:03:17.059628+00:00"
- s1:orbit_source "DOWNLINK"
- s1:slice_number "12"
- s1:total_slices "17"
- sar:looks_range 5
- sat:orbit_state "descending"
- sar:product_type "GRD"
- sar:looks_azimuth 1
sar:polarizations [] 2 items
- 0 "VV"
- 1 "VH"
- sar:frequency_band "C"
- sat:absolute_orbit 39845
- sat:relative_orbit 48
- s1:processing_level "1"
- sar:instrument_mode "IW"
- sar:center_frequency 5.405
- sar:resolution_range 20
- s1:product_timeliness "Fast-24h"
- sar:resolution_azimuth 22
- sar:pixel_spacing_range 10
- sar:observation_direction "right"
- sar:pixel_spacing_azimuth 10
- sar:looks_equivalent_number 4.4
- s1:instrument_configuration_ID "7"
- sat:platform_international_designator "2014-016A"
geometry
- type "Polygon"
coordinates [] 1 items
0 [] 19 items
0 [] 2 items
- 0 89.8046161
- 1 27.0228311
1 [] 2 items
- 0 89.7776334
- 1 26.9948108
2 [] 2 items
- 0 89.7849711
- 1 26.9226226
3 [] 2 items
- 0 87.304979
- 1 27.3292913
4 [] 2 items
- 0 87.4259963
- 1 28.1939866
5 [] 2 items
- 0 87.5587371
- 1 28.8400235
6 [] 2 items
- 0 90.050049
- 1 28.4414965
7 [] 2 items
- 0 90.0266401
- 1 28.2910722
8 [] 2 items
- 0 89.9735466
- 1 28.1919348
9 [] 2 items
- 0 89.998178
- 1 28.1479197
10 [] 2 items
- 0 89.9713866
- 1 28.0842789
11 [] 2 items
- 0 89.9879165
- 1 28.0016541
12 [] 2 items
- 0 89.9451919
- 1 27.9516104
13 [] 2 items
- 0 89.9296834
- 1 27.8247488
14 [] 2 items
- 0 89.9528207
- 1 27.6783894
15 [] 2 items
- 0 89.9232851
- 1 27.6385119
16 [] 2 items
- 0 89.903647
- 1 27.4312562
17 [] 2 items
- 0 89.8294976
- 1 27.2748119
18 [] 2 items
- 0 89.8046161
- 1 27.0228311
links [] 7 items
0
- rel "collection"
- href "https://planetarycomputer.microsoft.com/api/stac/v1/collections/sentinel-1-rtc"
- type "application/json"
1
- rel "parent"
- href "https://planetarycomputer.microsoft.com/api/stac/v1/collections/sentinel-1-rtc"
- type "application/json"
2
- rel "root"
- href "https://planetarycomputer.microsoft.com/api/stac/v1"
- type "application/json"
- title "Microsoft Planetary Computer STAC API"
3
- rel "self"
- href "https://planetarycomputer.microsoft.com/api/stac/v1/collections/sentinel-1-rtc/items/S1A_IW_GRDH_1SDV_20210926T000317_20210926T000342_039845_04B6AB_rtc"
- type "application/geo+json"
4
- rel "license"
- href "https://sentinel.esa.int/documents/247904/690755/Sentinel_Data_Legal_Notice"
5
- rel "derived_from"
- href "https://planetarycomputer.microsoft.com/api/stac/v1/collections/sentinel-1-grd/items/S1A_IW_GRDH_1SDV_20210926T000317_20210926T000342_039845_04B6AB"
- type "application/json"
- title "Sentinel 1 GRD Item"
6
- rel "preview"
- href "https://planetarycomputer.microsoft.com/api/data/v1/item/map?collection=sentinel-1-rtc&item=S1A_IW_GRDH_1SDV_20210926T000317_20210926T000342_039845_04B6AB_rtc"
- type "text/html"
- title "Map of item"
assets
vh
- href "https://sentinel1euwestrtc.blob.core.windows.net/sentinel1-grd-rtc/GRD/2021/9/26/IW/DV/S1A_IW_GRDH_1SDV_20210926T000317_20210926T000342_039845_04B6AB_D1E5/measurement/iw-vh.rtc.tiff"
- type "image/tiff; application=geotiff; profile=cloud-optimized"
- title "VH: vertical transmit, horizontal receive"
- description "Terrain-corrected gamma naught values of signal transmitted with vertical polarization and received with horizontal polarization with radiometric terrain correction applied."
- file:size 1840122585
- file:checksum "20c32f3e6164b24ec6e85dd33872c453"
raster:bands [] 1 items
0
- nodata -32768
- data_type "float32"
- spatial_resolution 10.0
roles [] 1 items
- 0 "data"
vv
- href "https://sentinel1euwestrtc.blob.core.windows.net/sentinel1-grd-rtc/GRD/2021/9/26/IW/DV/S1A_IW_GRDH_1SDV_20210926T000317_20210926T000342_039845_04B6AB_D1E5/measurement/iw-vv.rtc.tiff"
- type "image/tiff; application=geotiff; profile=cloud-optimized"
- title "VV: vertical transmit, vertical receive"
- description "Terrain-corrected gamma naught values of signal transmitted with vertical polarization and received with vertical polarization with radiometric terrain correction applied."
- file:size 1846552525
- file:checksum "05ae60af47c99603dfd1dc7c85769fc6"
raster:bands [] 1 items
0
- nodata -32768
- data_type "float32"
- spatial_resolution 10.0
roles [] 1 items
- 0 "data"
tilejson
- href "https://planetarycomputer.microsoft.com/api/data/v1/item/tilejson.json?collection=sentinel-1-rtc&item=S1A_IW_GRDH_1SDV_20210926T000317_20210926T000342_039845_04B6AB_rtc&assets=vv&assets=vh&tile_format=png&expression=0.03+%2B+log+%2810e-4+-+log+%280.05+%2F+%280.02+%2B+2+%2A+vv%29%29%29%3B0.05+%2B+exp+%280.25+%2A+%28log+%280.01+%2B+2+%2A+vv%29+%2B+log+%280.02+%2B+5+%2A+vh%29%29%29%3B1+-+log+%280.05+%2F+%280.045+-+0.9+%2A+vv%29%29&asset_as_band=True&rescale=0%2C.8000&rescale=0%2C1.000&rescale=0%2C1.000&format=png"
- type "application/json"
- title "TileJSON with default rendering"
roles [] 1 items
- 0 "tiles"
rendered_preview
- href "https://planetarycomputer.microsoft.com/api/data/v1/item/preview.png?collection=sentinel-1-rtc&item=S1A_IW_GRDH_1SDV_20210926T000317_20210926T000342_039845_04B6AB_rtc&assets=vv&assets=vh&tile_format=png&expression=0.03+%2B+log+%2810e-4+-+log+%280.05+%2F+%280.02+%2B+2+%2A+vv%29%29%29%3B0.05+%2B+exp+%280.25+%2A+%28log+%280.01+%2B+2+%2A+vv%29+%2B+log+%280.02+%2B+5+%2A+vh%29%29%29%3B1+-+log+%280.05+%2F+%280.045+-+0.9+%2A+vv%29%29&asset_as_band=True&rescale=0%2C.8000&rescale=0%2C1.000&rescale=0%2C1.000&format=png"
- type "image/png"
- title "Rendered preview"
- rel "preview"
roles [] 1 items
- 0 "overview"
bbox [] 4 items
- 0 87.30497903
- 1 26.92262259
- 2 90.05004897
- 3 28.84002352
stac_extensions [] 6 items
- 0 "https://stac-extensions.github.io/sar/v1.0.0/schema.json"
- 1 "https://stac-extensions.github.io/sat/v1.0.0/schema.json"
- 2 "https://stac-extensions.github.io/eo/v1.0.0/schema.json"
- 3 "https://stac-extensions.github.io/projection/v1.0.0/schema.json"
- 4 "https://stac-extensions.github.io/file/v2.0.0/schema.json"
- 5 "https://stac-extensions.github.io/raster/v1.1.0/schema.json"
- collection "sentinel-1-rtc"
76
- type "Feature"
- stac_version "1.0.0"
- id "S1A_IW_GRDH_1SDV_20210923T121358_20210923T121423_039809_04B566_rtc"
properties
- datetime "2021-09-23T12:14:10.788780Z"
- platform "SENTINEL-1A"
s1:shape [] 2 items
- 0 28154
- 1 21598
proj:bbox [] 4 items
- 0 421870.0
- 1 2916240.0
- 2 703410.0
- 3 3132220.0
- proj:epsg 32645
proj:shape [] 2 items
- 0 21598
- 1 28154
- end_datetime "2021-09-23 12:14:23.287715+00:00"
- constellation "Sentinel-1"
- s1:resolution "high"
proj:transform [] 9 items
- 0 10.0
- 1 0.0
- 2 421870.0
- 3 0.0
- 4 -10.0
- 5 3132220.0
- 6 0.0
- 7 0.0
- 8 1.0
- s1:datatake_id "308582"
- start_datetime "2021-09-23 12:13:58.289844+00:00"
- s1:orbit_source "DOWNLINK"
- s1:slice_number "6"
- s1:total_slices "20"
- sar:looks_range 5
- sat:orbit_state "ascending"
- sar:product_type "GRD"
- sar:looks_azimuth 1
sar:polarizations [] 2 items
- 0 "VV"
- 1 "VH"
- sar:frequency_band "C"
- sat:absolute_orbit 39809
- sat:relative_orbit 12
- s1:processing_level "1"
- sar:instrument_mode "IW"
- sar:center_frequency 5.405
- sar:resolution_range 20
- s1:product_timeliness "Fast-24h"
- sar:resolution_azimuth 22
- sar:pixel_spacing_range 10
- sar:observation_direction "right"
- sar:pixel_spacing_azimuth 10
- sar:looks_equivalent_number 4.4
- s1:instrument_configuration_ID "7"
- sat:platform_international_designator "2014-016A"
geometry
- type "Polygon"
coordinates [] 1 items
0 [] 15 items
0 [] 2 items
- 0 86.2065215
- 1 27.8444121
1 [] 2 items
- 0 86.2111768
- 1 27.8817203
2 [] 2 items
- 0 88.7391737
- 1 28.2896853
3 [] 2 items
- 0 88.923047
- 1 27.3277629
4 [] 2 items
- 0 88.9853757
- 1 26.7770679
5 [] 2 items
- 0 86.5000783
- 1 26.3667793
6 [] 2 items
- 0 86.3731362
- 1 27.0819338
7 [] 2 items
- 0 86.3194757
- 1 27.2322716
8 [] 2 items
- 0 86.3290071
- 1 27.3772145
9 [] 2 items
- 0 86.2791918
- 1 27.4645342
10 [] 2 items
- 0 86.2721894
- 1 27.6976762
11 [] 2 items
- 0 86.2174118
- 1 27.7560541
12 [] 2 items
- 0 86.2352954
- 1 27.7816107
13 [] 2 items
- 0 86.2107146
- 1 27.7841806
14 [] 2 items
- 0 86.2065215
- 1 27.8444121
links [] 7 items
0
- rel "collection"
- href "https://planetarycomputer.microsoft.com/api/stac/v1/collections/sentinel-1-rtc"
- type "application/json"
1
- rel "parent"
- href "https://planetarycomputer.microsoft.com/api/stac/v1/collections/sentinel-1-rtc"
- type "application/json"
2
- rel "root"
- href "https://planetarycomputer.microsoft.com/api/stac/v1"
- type "application/json"
- title "Microsoft Planetary Computer STAC API"
3
- rel "self"
- href "https://planetarycomputer.microsoft.com/api/stac/v1/collections/sentinel-1-rtc/items/S1A_IW_GRDH_1SDV_20210923T121358_20210923T121423_039809_04B566_rtc"
- type "application/geo+json"
4
- rel "license"
- href "https://sentinel.esa.int/documents/247904/690755/Sentinel_Data_Legal_Notice"
5
- rel "derived_from"
- href "https://planetarycomputer.microsoft.com/api/stac/v1/collections/sentinel-1-grd/items/S1A_IW_GRDH_1SDV_20210923T121358_20210923T121423_039809_04B566"
- type "application/json"
- title "Sentinel 1 GRD Item"
6
- rel "preview"
- href "https://planetarycomputer.microsoft.com/api/data/v1/item/map?collection=sentinel-1-rtc&item=S1A_IW_GRDH_1SDV_20210923T121358_20210923T121423_039809_04B566_rtc"
- type "text/html"
- title "Map of item"
assets
vh
- href "https://sentinel1euwestrtc.blob.core.windows.net/sentinel1-grd-rtc/GRD/2021/9/23/IW/DV/S1A_IW_GRDH_1SDV_20210923T121358_20210923T121423_039809_04B566_0737/measurement/iw-vh.rtc.tiff"
- type "image/tiff; application=geotiff; profile=cloud-optimized"
- title "VH: vertical transmit, horizontal receive"
- description "Terrain-corrected gamma naught values of signal transmitted with vertical polarization and received with horizontal polarization with radiometric terrain correction applied."
- file:size 1868141721
- file:checksum "dcdb56f3dfdf4ed20ac8a4b81ed48c0c"
raster:bands [] 1 items
0
- nodata -32768
- data_type "float32"
- spatial_resolution 10.0
roles [] 1 items
- 0 "data"
vv
- href "https://sentinel1euwestrtc.blob.core.windows.net/sentinel1-grd-rtc/GRD/2021/9/23/IW/DV/S1A_IW_GRDH_1SDV_20210923T121358_20210923T121423_039809_04B566_0737/measurement/iw-vv.rtc.tiff"
- type "image/tiff; application=geotiff; profile=cloud-optimized"
- title "VV: vertical transmit, vertical receive"
- description "Terrain-corrected gamma naught values of signal transmitted with vertical polarization and received with vertical polarization with radiometric terrain correction applied."
- file:size 1876188972
- file:checksum "32ea74f78053ba8d27e7531292f4bc45"
raster:bands [] 1 items
0
- nodata -32768
- data_type "float32"
- spatial_resolution 10.0
roles [] 1 items
- 0 "data"
tilejson
- href "https://planetarycomputer.microsoft.com/api/data/v1/item/tilejson.json?collection=sentinel-1-rtc&item=S1A_IW_GRDH_1SDV_20210923T121358_20210923T121423_039809_04B566_rtc&assets=vv&assets=vh&tile_format=png&expression=0.03+%2B+log+%2810e-4+-+log+%280.05+%2F+%280.02+%2B+2+%2A+vv%29%29%29%3B0.05+%2B+exp+%280.25+%2A+%28log+%280.01+%2B+2+%2A+vv%29+%2B+log+%280.02+%2B+5+%2A+vh%29%29%29%3B1+-+log+%280.05+%2F+%280.045+-+0.9+%2A+vv%29%29&asset_as_band=True&rescale=0%2C.8000&rescale=0%2C1.000&rescale=0%2C1.000&format=png"
- type "application/json"
- title "TileJSON with default rendering"
roles [] 1 items
- 0 "tiles"
rendered_preview
- href "https://planetarycomputer.microsoft.com/api/data/v1/item/preview.png?collection=sentinel-1-rtc&item=S1A_IW_GRDH_1SDV_20210923T121358_20210923T121423_039809_04B566_rtc&assets=vv&assets=vh&tile_format=png&expression=0.03+%2B+log+%2810e-4+-+log+%280.05+%2F+%280.02+%2B+2+%2A+vv%29%29%29%3B0.05+%2B+exp+%280.25+%2A+%28log+%280.01+%2B+2+%2A+vv%29+%2B+log+%280.02+%2B+5+%2A+vh%29%29%29%3B1+-+log+%280.05+%2F+%280.045+-+0.9+%2A+vv%29%29&asset_as_band=True&rescale=0%2C.8000&rescale=0%2C1.000&rescale=0%2C1.000&format=png"
- type "image/png"
- title "Rendered preview"
- rel "preview"
roles [] 1 items
- 0 "overview"
bbox [] 4 items
- 0 86.20652146
- 1 26.36677934
- 2 88.98537567
- 3 28.28968528
stac_extensions [] 6 items
- 0 "https://stac-extensions.github.io/sar/v1.0.0/schema.json"
- 1 "https://stac-extensions.github.io/sat/v1.0.0/schema.json"
- 2 "https://stac-extensions.github.io/eo/v1.0.0/schema.json"
- 3 "https://stac-extensions.github.io/projection/v1.0.0/schema.json"
- 4 "https://stac-extensions.github.io/file/v2.0.0/schema.json"
- 5 "https://stac-extensions.github.io/raster/v1.1.0/schema.json"
- collection "sentinel-1-rtc"
77
- type "Feature"
- stac_version "1.0.0"
- id "S1A_IW_GRDH_1SDV_20210918T120550_20210918T120615_039736_04B2FB_rtc"
properties
- datetime "2021-09-18T12:06:03.415938Z"
- platform "SENTINEL-1A"
s1:shape [] 2 items
- 0 28424
- 1 21971
proj:bbox [] 4 items
- 0 618240.0
- 1 2960460.0
- 2 902480.0
- 3 3180170.0
- proj:epsg 32645
proj:shape [] 2 items
- 0 21971
- 1 28424
- end_datetime "2021-09-18 12:06:15.915669+00:00"
- constellation "Sentinel-1"
- s1:resolution "high"
proj:transform [] 9 items
- 0 10.0
- 1 0.0
- 2 618240.0
- 3 0.0
- 4 -10.0
- 5 3180170.0
- 6 0.0
- 7 0.0
- 8 1.0
- s1:datatake_id "307963"
- start_datetime "2021-09-18 12:05:50.916208+00:00"
- s1:orbit_source "DOWNLINK"
- s1:slice_number "6"
- s1:total_slices "21"
- sar:looks_range 5
- sat:orbit_state "ascending"
- sar:product_type "GRD"
- sar:looks_azimuth 1
sar:polarizations [] 2 items
- 0 "VV"
- 1 "VH"
- sar:frequency_band "C"
- sat:absolute_orbit 39736
- sat:relative_orbit 114
- s1:processing_level "1"
- sar:instrument_mode "IW"
- sar:center_frequency 5.405
- sar:resolution_range 20
- s1:product_timeliness "Fast-24h"
- sar:resolution_azimuth 22
- sar:pixel_spacing_range 10
- sar:observation_direction "right"
- sar:pixel_spacing_azimuth 10
- sar:looks_equivalent_number 4.4
- s1:instrument_configuration_ID "7"
- sat:platform_international_designator "2014-016A"
geometry
- type "Polygon"
coordinates [] 1 items
0 [] 14 items
0 [] 2 items
- 0 89.9804251
- 1 27.0123604
1 [] 2 items
- 0 90.9938451
- 1 27.1730113
2 [] 2 items
- 0 90.7250655
- 1 28.6820902
3 [] 2 items
- 0 88.2181956
- 1 28.2800287
4 [] 2 items
- 0 88.3561865
- 1 27.7231858
5 [] 2 items
- 0 88.3304641
- 1 27.5842491
6 [] 2 items
- 0 88.3771025
- 1 27.522415
7 [] 2 items
- 0 88.3589031
- 1 27.4089501
8 [] 2 items
- 0 88.4010803
- 1 27.3367716
9 [] 2 items
- 0 88.3796289
- 1 27.3022325
10 [] 2 items
- 0 88.4165076
- 1 27.2063617
11 [] 2 items
- 0 88.4049479
- 1 27.0894004
12 [] 2 items
- 0 88.4758368
- 1 26.7597783
13 [] 2 items
- 0 89.9804251
- 1 27.0123604
links [] 7 items
0
- rel "collection"
- href "https://planetarycomputer.microsoft.com/api/stac/v1/collections/sentinel-1-rtc"
- type "application/json"
1
- rel "parent"
- href "https://planetarycomputer.microsoft.com/api/stac/v1/collections/sentinel-1-rtc"
- type "application/json"
2
- rel "root"
- href "https://planetarycomputer.microsoft.com/api/stac/v1"
- type "application/json"
- title "Microsoft Planetary Computer STAC API"
3
- rel "self"
- href "https://planetarycomputer.microsoft.com/api/stac/v1/collections/sentinel-1-rtc/items/S1A_IW_GRDH_1SDV_20210918T120550_20210918T120615_039736_04B2FB_rtc"
- type "application/geo+json"
4
- rel "license"
- href "https://sentinel.esa.int/documents/247904/690755/Sentinel_Data_Legal_Notice"
5
- rel "derived_from"
- href "https://planetarycomputer.microsoft.com/api/stac/v1/collections/sentinel-1-grd/items/S1A_IW_GRDH_1SDV_20210918T120550_20210918T120615_039736_04B2FB"
- type "application/json"
- title "Sentinel 1 GRD Item"
6
- rel "preview"
- href "https://planetarycomputer.microsoft.com/api/data/v1/item/map?collection=sentinel-1-rtc&item=S1A_IW_GRDH_1SDV_20210918T120550_20210918T120615_039736_04B2FB_rtc"
- type "text/html"
- title "Map of item"
assets
vh
- href "https://sentinel1euwestrtc.blob.core.windows.net/sentinel1-grd-rtc/GRD/2021/9/18/IW/DV/S1A_IW_GRDH_1SDV_20210918T120550_20210918T120615_039736_04B2FB_90AF/measurement/iw-vh.rtc.tiff"
- type "image/tiff; application=geotiff; profile=cloud-optimized"
- title "VH: vertical transmit, horizontal receive"
- description "Terrain-corrected gamma naught values of signal transmitted with vertical polarization and received with horizontal polarization with radiometric terrain correction applied."
- file:size 1850795544
- file:checksum "d03f2b032eb5765c2cd22e89bdfe0535"
raster:bands [] 1 items
0
- nodata -32768
- data_type "float32"
- spatial_resolution 10.0
roles [] 1 items
- 0 "data"
vv
- href "https://sentinel1euwestrtc.blob.core.windows.net/sentinel1-grd-rtc/GRD/2021/9/18/IW/DV/S1A_IW_GRDH_1SDV_20210918T120550_20210918T120615_039736_04B2FB_90AF/measurement/iw-vv.rtc.tiff"
- type "image/tiff; application=geotiff; profile=cloud-optimized"
- title "VV: vertical transmit, vertical receive"
- description "Terrain-corrected gamma naught values of signal transmitted with vertical polarization and received with vertical polarization with radiometric terrain correction applied."
- file:size 1858497973
- file:checksum "7dbdb7991523f0162808585a0d7443d4"
raster:bands [] 1 items
0
- nodata -32768
- data_type "float32"
- spatial_resolution 10.0
roles [] 1 items
- 0 "data"
tilejson
- href "https://planetarycomputer.microsoft.com/api/data/v1/item/tilejson.json?collection=sentinel-1-rtc&item=S1A_IW_GRDH_1SDV_20210918T120550_20210918T120615_039736_04B2FB_rtc&assets=vv&assets=vh&tile_format=png&expression=0.03+%2B+log+%2810e-4+-+log+%280.05+%2F+%280.02+%2B+2+%2A+vv%29%29%29%3B0.05+%2B+exp+%280.25+%2A+%28log+%280.01+%2B+2+%2A+vv%29+%2B+log+%280.02+%2B+5+%2A+vh%29%29%29%3B1+-+log+%280.05+%2F+%280.045+-+0.9+%2A+vv%29%29&asset_as_band=True&rescale=0%2C.8000&rescale=0%2C1.000&rescale=0%2C1.000&format=png"
- type "application/json"
- title "TileJSON with default rendering"
roles [] 1 items
- 0 "tiles"
rendered_preview
- href "https://planetarycomputer.microsoft.com/api/data/v1/item/preview.png?collection=sentinel-1-rtc&item=S1A_IW_GRDH_1SDV_20210918T120550_20210918T120615_039736_04B2FB_rtc&assets=vv&assets=vh&tile_format=png&expression=0.03+%2B+log+%2810e-4+-+log+%280.05+%2F+%280.02+%2B+2+%2A+vv%29%29%29%3B0.05+%2B+exp+%280.25+%2A+%28log+%280.01+%2B+2+%2A+vv%29+%2B+log+%280.02+%2B+5+%2A+vh%29%29%29%3B1+-+log+%280.05+%2F+%280.045+-+0.9+%2A+vv%29%29&asset_as_band=True&rescale=0%2C.8000&rescale=0%2C1.000&rescale=0%2C1.000&format=png"
- type "image/png"
- title "Rendered preview"
- rel "preview"
roles [] 1 items
- 0 "overview"
bbox [] 4 items
- 0 88.2181956
- 1 26.75977826
- 2 90.99384511
- 3 28.68209017
stac_extensions [] 6 items
- 0 "https://stac-extensions.github.io/sar/v1.0.0/schema.json"
- 1 "https://stac-extensions.github.io/sat/v1.0.0/schema.json"
- 2 "https://stac-extensions.github.io/eo/v1.0.0/schema.json"
- 3 "https://stac-extensions.github.io/projection/v1.0.0/schema.json"
- 4 "https://stac-extensions.github.io/file/v2.0.0/schema.json"
- 5 "https://stac-extensions.github.io/raster/v1.1.0/schema.json"
- collection "sentinel-1-rtc"
78
- type "Feature"
- stac_version "1.0.0"
- id "S1A_IW_GRDH_1SDV_20210914T000316_20210914T000341_039670_04B0C4_rtc"
properties
- datetime "2021-09-14T00:03:29.135941Z"
- platform "SENTINEL-1A"
s1:shape [] 2 items
- 0 27536
- 1 21083
proj:bbox [] 4 items
- 0 524460.0
- 1 2980830.0
- 2 799820.0
- 3 3191660.0
- proj:epsg 32645
proj:shape [] 2 items
- 0 21083
- 1 27536
- end_datetime "2021-09-14 00:03:41.635342+00:00"
- constellation "Sentinel-1"
- s1:resolution "high"
proj:transform [] 9 items
- 0 10.0
- 1 0.0
- 2 524460.0
- 3 0.0
- 4 -10.0
- 5 3191660.0
- 6 0.0
- 7 0.0
- 8 1.0
- s1:datatake_id "307396"
- start_datetime "2021-09-14 00:03:16.636540+00:00"
- s1:orbit_source "DOWNLINK"
- s1:slice_number "12"
- s1:total_slices "17"
- sar:looks_range 5
- sat:orbit_state "descending"
- sar:product_type "GRD"
- sar:looks_azimuth 1
sar:polarizations [] 2 items
- 0 "VV"
- 1 "VH"
- sar:frequency_band "C"
- sat:absolute_orbit 39670
- sat:relative_orbit 48
- s1:processing_level "1"
- sar:instrument_mode "IW"
- sar:center_frequency 5.405
- sar:resolution_range 20
- s1:product_timeliness "Fast-24h"
- sar:resolution_azimuth 22
- sar:pixel_spacing_range 10
- sar:observation_direction "right"
- sar:pixel_spacing_azimuth 10
- sar:looks_equivalent_number 4.4
- s1:instrument_configuration_ID "7"
- sat:platform_international_designator "2014-016A"
geometry
- type "Polygon"
coordinates [] 1 items
0 [] 19 items
0 [] 2 items
- 0 89.8050233
- 1 27.0230034
1 [] 2 items
- 0 89.777931
- 1 26.9946245
2 [] 2 items
- 0 89.7847699
- 1 26.9226266
3 [] 2 items
- 0 87.3052828
- 1 27.3294712
4 [] 2 items
- 0 87.4263041
- 1 28.1945273
5 [] 2 items
- 0 87.5592496
- 1 28.8400214
6 [] 2 items
- 0 90.0501535
- 1 28.4415844
7 [] 2 items
- 0 90.0268438
- 1 28.2910677
8 [] 2 items
- 0 89.9737551
- 1 28.1921106
9 [] 2 items
- 0 89.9982898
- 1 28.1482781
10 [] 2 items
- 0 89.9714883
- 1 28.0842767
11 [] 2 items
- 0 89.9881171
- 1 28.0015596
12 [] 2 items
- 0 89.9454023
- 1 27.9518765
13 [] 2 items
- 0 89.9297848
- 1 27.8247467
14 [] 2 items
- 0 89.9530257
- 1 27.6784752
15 [] 2 items
- 0 89.9233863
- 1 27.6385097
16 [] 2 items
- 0 89.9031626
- 1 27.4281991
17 [] 2 items
- 0 89.8295962
- 1 27.2747196
18 [] 2 items
- 0 89.8050233
- 1 27.0230034
links [] 7 items
0
- rel "collection"
- href "https://planetarycomputer.microsoft.com/api/stac/v1/collections/sentinel-1-rtc"
- type "application/json"
1
- rel "parent"
- href "https://planetarycomputer.microsoft.com/api/stac/v1/collections/sentinel-1-rtc"
- type "application/json"
2
- rel "root"
- href "https://planetarycomputer.microsoft.com/api/stac/v1"
- type "application/json"
- title "Microsoft Planetary Computer STAC API"
3
- rel "self"
- href "https://planetarycomputer.microsoft.com/api/stac/v1/collections/sentinel-1-rtc/items/S1A_IW_GRDH_1SDV_20210914T000316_20210914T000341_039670_04B0C4_rtc"
- type "application/geo+json"
4
- rel "license"
- href "https://sentinel.esa.int/documents/247904/690755/Sentinel_Data_Legal_Notice"
5
- rel "derived_from"
- href "https://planetarycomputer.microsoft.com/api/stac/v1/collections/sentinel-1-grd/items/S1A_IW_GRDH_1SDV_20210914T000316_20210914T000341_039670_04B0C4"
- type "application/json"
- title "Sentinel 1 GRD Item"
6
- rel "preview"
- href "https://planetarycomputer.microsoft.com/api/data/v1/item/map?collection=sentinel-1-rtc&item=S1A_IW_GRDH_1SDV_20210914T000316_20210914T000341_039670_04B0C4_rtc"
- type "text/html"
- title "Map of item"
assets
vh
- href "https://sentinel1euwestrtc.blob.core.windows.net/sentinel1-grd-rtc/GRD/2021/9/14/IW/DV/S1A_IW_GRDH_1SDV_20210914T000316_20210914T000341_039670_04B0C4_54A3/measurement/iw-vh.rtc.tiff"
- type "image/tiff; application=geotiff; profile=cloud-optimized"
- title "VH: vertical transmit, horizontal receive"
- description "Terrain-corrected gamma naught values of signal transmitted with vertical polarization and received with horizontal polarization with radiometric terrain correction applied."
- file:size 1840281264
- file:checksum "3f605f2b2088cc01280bcd6f7608e662"
raster:bands [] 1 items
0
- nodata -32768
- data_type "float32"
- spatial_resolution 10.0
roles [] 1 items
- 0 "data"
vv
- href "https://sentinel1euwestrtc.blob.core.windows.net/sentinel1-grd-rtc/GRD/2021/9/14/IW/DV/S1A_IW_GRDH_1SDV_20210914T000316_20210914T000341_039670_04B0C4_54A3/measurement/iw-vv.rtc.tiff"
- type "image/tiff; application=geotiff; profile=cloud-optimized"
- title "VV: vertical transmit, vertical receive"
- description "Terrain-corrected gamma naught values of signal transmitted with vertical polarization and received with vertical polarization with radiometric terrain correction applied."
- file:size 1846760166
- file:checksum "102d51eede34dc6072f7f1afad8110ab"
raster:bands [] 1 items
0
- nodata -32768
- data_type "float32"
- spatial_resolution 10.0
roles [] 1 items
- 0 "data"
tilejson
- href "https://planetarycomputer.microsoft.com/api/data/v1/item/tilejson.json?collection=sentinel-1-rtc&item=S1A_IW_GRDH_1SDV_20210914T000316_20210914T000341_039670_04B0C4_rtc&assets=vv&assets=vh&tile_format=png&expression=0.03+%2B+log+%2810e-4+-+log+%280.05+%2F+%280.02+%2B+2+%2A+vv%29%29%29%3B0.05+%2B+exp+%280.25+%2A+%28log+%280.01+%2B+2+%2A+vv%29+%2B+log+%280.02+%2B+5+%2A+vh%29%29%29%3B1+-+log+%280.05+%2F+%280.045+-+0.9+%2A+vv%29%29&asset_as_band=True&rescale=0%2C.8000&rescale=0%2C1.000&rescale=0%2C1.000&format=png"
- type "application/json"
- title "TileJSON with default rendering"
roles [] 1 items
- 0 "tiles"
rendered_preview
- href "https://planetarycomputer.microsoft.com/api/data/v1/item/preview.png?collection=sentinel-1-rtc&item=S1A_IW_GRDH_1SDV_20210914T000316_20210914T000341_039670_04B0C4_rtc&assets=vv&assets=vh&tile_format=png&expression=0.03+%2B+log+%2810e-4+-+log+%280.05+%2F+%280.02+%2B+2+%2A+vv%29%29%29%3B0.05+%2B+exp+%280.25+%2A+%28log+%280.01+%2B+2+%2A+vv%29+%2B+log+%280.02+%2B+5+%2A+vh%29%29%29%3B1+-+log+%280.05+%2F+%280.045+-+0.9+%2A+vv%29%29&asset_as_band=True&rescale=0%2C.8000&rescale=0%2C1.000&rescale=0%2C1.000&format=png"
- type "image/png"
- title "Rendered preview"
- rel "preview"
roles [] 1 items
- 0 "overview"
bbox [] 4 items
- 0 87.30528278
- 1 26.92262656
- 2 90.05015354
- 3 28.84002139
stac_extensions [] 6 items
- 0 "https://stac-extensions.github.io/sar/v1.0.0/schema.json"
- 1 "https://stac-extensions.github.io/sat/v1.0.0/schema.json"
- 2 "https://stac-extensions.github.io/eo/v1.0.0/schema.json"
- 3 "https://stac-extensions.github.io/projection/v1.0.0/schema.json"
- 4 "https://stac-extensions.github.io/file/v2.0.0/schema.json"
- 5 "https://stac-extensions.github.io/raster/v1.1.0/schema.json"
- collection "sentinel-1-rtc"
79
- type "Feature"
- stac_version "1.0.0"
- id "S1A_IW_GRDH_1SDV_20210911T121357_20210911T121422_039634_04AF85_rtc"
properties
- datetime "2021-09-11T12:14:10.406593Z"
- platform "SENTINEL-1A"
s1:shape [] 2 items
- 0 28150
- 1 21598
proj:bbox [] 4 items
- 0 421840.0
- 1 2916240.0
- 2 703340.0
- 3 3132220.0
- proj:epsg 32645
proj:shape [] 2 items
- 0 21598
- 1 28150
- end_datetime "2021-09-11 12:14:22.905498+00:00"
- constellation "Sentinel-1"
- s1:resolution "high"
proj:transform [] 9 items
- 0 10.0
- 1 0.0
- 2 421840.0
- 3 0.0
- 4 -10.0
- 5 3132220.0
- 6 0.0
- 7 0.0
- 8 1.0
- s1:datatake_id "307077"
- start_datetime "2021-09-11 12:13:57.907688+00:00"
- s1:orbit_source "DOWNLINK"
- s1:slice_number "6"
- s1:total_slices "20"
- sar:looks_range 5
- sat:orbit_state "ascending"
- sar:product_type "GRD"
- sar:looks_azimuth 1
sar:polarizations [] 2 items
- 0 "VV"
- 1 "VH"
- sar:frequency_band "C"
- sat:absolute_orbit 39634
- sat:relative_orbit 12
- s1:processing_level "1"
- sar:instrument_mode "IW"
- sar:center_frequency 5.405
- sar:resolution_range 20
- s1:product_timeliness "Fast-24h"
- sar:resolution_azimuth 22
- sar:pixel_spacing_range 10
- sar:observation_direction "right"
- sar:pixel_spacing_azimuth 10
- sar:looks_equivalent_number 4.4
- s1:instrument_configuration_ID "7"
- sat:platform_international_designator "2014-016A"
geometry
- type "Polygon"
coordinates [] 1 items
0 [] 15 items
0 [] 2 items
- 0 86.2062181
- 1 27.8442299
1 [] 2 items
- 0 86.2112777
- 1 27.8818112
2 [] 2 items
- 0 88.7382549
- 1 28.2896067
3 [] 2 items
- 0 88.9225418
- 1 27.3277699
4 [] 2 items
- 0 88.9847725
- 1 26.7770764
5 [] 2 items
- 0 86.4994773
- 1 26.3666869
6 [] 2 items
- 0 86.3723294
- 1 27.0819302
7 [] 2 items
- 0 86.3189724
- 1 27.2319983
8 [] 2 items
- 0 86.328502
- 1 27.3771218
9 [] 2 items
- 0 86.278078
- 1 27.4646187
10 [] 2 items
- 0 86.2713781
- 1 27.6976719
11 [] 2 items
- 0 86.2169051
- 1 27.7559609
12 [] 2 items
- 0 86.2349934
- 1 27.7812479
13 [] 2 items
- 0 86.2103138
- 1 27.7834561
14 [] 2 items
- 0 86.2062181
- 1 27.8442299
links [] 7 items
0
- rel "collection"
- href "https://planetarycomputer.microsoft.com/api/stac/v1/collections/sentinel-1-rtc"
- type "application/json"
1
- rel "parent"
- href "https://planetarycomputer.microsoft.com/api/stac/v1/collections/sentinel-1-rtc"
- type "application/json"
2
- rel "root"
- href "https://planetarycomputer.microsoft.com/api/stac/v1"
- type "application/json"
- title "Microsoft Planetary Computer STAC API"
3
- rel "self"
- href "https://planetarycomputer.microsoft.com/api/stac/v1/collections/sentinel-1-rtc/items/S1A_IW_GRDH_1SDV_20210911T121357_20210911T121422_039634_04AF85_rtc"
- type "application/geo+json"
4
- rel "license"
- href "https://sentinel.esa.int/documents/247904/690755/Sentinel_Data_Legal_Notice"
5
- rel "derived_from"
- href "https://planetarycomputer.microsoft.com/api/stac/v1/collections/sentinel-1-grd/items/S1A_IW_GRDH_1SDV_20210911T121357_20210911T121422_039634_04AF85"
- type "application/json"
- title "Sentinel 1 GRD Item"
6
- rel "preview"
- href "https://planetarycomputer.microsoft.com/api/data/v1/item/map?collection=sentinel-1-rtc&item=S1A_IW_GRDH_1SDV_20210911T121357_20210911T121422_039634_04AF85_rtc"
- type "text/html"
- title "Map of item"
assets
vh
- href "https://sentinel1euwestrtc.blob.core.windows.net/sentinel1-grd-rtc/GRD/2021/9/11/IW/DV/S1A_IW_GRDH_1SDV_20210911T121357_20210911T121422_039634_04AF85_E8A4/measurement/iw-vh.rtc.tiff"
- type "image/tiff; application=geotiff; profile=cloud-optimized"
- title "VH: vertical transmit, horizontal receive"
- description "Terrain-corrected gamma naught values of signal transmitted with vertical polarization and received with horizontal polarization with radiometric terrain correction applied."
- file:size 1867417713
- file:checksum "93c2dbd8ce9a329ddd09ef806cb87578"
raster:bands [] 1 items
0
- nodata -32768
- data_type "float32"
- spatial_resolution 10.0
roles [] 1 items
- 0 "data"
vv
- href "https://sentinel1euwestrtc.blob.core.windows.net/sentinel1-grd-rtc/GRD/2021/9/11/IW/DV/S1A_IW_GRDH_1SDV_20210911T121357_20210911T121422_039634_04AF85_E8A4/measurement/iw-vv.rtc.tiff"
- type "image/tiff; application=geotiff; profile=cloud-optimized"
- title "VV: vertical transmit, vertical receive"
- description "Terrain-corrected gamma naught values of signal transmitted with vertical polarization and received with vertical polarization with radiometric terrain correction applied."
- file:size 1875673198
- file:checksum "1b9b355e0f1e8fce595bee4eb53c80a3"
raster:bands [] 1 items
0
- nodata -32768
- data_type "float32"
- spatial_resolution 10.0
roles [] 1 items
- 0 "data"
tilejson
- href "https://planetarycomputer.microsoft.com/api/data/v1/item/tilejson.json?collection=sentinel-1-rtc&item=S1A_IW_GRDH_1SDV_20210911T121357_20210911T121422_039634_04AF85_rtc&assets=vv&assets=vh&tile_format=png&expression=0.03+%2B+log+%2810e-4+-+log+%280.05+%2F+%280.02+%2B+2+%2A+vv%29%29%29%3B0.05+%2B+exp+%280.25+%2A+%28log+%280.01+%2B+2+%2A+vv%29+%2B+log+%280.02+%2B+5+%2A+vh%29%29%29%3B1+-+log+%280.05+%2F+%280.045+-+0.9+%2A+vv%29%29&asset_as_band=True&rescale=0%2C.8000&rescale=0%2C1.000&rescale=0%2C1.000&format=png"
- type "application/json"
- title "TileJSON with default rendering"
roles [] 1 items
- 0 "tiles"
rendered_preview
- href "https://planetarycomputer.microsoft.com/api/data/v1/item/preview.png?collection=sentinel-1-rtc&item=S1A_IW_GRDH_1SDV_20210911T121357_20210911T121422_039634_04AF85_rtc&assets=vv&assets=vh&tile_format=png&expression=0.03+%2B+log+%2810e-4+-+log+%280.05+%2F+%280.02+%2B+2+%2A+vv%29%29%29%3B0.05+%2B+exp+%280.25+%2A+%28log+%280.01+%2B+2+%2A+vv%29+%2B+log+%280.02+%2B+5+%2A+vh%29%29%29%3B1+-+log+%280.05+%2F+%280.045+-+0.9+%2A+vv%29%29&asset_as_band=True&rescale=0%2C.8000&rescale=0%2C1.000&rescale=0%2C1.000&format=png"
- type "image/png"
- title "Rendered preview"
- rel "preview"
roles [] 1 items
- 0 "overview"
bbox [] 4 items
- 0 86.20621812
- 1 26.36668694
- 2 88.98477247
- 3 28.28960674
stac_extensions [] 6 items
- 0 "https://stac-extensions.github.io/sar/v1.0.0/schema.json"
- 1 "https://stac-extensions.github.io/sat/v1.0.0/schema.json"
- 2 "https://stac-extensions.github.io/eo/v1.0.0/schema.json"
- 3 "https://stac-extensions.github.io/projection/v1.0.0/schema.json"
- 4 "https://stac-extensions.github.io/file/v2.0.0/schema.json"
- 5 "https://stac-extensions.github.io/raster/v1.1.0/schema.json"
- collection "sentinel-1-rtc"
80
- type "Feature"
- stac_version "1.0.0"
- id "S1A_IW_GRDH_1SDV_20210906T120550_20210906T120615_039561_04AD0D_rtc"
properties
- datetime "2021-09-06T12:06:02.971474Z"
- platform "SENTINEL-1A"
s1:shape [] 2 items
- 0 28425
- 1 21970
proj:bbox [] 4 items
- 0 618220.0
- 1 2960450.0
- 2 902470.0
- 3 3180150.0
- proj:epsg 32645
proj:shape [] 2 items
- 0 21970
- 1 28425
- end_datetime "2021-09-06 12:06:15.470505+00:00"
- constellation "Sentinel-1"
- s1:resolution "high"
proj:transform [] 9 items
- 0 10.0
- 1 0.0
- 2 618220.0
- 3 0.0
- 4 -10.0
- 5 3180150.0
- 6 0.0
- 7 0.0
- 8 1.0
- s1:datatake_id "306445"
- start_datetime "2021-09-06 12:05:50.472443+00:00"
- s1:orbit_source "DOWNLINK"
- s1:slice_number "6"
- s1:total_slices "21"
- sar:looks_range 5
- sat:orbit_state "ascending"
- sar:product_type "GRD"
- sar:looks_azimuth 1
sar:polarizations [] 2 items
- 0 "VV"
- 1 "VH"
- sar:frequency_band "C"
- sat:absolute_orbit 39561
- sat:relative_orbit 114
- s1:processing_level "1"
- sar:instrument_mode "IW"
- sar:center_frequency 5.405
- sar:resolution_range 20
- s1:product_timeliness "Fast-24h"
- sar:resolution_azimuth 22
- sar:pixel_spacing_range 10
- sar:observation_direction "right"
- sar:pixel_spacing_azimuth 10
- sar:looks_equivalent_number 4.4
- s1:instrument_configuration_ID "7"
- sat:platform_international_designator "2014-016A"
geometry
- type "Polygon"
coordinates [] 1 items
0 [] 14 items
0 [] 2 items
- 0 89.9820429
- 1 27.0125968
1 [] 2 items
- 0 90.9937412
- 1 27.1729241
2 [] 2 items
- 0 90.7250591
- 1 28.68191
3 [] 2 items
- 0 88.2179897
- 1 28.27985
4 [] 2 items
- 0 88.3557808
- 1 27.7231898
5 [] 2 items
- 0 88.3301635
- 1 27.5845228
6 [] 2 items
- 0 88.3768966
- 1 27.5221463
7 [] 2 items
- 0 88.3585986
- 1 27.4088628
8 [] 2 items
- 0 88.4007783
- 1 27.3368649
9 [] 2 items
- 0 88.379529
- 1 27.3023238
10 [] 2 items
- 0 88.416308
- 1 27.2065443
11 [] 2 items
- 0 88.4046465
- 1 27.0894936
12 [] 2 items
- 0 88.4756346
- 1 26.7596901
13 [] 2 items
- 0 89.9820429
- 1 27.0125968
links [] 7 items
0
- rel "collection"
- href "https://planetarycomputer.microsoft.com/api/stac/v1/collections/sentinel-1-rtc"
- type "application/json"
1
- rel "parent"
- href "https://planetarycomputer.microsoft.com/api/stac/v1/collections/sentinel-1-rtc"
- type "application/json"
2
- rel "root"
- href "https://planetarycomputer.microsoft.com/api/stac/v1"
- type "application/json"
- title "Microsoft Planetary Computer STAC API"
3
- rel "self"
- href "https://planetarycomputer.microsoft.com/api/stac/v1/collections/sentinel-1-rtc/items/S1A_IW_GRDH_1SDV_20210906T120550_20210906T120615_039561_04AD0D_rtc"
- type "application/geo+json"
4
- rel "license"
- href "https://sentinel.esa.int/documents/247904/690755/Sentinel_Data_Legal_Notice"
5
- rel "derived_from"
- href "https://planetarycomputer.microsoft.com/api/stac/v1/collections/sentinel-1-grd/items/S1A_IW_GRDH_1SDV_20210906T120550_20210906T120615_039561_04AD0D"
- type "application/json"
- title "Sentinel 1 GRD Item"
6
- rel "preview"
- href "https://planetarycomputer.microsoft.com/api/data/v1/item/map?collection=sentinel-1-rtc&item=S1A_IW_GRDH_1SDV_20210906T120550_20210906T120615_039561_04AD0D_rtc"
- type "text/html"
- title "Map of item"
assets
vh
- href "https://sentinel1euwestrtc.blob.core.windows.net/sentinel1-grd-rtc/GRD/2021/9/6/IW/DV/S1A_IW_GRDH_1SDV_20210906T120550_20210906T120615_039561_04AD0D_190C/measurement/iw-vh.rtc.tiff"
- type "image/tiff; application=geotiff; profile=cloud-optimized"
- title "VH: vertical transmit, horizontal receive"
- description "Terrain-corrected gamma naught values of signal transmitted with vertical polarization and received with horizontal polarization with radiometric terrain correction applied."
- file:size 1849342737
- file:checksum "37bf9b7c3cef4c3467706f9a30741651"
raster:bands [] 1 items
0
- nodata -32768
- data_type "float32"
- spatial_resolution 10.0
roles [] 1 items
- 0 "data"
vv
- href "https://sentinel1euwestrtc.blob.core.windows.net/sentinel1-grd-rtc/GRD/2021/9/6/IW/DV/S1A_IW_GRDH_1SDV_20210906T120550_20210906T120615_039561_04AD0D_190C/measurement/iw-vv.rtc.tiff"
- type "image/tiff; application=geotiff; profile=cloud-optimized"
- title "VV: vertical transmit, vertical receive"
- description "Terrain-corrected gamma naught values of signal transmitted with vertical polarization and received with vertical polarization with radiometric terrain correction applied."
- file:size 1858394123
- file:checksum "0ea6b1ab787a1d8f8ebc84946d626ae6"
raster:bands [] 1 items
0
- nodata -32768
- data_type "float32"
- spatial_resolution 10.0
roles [] 1 items
- 0 "data"
tilejson
- href "https://planetarycomputer.microsoft.com/api/data/v1/item/tilejson.json?collection=sentinel-1-rtc&item=S1A_IW_GRDH_1SDV_20210906T120550_20210906T120615_039561_04AD0D_rtc&assets=vv&assets=vh&tile_format=png&expression=0.03+%2B+log+%2810e-4+-+log+%280.05+%2F+%280.02+%2B+2+%2A+vv%29%29%29%3B0.05+%2B+exp+%280.25+%2A+%28log+%280.01+%2B+2+%2A+vv%29+%2B+log+%280.02+%2B+5+%2A+vh%29%29%29%3B1+-+log+%280.05+%2F+%280.045+-+0.9+%2A+vv%29%29&asset_as_band=True&rescale=0%2C.8000&rescale=0%2C1.000&rescale=0%2C1.000&format=png"
- type "application/json"
- title "TileJSON with default rendering"
roles [] 1 items
- 0 "tiles"
rendered_preview
- href "https://planetarycomputer.microsoft.com/api/data/v1/item/preview.png?collection=sentinel-1-rtc&item=S1A_IW_GRDH_1SDV_20210906T120550_20210906T120615_039561_04AD0D_rtc&assets=vv&assets=vh&tile_format=png&expression=0.03+%2B+log+%2810e-4+-+log+%280.05+%2F+%280.02+%2B+2+%2A+vv%29%29%29%3B0.05+%2B+exp+%280.25+%2A+%28log+%280.01+%2B+2+%2A+vv%29+%2B+log+%280.02+%2B+5+%2A+vh%29%29%29%3B1+-+log+%280.05+%2F+%280.045+-+0.9+%2A+vv%29%29&asset_as_band=True&rescale=0%2C.8000&rescale=0%2C1.000&rescale=0%2C1.000&format=png"
- type "image/png"
- title "Rendered preview"
- rel "preview"
roles [] 1 items
- 0 "overview"
bbox [] 4 items
- 0 88.21798965
- 1 26.75969009
- 2 90.9937412
- 3 28.68191003
stac_extensions [] 6 items
- 0 "https://stac-extensions.github.io/sar/v1.0.0/schema.json"
- 1 "https://stac-extensions.github.io/sat/v1.0.0/schema.json"
- 2 "https://stac-extensions.github.io/eo/v1.0.0/schema.json"
- 3 "https://stac-extensions.github.io/projection/v1.0.0/schema.json"
- 4 "https://stac-extensions.github.io/file/v2.0.0/schema.json"
- 5 "https://stac-extensions.github.io/raster/v1.1.0/schema.json"
- collection "sentinel-1-rtc"
81
- type "Feature"
- stac_version "1.0.0"
- id "S1A_IW_GRDH_1SDV_20210902T000315_20210902T000340_039495_04AAB3_rtc"
properties
- datetime "2021-09-02T00:03:28.464707Z"
- platform "SENTINEL-1A"
s1:shape [] 2 items
- 0 27534
- 1 21083
proj:bbox [] 4 items
- 0 524500.0
- 1 2980820.0
- 2 799840.0
- 3 3191650.0
- proj:epsg 32645
proj:shape [] 2 items
- 0 21083
- 1 27534
- end_datetime "2021-09-02 00:03:40.964057+00:00"
- constellation "Sentinel-1"
- s1:resolution "high"
proj:transform [] 9 items
- 0 10.0
- 1 0.0
- 2 524500.0
- 3 0.0
- 4 -10.0
- 5 3191650.0
- 6 0.0
- 7 0.0
- 8 1.0
- s1:datatake_id "305843"
- start_datetime "2021-09-02 00:03:15.965357+00:00"
- s1:orbit_source "DOWNLINK"
- s1:slice_number "12"
- s1:total_slices "17"
- sar:looks_range 5
- sat:orbit_state "descending"
- sar:product_type "GRD"
- sar:looks_azimuth 1
sar:polarizations [] 2 items
- 0 "VV"
- 1 "VH"
- sar:frequency_band "C"
- sat:absolute_orbit 39495
- sat:relative_orbit 48
- s1:processing_level "1"
- sar:instrument_mode "IW"
- sar:center_frequency 5.405
- sar:resolution_range 20
- s1:product_timeliness "Fast-24h"
- sar:resolution_azimuth 22
- sar:pixel_spacing_range 10
- sar:observation_direction "right"
- sar:pixel_spacing_azimuth 10
- sar:looks_equivalent_number 4.4
- s1:instrument_configuration_ID "7"
- sat:platform_international_designator "2014-016A"
geometry
- type "Polygon"
coordinates [] 1 items
0 [] 16 items
0 [] 2 items
- 0 89.8055156
- 1 27.0225425
1 [] 2 items
- 0 89.7784277
- 1 26.994344
2 [] 2 items
- 0 89.7853713
- 1 26.9225245
3 [] 2 items
- 0 87.3057912
- 1 27.3305534
4 [] 2 items
- 0 87.4266101
- 1 28.1946166
5 [] 2 items
- 0 87.5592496
- 1 28.8400214
6 [] 2 items
- 0 90.0503575
- 1 28.4415798
7 [] 2 items
- 0 89.9861775
- 1 28.1885025
8 [] 2 items
- 0 89.9884069
- 1 28.001012
9 [] 2 items
- 0 89.9456054
- 1 27.9518721
10 [] 2 items
- 0 89.9320214
- 1 27.8513105
11 [] 2 items
- 0 89.953221
- 1 27.6782004
12 [] 2 items
- 0 89.9235912
- 1 27.6385956
13 [] 2 items
- 0 89.9036749
- 1 27.428459
14 [] 2 items
- 0 89.8298967
- 1 27.2746233
15 [] 2 items
- 0 89.8055156
- 1 27.0225425
links [] 7 items
0
- rel "collection"
- href "https://planetarycomputer.microsoft.com/api/stac/v1/collections/sentinel-1-rtc"
- type "application/json"
1
- rel "parent"
- href "https://planetarycomputer.microsoft.com/api/stac/v1/collections/sentinel-1-rtc"
- type "application/json"
2
- rel "root"
- href "https://planetarycomputer.microsoft.com/api/stac/v1"
- type "application/json"
- title "Microsoft Planetary Computer STAC API"
3
- rel "self"
- href "https://planetarycomputer.microsoft.com/api/stac/v1/collections/sentinel-1-rtc/items/S1A_IW_GRDH_1SDV_20210902T000315_20210902T000340_039495_04AAB3_rtc"
- type "application/geo+json"
4
- rel "license"
- href "https://sentinel.esa.int/documents/247904/690755/Sentinel_Data_Legal_Notice"
5
- rel "derived_from"
- href "https://planetarycomputer.microsoft.com/api/stac/v1/collections/sentinel-1-grd/items/S1A_IW_GRDH_1SDV_20210902T000315_20210902T000340_039495_04AAB3"
- type "application/json"
- title "Sentinel 1 GRD Item"
6
- rel "preview"
- href "https://planetarycomputer.microsoft.com/api/data/v1/item/map?collection=sentinel-1-rtc&item=S1A_IW_GRDH_1SDV_20210902T000315_20210902T000340_039495_04AAB3_rtc"
- type "text/html"
- title "Map of item"
assets
vh
- href "https://sentinel1euwestrtc.blob.core.windows.net/sentinel1-grd-rtc/GRD/2021/9/2/IW/DV/S1A_IW_GRDH_1SDV_20210902T000315_20210902T000340_039495_04AAB3_4826/measurement/iw-vh.rtc.tiff"
- type "image/tiff; application=geotiff; profile=cloud-optimized"
- title "VH: vertical transmit, horizontal receive"
- description "Terrain-corrected gamma naught values of signal transmitted with vertical polarization and received with horizontal polarization with radiometric terrain correction applied."
- file:size 1839255425
- file:checksum "3a71e00cc20043b27f151a53a10f51d9"
raster:bands [] 1 items
0
- nodata -32768
- data_type "float32"
- spatial_resolution 10.0
roles [] 1 items
- 0 "data"
vv
- href "https://sentinel1euwestrtc.blob.core.windows.net/sentinel1-grd-rtc/GRD/2021/9/2/IW/DV/S1A_IW_GRDH_1SDV_20210902T000315_20210902T000340_039495_04AAB3_4826/measurement/iw-vv.rtc.tiff"
- type "image/tiff; application=geotiff; profile=cloud-optimized"
- title "VV: vertical transmit, vertical receive"
- description "Terrain-corrected gamma naught values of signal transmitted with vertical polarization and received with vertical polarization with radiometric terrain correction applied."
- file:size 1847221864
- file:checksum "8038fd60cd30ad2ee4e2727d530bbcef"
raster:bands [] 1 items
0
- nodata -32768
- data_type "float32"
- spatial_resolution 10.0
roles [] 1 items
- 0 "data"
tilejson
- href "https://planetarycomputer.microsoft.com/api/data/v1/item/tilejson.json?collection=sentinel-1-rtc&item=S1A_IW_GRDH_1SDV_20210902T000315_20210902T000340_039495_04AAB3_rtc&assets=vv&assets=vh&tile_format=png&expression=0.03+%2B+log+%2810e-4+-+log+%280.05+%2F+%280.02+%2B+2+%2A+vv%29%29%29%3B0.05+%2B+exp+%280.25+%2A+%28log+%280.01+%2B+2+%2A+vv%29+%2B+log+%280.02+%2B+5+%2A+vh%29%29%29%3B1+-+log+%280.05+%2F+%280.045+-+0.9+%2A+vv%29%29&asset_as_band=True&rescale=0%2C.8000&rescale=0%2C1.000&rescale=0%2C1.000&format=png"
- type "application/json"
- title "TileJSON with default rendering"
roles [] 1 items
- 0 "tiles"
rendered_preview
- href "https://planetarycomputer.microsoft.com/api/data/v1/item/preview.png?collection=sentinel-1-rtc&item=S1A_IW_GRDH_1SDV_20210902T000315_20210902T000340_039495_04AAB3_rtc&assets=vv&assets=vh&tile_format=png&expression=0.03+%2B+log+%2810e-4+-+log+%280.05+%2F+%280.02+%2B+2+%2A+vv%29%29%29%3B0.05+%2B+exp+%280.25+%2A+%28log+%280.01+%2B+2+%2A+vv%29+%2B+log+%280.02+%2B+5+%2A+vh%29%29%29%3B1+-+log+%280.05+%2F+%280.045+-+0.9+%2A+vv%29%29&asset_as_band=True&rescale=0%2C.8000&rescale=0%2C1.000&rescale=0%2C1.000&format=png"
- type "image/png"
- title "Rendered preview"
- rel "preview"
roles [] 1 items
- 0 "overview"
bbox [] 4 items
- 0 87.30579118
- 1 26.92252446
- 2 90.0503575
- 3 28.84002139
stac_extensions [] 6 items
- 0 "https://stac-extensions.github.io/sar/v1.0.0/schema.json"
- 1 "https://stac-extensions.github.io/sat/v1.0.0/schema.json"
- 2 "https://stac-extensions.github.io/eo/v1.0.0/schema.json"
- 3 "https://stac-extensions.github.io/projection/v1.0.0/schema.json"
- 4 "https://stac-extensions.github.io/file/v2.0.0/schema.json"
- 5 "https://stac-extensions.github.io/raster/v1.1.0/schema.json"
- collection "sentinel-1-rtc"
82
- type "Feature"
- stac_version "1.0.0"
- id "S1A_IW_GRDH_1SDV_20210830T121357_20210830T121422_039459_04A972_rtc"
properties
- datetime "2021-08-30T12:14:09.783019Z"
- platform "SENTINEL-1A"
s1:shape [] 2 items
- 0 28148
- 1 21599
proj:bbox [] 4 items
- 0 421800.0
- 1 2916230.0
- 2 703280.0
- 3 3132220.0
- proj:epsg 32645
proj:shape [] 2 items
- 0 21599
- 1 28148
- end_datetime "2021-08-30 12:14:22.282732+00:00"
- constellation "Sentinel-1"
- s1:resolution "high"
proj:transform [] 9 items
- 0 10.0
- 1 0.0
- 2 421800.0
- 3 0.0
- 4 -10.0
- 5 3132220.0
- 6 0.0
- 7 0.0
- 8 1.0
- s1:datatake_id "305522"
- start_datetime "2021-08-30 12:13:57.283307+00:00"
- s1:orbit_source "DOWNLINK"
- s1:slice_number "6"
- s1:total_slices "20"
- sar:looks_range 5
- sat:orbit_state "ascending"
- sar:product_type "GRD"
- sar:looks_azimuth 1
sar:polarizations [] 2 items
- 0 "VV"
- 1 "VH"
- sar:frequency_band "C"
- sat:absolute_orbit 39459
- sat:relative_orbit 12
- s1:processing_level "1"
- sar:instrument_mode "IW"
- sar:center_frequency 5.405
- sar:resolution_range 20
- s1:product_timeliness "Fast-24h"
- sar:resolution_azimuth 22
- sar:pixel_spacing_range 10
- sar:observation_direction "right"
- sar:pixel_spacing_azimuth 10
- sar:looks_equivalent_number 4.4
- s1:instrument_configuration_ID "7"
- sat:platform_international_designator "2014-016A"
geometry
- type "Polygon"
coordinates [] 1 items
0 [] 15 items
0 [] 2 items
- 0 86.2058132
- 1 27.844047
1 [] 2 items
- 0 86.2107698
- 1 27.8818083
2 [] 2 items
- 0 88.7376433
- 1 28.2896145
3 [] 2 items
- 0 88.9221346
- 1 27.327595
4 [] 2 items
- 0 88.9841677
- 1 26.7769946
5 [] 2 items
- 0 86.4987761
- 1 26.3665942
6 [] 2 items
- 0 86.3550311
- 1 27.1612089
7 [] 2 items
- 0 86.3183703
- 1 27.2313635
8 [] 2 items
- 0 86.3265774
- 1 27.3776542
9 [] 2 items
- 0 86.2772702
- 1 27.4643437
10 [] 2 items
- 0 86.2704665
- 1 27.6974866
11 [] 2 items
- 0 86.2160921
- 1 27.7561369
12 [] 2 items
- 0 86.2344853
- 1 27.7813354
13 [] 2 items
- 0 86.2098142
- 1 27.78237
14 [] 2 items
- 0 86.2058132
- 1 27.844047
links [] 7 items
0
- rel "collection"
- href "https://planetarycomputer.microsoft.com/api/stac/v1/collections/sentinel-1-rtc"
- type "application/json"
1
- rel "parent"
- href "https://planetarycomputer.microsoft.com/api/stac/v1/collections/sentinel-1-rtc"
- type "application/json"
2
- rel "root"
- href "https://planetarycomputer.microsoft.com/api/stac/v1"
- type "application/json"
- title "Microsoft Planetary Computer STAC API"
3
- rel "self"
- href "https://planetarycomputer.microsoft.com/api/stac/v1/collections/sentinel-1-rtc/items/S1A_IW_GRDH_1SDV_20210830T121357_20210830T121422_039459_04A972_rtc"
- type "application/geo+json"
4
- rel "license"
- href "https://sentinel.esa.int/documents/247904/690755/Sentinel_Data_Legal_Notice"
5
- rel "derived_from"
- href "https://planetarycomputer.microsoft.com/api/stac/v1/collections/sentinel-1-grd/items/S1A_IW_GRDH_1SDV_20210830T121357_20210830T121422_039459_04A972"
- type "application/json"
- title "Sentinel 1 GRD Item"
6
- rel "preview"
- href "https://planetarycomputer.microsoft.com/api/data/v1/item/map?collection=sentinel-1-rtc&item=S1A_IW_GRDH_1SDV_20210830T121357_20210830T121422_039459_04A972_rtc"
- type "text/html"
- title "Map of item"
assets
vh
- href "https://sentinel1euwestrtc.blob.core.windows.net/sentinel1-grd-rtc/GRD/2021/8/30/IW/DV/S1A_IW_GRDH_1SDV_20210830T121357_20210830T121422_039459_04A972_BF51/measurement/iw-vh.rtc.tiff"
- type "image/tiff; application=geotiff; profile=cloud-optimized"
- title "VH: vertical transmit, horizontal receive"
- description "Terrain-corrected gamma naught values of signal transmitted with vertical polarization and received with horizontal polarization with radiometric terrain correction applied."
- file:size 1865892369
- file:checksum "33cfdf9c6815fb4b37ed7e0080ab7dd1"
raster:bands [] 1 items
0
- nodata -32768
- data_type "float32"
- spatial_resolution 10.0
roles [] 1 items
- 0 "data"
vv
- href "https://sentinel1euwestrtc.blob.core.windows.net/sentinel1-grd-rtc/GRD/2021/8/30/IW/DV/S1A_IW_GRDH_1SDV_20210830T121357_20210830T121422_039459_04A972_BF51/measurement/iw-vv.rtc.tiff"
- type "image/tiff; application=geotiff; profile=cloud-optimized"
- title "VV: vertical transmit, vertical receive"
- description "Terrain-corrected gamma naught values of signal transmitted with vertical polarization and received with vertical polarization with radiometric terrain correction applied."
- file:size 1874919785
- file:checksum "bdb7e9ae1465c91c6d5e16312035a5d8"
raster:bands [] 1 items
0
- nodata -32768
- data_type "float32"
- spatial_resolution 10.0
roles [] 1 items
- 0 "data"
tilejson
- href "https://planetarycomputer.microsoft.com/api/data/v1/item/tilejson.json?collection=sentinel-1-rtc&item=S1A_IW_GRDH_1SDV_20210830T121357_20210830T121422_039459_04A972_rtc&assets=vv&assets=vh&tile_format=png&expression=0.03+%2B+log+%2810e-4+-+log+%280.05+%2F+%280.02+%2B+2+%2A+vv%29%29%29%3B0.05+%2B+exp+%280.25+%2A+%28log+%280.01+%2B+2+%2A+vv%29+%2B+log+%280.02+%2B+5+%2A+vh%29%29%29%3B1+-+log+%280.05+%2F+%280.045+-+0.9+%2A+vv%29%29&asset_as_band=True&rescale=0%2C.8000&rescale=0%2C1.000&rescale=0%2C1.000&format=png"
- type "application/json"
- title "TileJSON with default rendering"
roles [] 1 items
- 0 "tiles"
rendered_preview
- href "https://planetarycomputer.microsoft.com/api/data/v1/item/preview.png?collection=sentinel-1-rtc&item=S1A_IW_GRDH_1SDV_20210830T121357_20210830T121422_039459_04A972_rtc&assets=vv&assets=vh&tile_format=png&expression=0.03+%2B+log+%2810e-4+-+log+%280.05+%2F+%280.02+%2B+2+%2A+vv%29%29%29%3B0.05+%2B+exp+%280.25+%2A+%28log+%280.01+%2B+2+%2A+vv%29+%2B+log+%280.02+%2B+5+%2A+vh%29%29%29%3B1+-+log+%280.05+%2F+%280.045+-+0.9+%2A+vv%29%29&asset_as_band=True&rescale=0%2C.8000&rescale=0%2C1.000&rescale=0%2C1.000&format=png"
- type "image/png"
- title "Rendered preview"
- rel "preview"
roles [] 1 items
- 0 "overview"
bbox [] 4 items
- 0 86.20581323
- 1 26.3665942
- 2 88.98416771
- 3 28.28961452
stac_extensions [] 6 items
- 0 "https://stac-extensions.github.io/sar/v1.0.0/schema.json"
- 1 "https://stac-extensions.github.io/sat/v1.0.0/schema.json"
- 2 "https://stac-extensions.github.io/eo/v1.0.0/schema.json"
- 3 "https://stac-extensions.github.io/projection/v1.0.0/schema.json"
- 4 "https://stac-extensions.github.io/file/v2.0.0/schema.json"
- 5 "https://stac-extensions.github.io/raster/v1.1.0/schema.json"
- collection "sentinel-1-rtc"
83
- type "Feature"
- stac_version "1.0.0"
- id "S1A_IW_GRDH_1SDV_20210825T120549_20210825T120614_039386_04A6FC_rtc"
properties
- datetime "2021-08-25T12:06:02.421490Z"
- platform "SENTINEL-1A"
s1:shape [] 2 items
- 0 28424
- 1 21971
proj:bbox [] 4 items
- 0 618220.0
- 1 2960450.0
- 2 902460.0
- 3 3180160.0
- proj:epsg 32645
proj:shape [] 2 items
- 0 21971
- 1 28424
- end_datetime "2021-08-25 12:06:14.921233+00:00"
- constellation "Sentinel-1"
- s1:resolution "high"
proj:transform [] 9 items
- 0 10.0
- 1 0.0
- 2 618220.0
- 3 0.0
- 4 -10.0
- 5 3180160.0
- 6 0.0
- 7 0.0
- 8 1.0
- s1:datatake_id "304892"
- start_datetime "2021-08-25 12:05:49.921748+00:00"
- s1:orbit_source "DOWNLINK"
- s1:slice_number "6"
- s1:total_slices "21"
- sar:looks_range 5
- sat:orbit_state "ascending"
- sar:product_type "GRD"
- sar:looks_azimuth 1
sar:polarizations [] 2 items
- 0 "VV"
- 1 "VH"
- sar:frequency_band "C"
- sat:absolute_orbit 39386
- sat:relative_orbit 114
- s1:processing_level "1"
- sar:instrument_mode "IW"
- sar:center_frequency 5.405
- sar:resolution_range 20
- s1:product_timeliness "Fast-24h"
- sar:resolution_azimuth 22
- sar:pixel_spacing_range 10
- sar:observation_direction "right"
- sar:pixel_spacing_azimuth 10
- sar:looks_equivalent_number 4.4
- s1:instrument_configuration_ID "7"
- sat:platform_international_designator "2014-016A"
geometry
- type "Polygon"
coordinates [] 1 items
0 [] 14 items
0 [] 2 items
- 0 89.9799194
- 1 27.0122809
1 [] 2 items
- 0 90.9937412
- 1 27.1729241
2 [] 2 items
- 0 90.7249602
- 1 28.6820029
3 [] 2 items
- 0 88.2178898
- 1 28.2800314
4 [] 2 items
- 0 88.3556794
- 1 27.7231908
5 [] 2 items
- 0 88.3301635
- 1 27.5845228
6 [] 2 items
- 0 88.3767976
- 1 27.5223278
7 [] 2 items
- 0 88.3585986
- 1 27.4088628
8 [] 2 items
- 0 88.4007783
- 1 27.3368649
9 [] 2 items
- 0 88.3795279
- 1 27.3022335
10 [] 2 items
- 0 88.4163069
- 1 27.206454
11 [] 2 items
- 0 88.4046465
- 1 27.0894936
12 [] 2 items
- 0 88.4756346
- 1 26.7596901
13 [] 2 items
- 0 89.9799194
- 1 27.0122809
links [] 7 items
0
- rel "collection"
- href "https://planetarycomputer.microsoft.com/api/stac/v1/collections/sentinel-1-rtc"
- type "application/json"
1
- rel "parent"
- href "https://planetarycomputer.microsoft.com/api/stac/v1/collections/sentinel-1-rtc"
- type "application/json"
2
- rel "root"
- href "https://planetarycomputer.microsoft.com/api/stac/v1"
- type "application/json"
- title "Microsoft Planetary Computer STAC API"
3
- rel "self"
- href "https://planetarycomputer.microsoft.com/api/stac/v1/collections/sentinel-1-rtc/items/S1A_IW_GRDH_1SDV_20210825T120549_20210825T120614_039386_04A6FC_rtc"
- type "application/geo+json"
4
- rel "license"
- href "https://sentinel.esa.int/documents/247904/690755/Sentinel_Data_Legal_Notice"
5
- rel "derived_from"
- href "https://planetarycomputer.microsoft.com/api/stac/v1/collections/sentinel-1-grd/items/S1A_IW_GRDH_1SDV_20210825T120549_20210825T120614_039386_04A6FC"
- type "application/json"
- title "Sentinel 1 GRD Item"
6
- rel "preview"
- href "https://planetarycomputer.microsoft.com/api/data/v1/item/map?collection=sentinel-1-rtc&item=S1A_IW_GRDH_1SDV_20210825T120549_20210825T120614_039386_04A6FC_rtc"
- type "text/html"
- title "Map of item"
assets
vh
- href "https://sentinel1euwestrtc.blob.core.windows.net/sentinel1-grd-rtc/GRD/2021/8/25/IW/DV/S1A_IW_GRDH_1SDV_20210825T120549_20210825T120614_039386_04A6FC_7A0B/measurement/iw-vh.rtc.tiff"
- type "image/tiff; application=geotiff; profile=cloud-optimized"
- title "VH: vertical transmit, horizontal receive"
- description "Terrain-corrected gamma naught values of signal transmitted with vertical polarization and received with horizontal polarization with radiometric terrain correction applied."
- file:size 1849855320
- file:checksum "952cf5763d5438f40d1eceb53579e42b"
raster:bands [] 1 items
0
- nodata -32768
- data_type "float32"
- spatial_resolution 10.0
roles [] 1 items
- 0 "data"
vv
- href "https://sentinel1euwestrtc.blob.core.windows.net/sentinel1-grd-rtc/GRD/2021/8/25/IW/DV/S1A_IW_GRDH_1SDV_20210825T120549_20210825T120614_039386_04A6FC_7A0B/measurement/iw-vv.rtc.tiff"
- type "image/tiff; application=geotiff; profile=cloud-optimized"
- title "VV: vertical transmit, vertical receive"
- description "Terrain-corrected gamma naught values of signal transmitted with vertical polarization and received with vertical polarization with radiometric terrain correction applied."
- file:size 1859057771
- file:checksum "bbf26ae09c477c13fe4e46ddaacf3d8b"
raster:bands [] 1 items
0
- nodata -32768
- data_type "float32"
- spatial_resolution 10.0
roles [] 1 items
- 0 "data"
tilejson
- href "https://planetarycomputer.microsoft.com/api/data/v1/item/tilejson.json?collection=sentinel-1-rtc&item=S1A_IW_GRDH_1SDV_20210825T120549_20210825T120614_039386_04A6FC_rtc&assets=vv&assets=vh&tile_format=png&expression=0.03+%2B+log+%2810e-4+-+log+%280.05+%2F+%280.02+%2B+2+%2A+vv%29%29%29%3B0.05+%2B+exp+%280.25+%2A+%28log+%280.01+%2B+2+%2A+vv%29+%2B+log+%280.02+%2B+5+%2A+vh%29%29%29%3B1+-+log+%280.05+%2F+%280.045+-+0.9+%2A+vv%29%29&asset_as_band=True&rescale=0%2C.8000&rescale=0%2C1.000&rescale=0%2C1.000&format=png"
- type "application/json"
- title "TileJSON with default rendering"
roles [] 1 items
- 0 "tiles"
rendered_preview
- href "https://planetarycomputer.microsoft.com/api/data/v1/item/preview.png?collection=sentinel-1-rtc&item=S1A_IW_GRDH_1SDV_20210825T120549_20210825T120614_039386_04A6FC_rtc&assets=vv&assets=vh&tile_format=png&expression=0.03+%2B+log+%2810e-4+-+log+%280.05+%2F+%280.02+%2B+2+%2A+vv%29%29%29%3B0.05+%2B+exp+%280.25+%2A+%28log+%280.01+%2B+2+%2A+vv%29+%2B+log+%280.02+%2B+5+%2A+vh%29%29%29%3B1+-+log+%280.05+%2F+%280.045+-+0.9+%2A+vv%29%29&asset_as_band=True&rescale=0%2C.8000&rescale=0%2C1.000&rescale=0%2C1.000&format=png"
- type "image/png"
- title "Rendered preview"
- rel "preview"
roles [] 1 items
- 0 "overview"
bbox [] 4 items
- 0 88.21788976
- 1 26.75969009
- 2 90.9937412
- 3 28.68200291
stac_extensions [] 6 items
- 0 "https://stac-extensions.github.io/sar/v1.0.0/schema.json"
- 1 "https://stac-extensions.github.io/sat/v1.0.0/schema.json"
- 2 "https://stac-extensions.github.io/eo/v1.0.0/schema.json"
- 3 "https://stac-extensions.github.io/projection/v1.0.0/schema.json"
- 4 "https://stac-extensions.github.io/file/v2.0.0/schema.json"
- 5 "https://stac-extensions.github.io/raster/v1.1.0/schema.json"
- collection "sentinel-1-rtc"
84
- type "Feature"
- stac_version "1.0.0"
- id "S1A_IW_GRDH_1SDV_20210821T000315_20210821T000340_039320_04A4B9_rtc"
properties
- datetime "2021-08-21T00:03:28.059716Z"
- platform "SENTINEL-1A"
s1:shape [] 2 items
- 0 27540
- 1 21084
proj:bbox [] 4 items
- 0 524380.0
- 1 2980820.0
- 2 799780.0
- 3 3191660.0
- proj:epsg 32645
proj:shape [] 2 items
- 0 21084
- 1 27540
- end_datetime "2021-08-21 00:03:40.559065+00:00"
- constellation "Sentinel-1"
- s1:resolution "high"
proj:transform [] 9 items
- 0 10.0
- 1 0.0
- 2 524380.0
- 3 0.0
- 4 -10.0
- 5 3191660.0
- 6 0.0
- 7 0.0
- 8 1.0
- s1:datatake_id "304313"
- start_datetime "2021-08-21 00:03:15.560368+00:00"
- s1:orbit_source "DOWNLINK"
- s1:slice_number "12"
- s1:total_slices "17"
- sar:looks_range 5
- sat:orbit_state "descending"
- sar:product_type "GRD"
- sar:looks_azimuth 1
sar:polarizations [] 2 items
- 0 "VV"
- 1 "VH"
- sar:frequency_band "C"
- sat:absolute_orbit 39320
- sat:relative_orbit 48
- s1:processing_level "1"
- sar:instrument_mode "IW"
- sar:center_frequency 5.405
- sar:resolution_range 20
- s1:product_timeliness "Fast-24h"
- sar:resolution_azimuth 22
- sar:pixel_spacing_range 10
- sar:observation_direction "right"
- sar:pixel_spacing_azimuth 10
- sar:looks_equivalent_number 4.4
- s1:instrument_configuration_ID "7"
- sat:platform_international_designator "2014-016A"
geometry
- type "Polygon"
coordinates [] 1 items
0 [] 19 items
0 [] 2 items
- 0 89.8039112
- 1 27.0228452
1 [] 2 items
- 0 89.7768392
- 1 26.9952776
2 [] 2 items
- 0 89.784866
- 1 26.9224442
3 [] 2 items
- 0 87.304676
- 1 27.3293822
4 [] 2 items
- 0 87.425691
- 1 28.1940778
5 [] 2 items
- 0 87.5578145
- 1 28.8400273
6 [] 2 items
- 0 90.0496411
- 1 28.4415057
7 [] 2 items
- 0 90.0259221
- 1 28.2909078
8 [] 2 items
- 0 89.9730304
- 1 28.1916754
9 [] 2 items
- 0 89.9975753
- 1 28.1482035
10 [] 2 items
- 0 89.9710842
- 1 28.0843757
11 [] 2 items
- 0 89.9873345
- 1 28.002659
12 [] 2 items
- 0 89.9440409
- 1 27.9503721
13 [] 2 items
- 0 89.9282249
- 1 27.8233365
14 [] 2 items
- 0 89.9523144
- 1 27.6784002
15 [] 2 items
- 0 89.9215023
- 1 27.6324152
16 [] 2 items
- 0 89.9022394
- 1 27.4315562
17 [] 2 items
- 0 89.8290894
- 1 27.2746397
18 [] 2 items
- 0 89.8039112
- 1 27.0228452
links [] 7 items
0
- rel "collection"
- href "https://planetarycomputer.microsoft.com/api/stac/v1/collections/sentinel-1-rtc"
- type "application/json"
1
- rel "parent"
- href "https://planetarycomputer.microsoft.com/api/stac/v1/collections/sentinel-1-rtc"
- type "application/json"
2
- rel "root"
- href "https://planetarycomputer.microsoft.com/api/stac/v1"
- type "application/json"
- title "Microsoft Planetary Computer STAC API"
3
- rel "self"
- href "https://planetarycomputer.microsoft.com/api/stac/v1/collections/sentinel-1-rtc/items/S1A_IW_GRDH_1SDV_20210821T000315_20210821T000340_039320_04A4B9_rtc"
- type "application/geo+json"
4
- rel "license"
- href "https://sentinel.esa.int/documents/247904/690755/Sentinel_Data_Legal_Notice"
5
- rel "derived_from"
- href "https://planetarycomputer.microsoft.com/api/stac/v1/collections/sentinel-1-grd/items/S1A_IW_GRDH_1SDV_20210821T000315_20210821T000340_039320_04A4B9"
- type "application/json"
- title "Sentinel 1 GRD Item"
6
- rel "preview"
- href "https://planetarycomputer.microsoft.com/api/data/v1/item/map?collection=sentinel-1-rtc&item=S1A_IW_GRDH_1SDV_20210821T000315_20210821T000340_039320_04A4B9_rtc"
- type "text/html"
- title "Map of item"
assets
vh
- href "https://sentinel1euwestrtc.blob.core.windows.net/sentinel1-grd-rtc/GRD/2021/8/21/IW/DV/S1A_IW_GRDH_1SDV_20210821T000315_20210821T000340_039320_04A4B9_7651/measurement/iw-vh.rtc.tiff"
- type "image/tiff; application=geotiff; profile=cloud-optimized"
- title "VH: vertical transmit, horizontal receive"
- description "Terrain-corrected gamma naught values of signal transmitted with vertical polarization and received with horizontal polarization with radiometric terrain correction applied."
- file:size 1841180976
- file:checksum "d47b81a20e85c89a9ca739dc611f1bdd"
raster:bands [] 1 items
0
- nodata -32768
- data_type "float32"
- spatial_resolution 10.0
roles [] 1 items
- 0 "data"
vv
- href "https://sentinel1euwestrtc.blob.core.windows.net/sentinel1-grd-rtc/GRD/2021/8/21/IW/DV/S1A_IW_GRDH_1SDV_20210821T000315_20210821T000340_039320_04A4B9_7651/measurement/iw-vv.rtc.tiff"
- type "image/tiff; application=geotiff; profile=cloud-optimized"
- title "VV: vertical transmit, vertical receive"
- description "Terrain-corrected gamma naught values of signal transmitted with vertical polarization and received with vertical polarization with radiometric terrain correction applied."
- file:size 1848338829
- file:checksum "8536ed7de681dbe2b83797f670e4d64b"
raster:bands [] 1 items
0
- nodata -32768
- data_type "float32"
- spatial_resolution 10.0
roles [] 1 items
- 0 "data"
tilejson
- href "https://planetarycomputer.microsoft.com/api/data/v1/item/tilejson.json?collection=sentinel-1-rtc&item=S1A_IW_GRDH_1SDV_20210821T000315_20210821T000340_039320_04A4B9_rtc&assets=vv&assets=vh&tile_format=png&expression=0.03+%2B+log+%2810e-4+-+log+%280.05+%2F+%280.02+%2B+2+%2A+vv%29%29%29%3B0.05+%2B+exp+%280.25+%2A+%28log+%280.01+%2B+2+%2A+vv%29+%2B+log+%280.02+%2B+5+%2A+vh%29%29%29%3B1+-+log+%280.05+%2F+%280.045+-+0.9+%2A+vv%29%29&asset_as_band=True&rescale=0%2C.8000&rescale=0%2C1.000&rescale=0%2C1.000&format=png"
- type "application/json"
- title "TileJSON with default rendering"
roles [] 1 items
- 0 "tiles"
rendered_preview
- href "https://planetarycomputer.microsoft.com/api/data/v1/item/preview.png?collection=sentinel-1-rtc&item=S1A_IW_GRDH_1SDV_20210821T000315_20210821T000340_039320_04A4B9_rtc&assets=vv&assets=vh&tile_format=png&expression=0.03+%2B+log+%2810e-4+-+log+%280.05+%2F+%280.02+%2B+2+%2A+vv%29%29%29%3B0.05+%2B+exp+%280.25+%2A+%28log+%280.01+%2B+2+%2A+vv%29+%2B+log+%280.02+%2B+5+%2A+vh%29%29%29%3B1+-+log+%280.05+%2F+%280.045+-+0.9+%2A+vv%29%29&asset_as_band=True&rescale=0%2C.8000&rescale=0%2C1.000&rescale=0%2C1.000&format=png"
- type "image/png"
- title "Rendered preview"
- rel "preview"
roles [] 1 items
- 0 "overview"
bbox [] 4 items
- 0 87.30467602
- 1 26.92244421
- 2 90.04964105
- 3 28.84002733
stac_extensions [] 6 items
- 0 "https://stac-extensions.github.io/sar/v1.0.0/schema.json"
- 1 "https://stac-extensions.github.io/sat/v1.0.0/schema.json"
- 2 "https://stac-extensions.github.io/eo/v1.0.0/schema.json"
- 3 "https://stac-extensions.github.io/projection/v1.0.0/schema.json"
- 4 "https://stac-extensions.github.io/file/v2.0.0/schema.json"
- 5 "https://stac-extensions.github.io/raster/v1.1.0/schema.json"
- collection "sentinel-1-rtc"
85
- type "Feature"
- stac_version "1.0.0"
- id "S1A_IW_GRDH_1SDV_20210818T121356_20210818T121421_039284_04A383_rtc"
properties
- datetime "2021-08-18T12:14:09.226637Z"
- platform "SENTINEL-1A"
s1:shape [] 2 items
- 0 28151
- 1 21598
proj:bbox [] 4 items
- 0 421840.0
- 1 2916230.0
- 2 703350.0
- 3 3132210.0
- proj:epsg 32645
proj:shape [] 2 items
- 0 21598
- 1 28151
- end_datetime "2021-08-18 12:14:21.725577+00:00"
- constellation "Sentinel-1"
- s1:resolution "high"
proj:transform [] 9 items
- 0 10.0
- 1 0.0
- 2 421840.0
- 3 0.0
- 4 -10.0
- 5 3132210.0
- 6 0.0
- 7 0.0
- 8 1.0
- s1:datatake_id "304003"
- start_datetime "2021-08-18 12:13:56.727697+00:00"
- s1:orbit_source "DOWNLINK"
- s1:slice_number "6"
- s1:total_slices "20"
- sar:looks_range 5
- sat:orbit_state "ascending"
- sar:product_type "GRD"
- sar:looks_azimuth 1
sar:polarizations [] 2 items
- 0 "VV"
- 1 "VH"
- sar:frequency_band "C"
- sat:absolute_orbit 39284
- sat:relative_orbit 12
- s1:processing_level "1"
- sar:instrument_mode "IW"
- sar:center_frequency 5.405
- sar:resolution_range 20
- s1:product_timeliness "Fast-24h"
- sar:resolution_azimuth 22
- sar:pixel_spacing_range 10
- sar:observation_direction "right"
- sar:pixel_spacing_azimuth 10
- sar:looks_equivalent_number 4.4
- s1:instrument_configuration_ID "7"
- sat:platform_international_designator "2014-016A"
geometry
- type "Polygon"
coordinates [] 1 items
0 [] 15 items
0 [] 2 items
- 0 86.2062181
- 1 27.8442299
1 [] 2 items
- 0 86.2109736
- 1 27.8817191
2 [] 2 items
- 0 88.7383568
- 1 28.2896054
3 [] 2 items
- 0 88.9225449
- 1 27.3279503
4 [] 2 items
- 0 88.984873
- 1 26.777075
5 [] 2 items
- 0 86.4993771
- 1 26.3666866
6 [] 2 items
- 0 86.3556367
- 1 27.1612117
7 [] 2 items
- 0 86.3189746
- 1 27.2316372
8 [] 2 items
- 0 86.3284014
- 1 27.377031
9 [] 2 items
- 0 86.2778756
- 1 27.4646176
10 [] 2 items
- 0 86.2713781
- 1 27.6976719
11 [] 2 items
- 0 86.216803
- 1 27.7560506
12 [] 2 items
- 0 86.23489
- 1 27.7815182
13 [] 2 items
- 0 86.2103145
- 1 27.7833659
14 [] 2 items
- 0 86.2062181
- 1 27.8442299
links [] 7 items
0
- rel "collection"
- href "https://planetarycomputer.microsoft.com/api/stac/v1/collections/sentinel-1-rtc"
- type "application/json"
1
- rel "parent"
- href "https://planetarycomputer.microsoft.com/api/stac/v1/collections/sentinel-1-rtc"
- type "application/json"
2
- rel "root"
- href "https://planetarycomputer.microsoft.com/api/stac/v1"
- type "application/json"
- title "Microsoft Planetary Computer STAC API"
3
- rel "self"
- href "https://planetarycomputer.microsoft.com/api/stac/v1/collections/sentinel-1-rtc/items/S1A_IW_GRDH_1SDV_20210818T121356_20210818T121421_039284_04A383_rtc"
- type "application/geo+json"
4
- rel "license"
- href "https://sentinel.esa.int/documents/247904/690755/Sentinel_Data_Legal_Notice"
5
- rel "derived_from"
- href "https://planetarycomputer.microsoft.com/api/stac/v1/collections/sentinel-1-grd/items/S1A_IW_GRDH_1SDV_20210818T121356_20210818T121421_039284_04A383"
- type "application/json"
- title "Sentinel 1 GRD Item"
6
- rel "preview"
- href "https://planetarycomputer.microsoft.com/api/data/v1/item/map?collection=sentinel-1-rtc&item=S1A_IW_GRDH_1SDV_20210818T121356_20210818T121421_039284_04A383_rtc"
- type "text/html"
- title "Map of item"
assets
vh
- href "https://sentinel1euwestrtc.blob.core.windows.net/sentinel1-grd-rtc/GRD/2021/8/18/IW/DV/S1A_IW_GRDH_1SDV_20210818T121356_20210818T121421_039284_04A383_BC2E/measurement/iw-vh.rtc.tiff"
- type "image/tiff; application=geotiff; profile=cloud-optimized"
- title "VH: vertical transmit, horizontal receive"
- description "Terrain-corrected gamma naught values of signal transmitted with vertical polarization and received with horizontal polarization with radiometric terrain correction applied."
- file:size 1865977949
- file:checksum "c72bf190efce03f57ab0e694fe8b75e6"
raster:bands [] 1 items
0
- nodata -32768
- data_type "float32"
- spatial_resolution 10.0
roles [] 1 items
- 0 "data"
vv
- href "https://sentinel1euwestrtc.blob.core.windows.net/sentinel1-grd-rtc/GRD/2021/8/18/IW/DV/S1A_IW_GRDH_1SDV_20210818T121356_20210818T121421_039284_04A383_BC2E/measurement/iw-vv.rtc.tiff"
- type "image/tiff; application=geotiff; profile=cloud-optimized"
- title "VV: vertical transmit, vertical receive"
- description "Terrain-corrected gamma naught values of signal transmitted with vertical polarization and received with vertical polarization with radiometric terrain correction applied."
- file:size 1874387191
- file:checksum "f8d22b60375ca3de7a66ef403d000a09"
raster:bands [] 1 items
0
- nodata -32768
- data_type "float32"
- spatial_resolution 10.0
roles [] 1 items
- 0 "data"
tilejson
- href "https://planetarycomputer.microsoft.com/api/data/v1/item/tilejson.json?collection=sentinel-1-rtc&item=S1A_IW_GRDH_1SDV_20210818T121356_20210818T121421_039284_04A383_rtc&assets=vv&assets=vh&tile_format=png&expression=0.03+%2B+log+%2810e-4+-+log+%280.05+%2F+%280.02+%2B+2+%2A+vv%29%29%29%3B0.05+%2B+exp+%280.25+%2A+%28log+%280.01+%2B+2+%2A+vv%29+%2B+log+%280.02+%2B+5+%2A+vh%29%29%29%3B1+-+log+%280.05+%2F+%280.045+-+0.9+%2A+vv%29%29&asset_as_band=True&rescale=0%2C.8000&rescale=0%2C1.000&rescale=0%2C1.000&format=png"
- type "application/json"
- title "TileJSON with default rendering"
roles [] 1 items
- 0 "tiles"
rendered_preview
- href "https://planetarycomputer.microsoft.com/api/data/v1/item/preview.png?collection=sentinel-1-rtc&item=S1A_IW_GRDH_1SDV_20210818T121356_20210818T121421_039284_04A383_rtc&assets=vv&assets=vh&tile_format=png&expression=0.03+%2B+log+%2810e-4+-+log+%280.05+%2F+%280.02+%2B+2+%2A+vv%29%29%29%3B0.05+%2B+exp+%280.25+%2A+%28log+%280.01+%2B+2+%2A+vv%29+%2B+log+%280.02+%2B+5+%2A+vh%29%29%29%3B1+-+log+%280.05+%2F+%280.045+-+0.9+%2A+vv%29%29&asset_as_band=True&rescale=0%2C.8000&rescale=0%2C1.000&rescale=0%2C1.000&format=png"
- type "image/png"
- title "Rendered preview"
- rel "preview"
roles [] 1 items
- 0 "overview"
bbox [] 4 items
- 0 86.20621812
- 1 26.36668659
- 2 88.98487301
- 3 28.28960544
stac_extensions [] 6 items
- 0 "https://stac-extensions.github.io/sar/v1.0.0/schema.json"
- 1 "https://stac-extensions.github.io/sat/v1.0.0/schema.json"
- 2 "https://stac-extensions.github.io/eo/v1.0.0/schema.json"
- 3 "https://stac-extensions.github.io/projection/v1.0.0/schema.json"
- 4 "https://stac-extensions.github.io/file/v2.0.0/schema.json"
- 5 "https://stac-extensions.github.io/raster/v1.1.0/schema.json"
- collection "sentinel-1-rtc"
86
- type "Feature"
- stac_version "1.0.0"
- id "S1A_IW_GRDH_1SDV_20210813T120549_20210813T120614_039211_04A0FF_rtc"
properties
- datetime "2021-08-13T12:06:01.713793Z"
- platform "SENTINEL-1A"
s1:shape [] 2 items
- 0 28421
- 1 21971
proj:bbox [] 4 items
- 0 618300.0
- 1 2960450.0
- 2 902510.0
- 3 3180160.0
- proj:epsg 32645
proj:shape [] 2 items
- 0 21971
- 1 28421
- end_datetime "2021-08-13 12:06:14.213502+00:00"
- constellation "Sentinel-1"
- s1:resolution "high"
proj:transform [] 9 items
- 0 10.0
- 1 0.0
- 2 618300.0
- 3 0.0
- 4 -10.0
- 5 3180160.0
- 6 0.0
- 7 0.0
- 8 1.0
- s1:datatake_id "303359"
- start_datetime "2021-08-13 12:05:49.214084+00:00"
- s1:orbit_source "DOWNLINK"
- s1:slice_number "6"
- s1:total_slices "21"
- sar:looks_range 5
- sat:orbit_state "ascending"
- sar:product_type "GRD"
- sar:looks_azimuth 1
sar:polarizations [] 2 items
- 0 "VV"
- 1 "VH"
- sar:frequency_band "C"
- sat:absolute_orbit 39211
- sat:relative_orbit 114
- s1:processing_level "1"
- sar:instrument_mode "IW"
- sar:center_frequency 5.405
- sar:resolution_range 20
- s1:product_timeliness "Fast-24h"
- sar:resolution_azimuth 22
- sar:pixel_spacing_range 10
- sar:observation_direction "right"
- sar:pixel_spacing_azimuth 10
- sar:looks_equivalent_number 4.4
- s1:instrument_configuration_ID "7"
- sat:platform_international_designator "2014-016A"
geometry
- type "Polygon"
coordinates [] 1 items
0 [] 14 items
0 [] 2 items
- 0 89.980624
- 1 27.012266
1 [] 2 items
- 0 90.9942447
- 1 27.1729097
2 [] 2 items
- 0 90.725573
- 1 28.681986
3 [] 2 items
- 0 88.2187053
- 1 28.2800241
4 [] 2 items
- 0 88.356795
- 1 27.7231799
5 [] 2 items
- 0 88.3308725
- 1 27.584516
6 [] 2 items
- 0 88.3776098
- 1 27.5225003
7 [] 2 items
- 0 88.3594088
- 1 27.4089452
8 [] 2 items
- 0 88.4015868
- 1 27.3368568
9 [] 2 items
- 0 88.3800308
- 1 27.302048
10 [] 2 items
- 0 88.4170101
- 1 27.2061761
11 [] 2 items
- 0 88.4054532
- 1 27.0894856
12 [] 2 items
- 0 88.4763396
- 1 26.759773
13 [] 2 items
- 0 89.980624
- 1 27.012266
links [] 7 items
0
- rel "collection"
- href "https://planetarycomputer.microsoft.com/api/stac/v1/collections/sentinel-1-rtc"
- type "application/json"
1
- rel "parent"
- href "https://planetarycomputer.microsoft.com/api/stac/v1/collections/sentinel-1-rtc"
- type "application/json"
2
- rel "root"
- href "https://planetarycomputer.microsoft.com/api/stac/v1"
- type "application/json"
- title "Microsoft Planetary Computer STAC API"
3
- rel "self"
- href "https://planetarycomputer.microsoft.com/api/stac/v1/collections/sentinel-1-rtc/items/S1A_IW_GRDH_1SDV_20210813T120549_20210813T120614_039211_04A0FF_rtc"
- type "application/geo+json"
4
- rel "license"
- href "https://sentinel.esa.int/documents/247904/690755/Sentinel_Data_Legal_Notice"
5
- rel "derived_from"
- href "https://planetarycomputer.microsoft.com/api/stac/v1/collections/sentinel-1-grd/items/S1A_IW_GRDH_1SDV_20210813T120549_20210813T120614_039211_04A0FF"
- type "application/json"
- title "Sentinel 1 GRD Item"
6
- rel "preview"
- href "https://planetarycomputer.microsoft.com/api/data/v1/item/map?collection=sentinel-1-rtc&item=S1A_IW_GRDH_1SDV_20210813T120549_20210813T120614_039211_04A0FF_rtc"
- type "text/html"
- title "Map of item"
assets
vh
- href "https://sentinel1euwestrtc.blob.core.windows.net/sentinel1-grd-rtc/GRD/2021/8/13/IW/DV/S1A_IW_GRDH_1SDV_20210813T120549_20210813T120614_039211_04A0FF_0305/measurement/iw-vh.rtc.tiff"
- type "image/tiff; application=geotiff; profile=cloud-optimized"
- title "VH: vertical transmit, horizontal receive"
- description "Terrain-corrected gamma naught values of signal transmitted with vertical polarization and received with horizontal polarization with radiometric terrain correction applied."
- file:size 1848888770
- file:checksum "768978653becd310c5c3562153d39352"
raster:bands [] 1 items
0
- nodata -32768
- data_type "float32"
- spatial_resolution 10.0
roles [] 1 items
- 0 "data"
vv
- href "https://sentinel1euwestrtc.blob.core.windows.net/sentinel1-grd-rtc/GRD/2021/8/13/IW/DV/S1A_IW_GRDH_1SDV_20210813T120549_20210813T120614_039211_04A0FF_0305/measurement/iw-vv.rtc.tiff"
- type "image/tiff; application=geotiff; profile=cloud-optimized"
- title "VV: vertical transmit, vertical receive"
- description "Terrain-corrected gamma naught values of signal transmitted with vertical polarization and received with vertical polarization with radiometric terrain correction applied."
- file:size 1857678647
- file:checksum "b8add69dceb8ee53445731c6f5ca7536"
raster:bands [] 1 items
0
- nodata -32768
- data_type "float32"
- spatial_resolution 10.0
roles [] 1 items
- 0 "data"
tilejson
- href "https://planetarycomputer.microsoft.com/api/data/v1/item/tilejson.json?collection=sentinel-1-rtc&item=S1A_IW_GRDH_1SDV_20210813T120549_20210813T120614_039211_04A0FF_rtc&assets=vv&assets=vh&tile_format=png&expression=0.03+%2B+log+%2810e-4+-+log+%280.05+%2F+%280.02+%2B+2+%2A+vv%29%29%29%3B0.05+%2B+exp+%280.25+%2A+%28log+%280.01+%2B+2+%2A+vv%29+%2B+log+%280.02+%2B+5+%2A+vh%29%29%29%3B1+-+log+%280.05+%2F+%280.045+-+0.9+%2A+vv%29%29&asset_as_band=True&rescale=0%2C.8000&rescale=0%2C1.000&rescale=0%2C1.000&format=png"
- type "application/json"
- title "TileJSON with default rendering"
roles [] 1 items
- 0 "tiles"
rendered_preview
- href "https://planetarycomputer.microsoft.com/api/data/v1/item/preview.png?collection=sentinel-1-rtc&item=S1A_IW_GRDH_1SDV_20210813T120549_20210813T120614_039211_04A0FF_rtc&assets=vv&assets=vh&tile_format=png&expression=0.03+%2B+log+%2810e-4+-+log+%280.05+%2F+%280.02+%2B+2+%2A+vv%29%29%29%3B0.05+%2B+exp+%280.25+%2A+%28log+%280.01+%2B+2+%2A+vv%29+%2B+log+%280.02+%2B+5+%2A+vh%29%29%29%3B1+-+log+%280.05+%2F+%280.045+-+0.9+%2A+vv%29%29&asset_as_band=True&rescale=0%2C.8000&rescale=0%2C1.000&rescale=0%2C1.000&format=png"
- type "image/png"
- title "Rendered preview"
- rel "preview"
roles [] 1 items
- 0 "overview"
bbox [] 4 items
- 0 88.21870534
- 1 26.75977302
- 2 90.9942447
- 3 28.68198603
stac_extensions [] 6 items
- 0 "https://stac-extensions.github.io/sar/v1.0.0/schema.json"
- 1 "https://stac-extensions.github.io/sat/v1.0.0/schema.json"
- 2 "https://stac-extensions.github.io/eo/v1.0.0/schema.json"
- 3 "https://stac-extensions.github.io/projection/v1.0.0/schema.json"
- 4 "https://stac-extensions.github.io/file/v2.0.0/schema.json"
- 5 "https://stac-extensions.github.io/raster/v1.1.0/schema.json"
- collection "sentinel-1-rtc"
87
- type "Feature"
- stac_version "1.0.0"
- id "S1A_IW_GRDH_1SDV_20210809T000314_20210809T000339_039145_049EAC_rtc"
properties
- datetime "2021-08-09T00:03:27.454588Z"
- platform "SENTINEL-1A"
s1:shape [] 2 items
- 0 27539
- 1 21083
proj:bbox [] 4 items
- 0 524400.0
- 1 2980830.0
- 2 799790.0
- 3 3191660.0
- proj:epsg 32645
proj:shape [] 2 items
- 0 21083
- 1 27539
- end_datetime "2021-08-09 00:03:39.953924+00:00"
- constellation "Sentinel-1"
- s1:resolution "high"
proj:transform [] 9 items
- 0 10.0
- 1 0.0
- 2 524400.0
- 3 0.0
- 4 -10.0
- 5 3191660.0
- 6 0.0
- 7 0.0
- 8 1.0
- s1:datatake_id "302764"
- start_datetime "2021-08-09 00:03:14.955252+00:00"
- s1:orbit_source "DOWNLINK"
- s1:slice_number "12"
- s1:total_slices "17"
- sar:looks_range 5
- sat:orbit_state "descending"
- sar:product_type "GRD"
- sar:looks_azimuth 1
sar:polarizations [] 2 items
- 0 "VV"
- 1 "VH"
- sar:frequency_band "C"
- sat:absolute_orbit 39145
- sat:relative_orbit 48
- s1:processing_level "1"
- sar:instrument_mode "IW"
- sar:center_frequency 5.405
- sar:resolution_range 20
- s1:product_timeliness "Fast-24h"
- sar:resolution_azimuth 22
- sar:pixel_spacing_range 10
- sar:observation_direction "right"
- sar:pixel_spacing_azimuth 10
- sar:looks_equivalent_number 4.4
- s1:instrument_configuration_ID "7"
- sat:platform_international_designator "2014-016A"
geometry
- type "Polygon"
coordinates [] 1 items
0 [] 19 items
0 [] 2 items
- 0 89.8043207
- 1 27.0231077
1 [] 2 items
- 0 89.7771389
- 1 26.9951815
2 [] 2 items
- 0 89.784667
- 1 26.9225384
3 [] 2 items
- 0 87.3048782
- 1 27.3293818
4 [] 2 items
- 0 87.4258951
- 1 28.1941675
5 [] 2 items
- 0 87.5582245
- 1 28.8400256
6 [] 2 items
- 0 90.0496436
- 1 28.4415958
7 [] 2 items
- 0 90.0262327
- 1 28.2910813
8 [] 2 items
- 0 89.9732389
- 1 28.1918512
9 [] 2 items
- 0 89.9977787
- 1 28.1481991
10 [] 2 items
- 0 89.9711833
- 1 28.0842833
11 [] 2 items
- 0 89.9875127
- 1 28.0017531
12 [] 2 items
- 0 89.9442464
- 1 27.9504579
13 [] 2 items
- 0 89.9292632
- 1 27.8242165
14 [] 2 items
- 0 89.9525169
- 1 27.6783958
15 [] 2 items
- 0 89.9217048
- 1 27.6324109
16 [] 2 items
- 0 89.903036
- 1 27.4310885
17 [] 2 items
- 0 89.829188
- 1 27.2745475
18 [] 2 items
- 0 89.8043207
- 1 27.0231077
links [] 7 items
0
- rel "collection"
- href "https://planetarycomputer.microsoft.com/api/stac/v1/collections/sentinel-1-rtc"
- type "application/json"
1
- rel "parent"
- href "https://planetarycomputer.microsoft.com/api/stac/v1/collections/sentinel-1-rtc"
- type "application/json"
2
- rel "root"
- href "https://planetarycomputer.microsoft.com/api/stac/v1"
- type "application/json"
- title "Microsoft Planetary Computer STAC API"
3
- rel "self"
- href "https://planetarycomputer.microsoft.com/api/stac/v1/collections/sentinel-1-rtc/items/S1A_IW_GRDH_1SDV_20210809T000314_20210809T000339_039145_049EAC_rtc"
- type "application/geo+json"
4
- rel "license"
- href "https://sentinel.esa.int/documents/247904/690755/Sentinel_Data_Legal_Notice"
5
- rel "derived_from"
- href "https://planetarycomputer.microsoft.com/api/stac/v1/collections/sentinel-1-grd/items/S1A_IW_GRDH_1SDV_20210809T000314_20210809T000339_039145_049EAC"
- type "application/json"
- title "Sentinel 1 GRD Item"
6
- rel "preview"
- href "https://planetarycomputer.microsoft.com/api/data/v1/item/map?collection=sentinel-1-rtc&item=S1A_IW_GRDH_1SDV_20210809T000314_20210809T000339_039145_049EAC_rtc"
- type "text/html"
- title "Map of item"
assets
vh
- href "https://sentinel1euwestrtc.blob.core.windows.net/sentinel1-grd-rtc/GRD/2021/8/9/IW/DV/S1A_IW_GRDH_1SDV_20210809T000314_20210809T000339_039145_049EAC_FF46/measurement/iw-vh.rtc.tiff"
- type "image/tiff; application=geotiff; profile=cloud-optimized"
- title "VH: vertical transmit, horizontal receive"
- description "Terrain-corrected gamma naught values of signal transmitted with vertical polarization and received with horizontal polarization with radiometric terrain correction applied."
- file:size 1838141873
- file:checksum "407ea217dcd530cf2befc106ba45e6e2"
raster:bands [] 1 items
0
- nodata -32768
- data_type "float32"
- spatial_resolution 10.0
roles [] 1 items
- 0 "data"
vv
- href "https://sentinel1euwestrtc.blob.core.windows.net/sentinel1-grd-rtc/GRD/2021/8/9/IW/DV/S1A_IW_GRDH_1SDV_20210809T000314_20210809T000339_039145_049EAC_FF46/measurement/iw-vv.rtc.tiff"
- type "image/tiff; application=geotiff; profile=cloud-optimized"
- title "VV: vertical transmit, vertical receive"
- description "Terrain-corrected gamma naught values of signal transmitted with vertical polarization and received with vertical polarization with radiometric terrain correction applied."
- file:size 1845668472
- file:checksum "3e72c0abee4953f9d1a2b2b4ac4c8a1a"
raster:bands [] 1 items
0
- nodata -32768
- data_type "float32"
- spatial_resolution 10.0
roles [] 1 items
- 0 "data"
tilejson
- href "https://planetarycomputer.microsoft.com/api/data/v1/item/tilejson.json?collection=sentinel-1-rtc&item=S1A_IW_GRDH_1SDV_20210809T000314_20210809T000339_039145_049EAC_rtc&assets=vv&assets=vh&tile_format=png&expression=0.03+%2B+log+%2810e-4+-+log+%280.05+%2F+%280.02+%2B+2+%2A+vv%29%29%29%3B0.05+%2B+exp+%280.25+%2A+%28log+%280.01+%2B+2+%2A+vv%29+%2B+log+%280.02+%2B+5+%2A+vh%29%29%29%3B1+-+log+%280.05+%2F+%280.045+-+0.9+%2A+vv%29%29&asset_as_band=True&rescale=0%2C.8000&rescale=0%2C1.000&rescale=0%2C1.000&format=png"
- type "application/json"
- title "TileJSON with default rendering"
roles [] 1 items
- 0 "tiles"
rendered_preview
- href "https://planetarycomputer.microsoft.com/api/data/v1/item/preview.png?collection=sentinel-1-rtc&item=S1A_IW_GRDH_1SDV_20210809T000314_20210809T000339_039145_049EAC_rtc&assets=vv&assets=vh&tile_format=png&expression=0.03+%2B+log+%2810e-4+-+log+%280.05+%2F+%280.02+%2B+2+%2A+vv%29%29%29%3B0.05+%2B+exp+%280.25+%2A+%28log+%280.01+%2B+2+%2A+vv%29+%2B+log+%280.02+%2B+5+%2A+vh%29%29%29%3B1+-+log+%280.05+%2F+%280.045+-+0.9+%2A+vv%29%29&asset_as_band=True&rescale=0%2C.8000&rescale=0%2C1.000&rescale=0%2C1.000&format=png"
- type "image/png"
- title "Rendered preview"
- rel "preview"
roles [] 1 items
- 0 "overview"
bbox [] 4 items
- 0 87.30487819
- 1 26.92253836
- 2 90.04964364
- 3 28.84002564
stac_extensions [] 6 items
- 0 "https://stac-extensions.github.io/sar/v1.0.0/schema.json"
- 1 "https://stac-extensions.github.io/sat/v1.0.0/schema.json"
- 2 "https://stac-extensions.github.io/eo/v1.0.0/schema.json"
- 3 "https://stac-extensions.github.io/projection/v1.0.0/schema.json"
- 4 "https://stac-extensions.github.io/file/v2.0.0/schema.json"
- 5 "https://stac-extensions.github.io/raster/v1.1.0/schema.json"
- collection "sentinel-1-rtc"
88
- type "Feature"
- stac_version "1.0.0"
- id "S1A_IW_GRDH_1SDV_20210806T121356_20210806T121421_039109_049D70_rtc"
properties
- datetime "2021-08-06T12:14:08.698596Z"
- platform "SENTINEL-1A"
s1:shape [] 2 items
- 0 28152
- 1 21598
proj:bbox [] 4 items
- 0 421850.0
- 1 2916230.0
- 2 703370.0
- 3 3132210.0
- proj:epsg 32645
proj:shape [] 2 items
- 0 21598
- 1 28152
- end_datetime "2021-08-06 12:14:21.197519+00:00"
- constellation "Sentinel-1"
- s1:resolution "high"
proj:transform [] 9 items
- 0 10.0
- 1 0.0
- 2 421850.0
- 3 0.0
- 4 -10.0
- 5 3132210.0
- 6 0.0
- 7 0.0
- 8 1.0
- s1:datatake_id "302448"
- start_datetime "2021-08-06 12:13:56.199672+00:00"
- s1:orbit_source "DOWNLINK"
- s1:slice_number "6"
- s1:total_slices "20"
- sar:looks_range 5
- sat:orbit_state "ascending"
- sar:product_type "GRD"
- sar:looks_azimuth 1
sar:polarizations [] 2 items
- 0 "VV"
- 1 "VH"
- sar:frequency_band "C"
- sat:absolute_orbit 39109
- sat:relative_orbit 12
- s1:processing_level "1"
- sar:instrument_mode "IW"
- sar:center_frequency 5.405
- sar:resolution_range 20
- s1:product_timeliness "Fast-24h"
- sar:resolution_azimuth 22
- sar:pixel_spacing_range 10
- sar:observation_direction "right"
- sar:pixel_spacing_azimuth 10
- sar:looks_equivalent_number 4.4
- s1:instrument_configuration_ID "7"
- sat:platform_international_designator "2014-016A"
geometry
- type "Polygon"
coordinates [] 1 items
0 [] 15 items
0 [] 2 items
- 0 86.206319
- 1 27.8443207
1 [] 2 items
- 0 86.21138
- 1 27.8817215
2 [] 2 items
- 0 88.7386626
- 1 28.2896015
3 [] 2 items
- 0 88.9227485
- 1 27.3280378
4 [] 2 items
- 0 88.984972
- 1 26.7769833
5 [] 2 items
- 0 86.4996778
- 1 26.3666876
6 [] 2 items
- 0 86.3726319
- 1 27.0819315
7 [] 2 items
- 0 86.3191744
- 1 27.2319993
8 [] 2 items
- 0 86.3288059
- 1 27.377033
9 [] 2 items
- 0 86.2788888
- 1 27.4644423
10 [] 2 items
- 0 86.2716823
- 1 27.6976735
11 [] 2 items
- 0 86.217108
- 1 27.7559621
12 [] 2 items
- 0 86.235093
- 1 27.7815193
13 [] 2 items
- 0 86.2104121
- 1 27.7839081
14 [] 2 items
- 0 86.206319
- 1 27.8443207
links [] 7 items
0
- rel "collection"
- href "https://planetarycomputer.microsoft.com/api/stac/v1/collections/sentinel-1-rtc"
- type "application/json"
1
- rel "parent"
- href "https://planetarycomputer.microsoft.com/api/stac/v1/collections/sentinel-1-rtc"
- type "application/json"
2
- rel "root"
- href "https://planetarycomputer.microsoft.com/api/stac/v1"
- type "application/json"
- title "Microsoft Planetary Computer STAC API"
3
- rel "self"
- href "https://planetarycomputer.microsoft.com/api/stac/v1/collections/sentinel-1-rtc/items/S1A_IW_GRDH_1SDV_20210806T121356_20210806T121421_039109_049D70_rtc"
- type "application/geo+json"
4
- rel "license"
- href "https://sentinel.esa.int/documents/247904/690755/Sentinel_Data_Legal_Notice"
5
- rel "derived_from"
- href "https://planetarycomputer.microsoft.com/api/stac/v1/collections/sentinel-1-grd/items/S1A_IW_GRDH_1SDV_20210806T121356_20210806T121421_039109_049D70"
- type "application/json"
- title "Sentinel 1 GRD Item"
6
- rel "preview"
- href "https://planetarycomputer.microsoft.com/api/data/v1/item/map?collection=sentinel-1-rtc&item=S1A_IW_GRDH_1SDV_20210806T121356_20210806T121421_039109_049D70_rtc"
- type "text/html"
- title "Map of item"
assets
vh
- href "https://sentinel1euwestrtc.blob.core.windows.net/sentinel1-grd-rtc/GRD/2021/8/6/IW/DV/S1A_IW_GRDH_1SDV_20210806T121356_20210806T121421_039109_049D70_358F/measurement/iw-vh.rtc.tiff"
- type "image/tiff; application=geotiff; profile=cloud-optimized"
- title "VH: vertical transmit, horizontal receive"
- description "Terrain-corrected gamma naught values of signal transmitted with vertical polarization and received with horizontal polarization with radiometric terrain correction applied."
- file:size 1866849711
- file:checksum "096d272f2f36c25342ddd02481aa0a3e"
raster:bands [] 1 items
0
- nodata -32768
- data_type "float32"
- spatial_resolution 10.0
roles [] 1 items
- 0 "data"
vv
- href "https://sentinel1euwestrtc.blob.core.windows.net/sentinel1-grd-rtc/GRD/2021/8/6/IW/DV/S1A_IW_GRDH_1SDV_20210806T121356_20210806T121421_039109_049D70_358F/measurement/iw-vv.rtc.tiff"
- type "image/tiff; application=geotiff; profile=cloud-optimized"
- title "VV: vertical transmit, vertical receive"
- description "Terrain-corrected gamma naught values of signal transmitted with vertical polarization and received with vertical polarization with radiometric terrain correction applied."
- file:size 1875753699
- file:checksum "e1c25a88759a9a776a9278e4c78609b3"
raster:bands [] 1 items
0
- nodata -32768
- data_type "float32"
- spatial_resolution 10.0
roles [] 1 items
- 0 "data"
tilejson
- href "https://planetarycomputer.microsoft.com/api/data/v1/item/tilejson.json?collection=sentinel-1-rtc&item=S1A_IW_GRDH_1SDV_20210806T121356_20210806T121421_039109_049D70_rtc&assets=vv&assets=vh&tile_format=png&expression=0.03+%2B+log+%2810e-4+-+log+%280.05+%2F+%280.02+%2B+2+%2A+vv%29%29%29%3B0.05+%2B+exp+%280.25+%2A+%28log+%280.01+%2B+2+%2A+vv%29+%2B+log+%280.02+%2B+5+%2A+vh%29%29%29%3B1+-+log+%280.05+%2F+%280.045+-+0.9+%2A+vv%29%29&asset_as_band=True&rescale=0%2C.8000&rescale=0%2C1.000&rescale=0%2C1.000&format=png"
- type "application/json"
- title "TileJSON with default rendering"
roles [] 1 items
- 0 "tiles"
rendered_preview
- href "https://planetarycomputer.microsoft.com/api/data/v1/item/preview.png?collection=sentinel-1-rtc&item=S1A_IW_GRDH_1SDV_20210806T121356_20210806T121421_039109_049D70_rtc&assets=vv&assets=vh&tile_format=png&expression=0.03+%2B+log+%2810e-4+-+log+%280.05+%2F+%280.02+%2B+2+%2A+vv%29%29%29%3B0.05+%2B+exp+%280.25+%2A+%28log+%280.01+%2B+2+%2A+vv%29+%2B+log+%280.02+%2B+5+%2A+vh%29%29%29%3B1+-+log+%280.05+%2F+%280.045+-+0.9+%2A+vv%29%29&asset_as_band=True&rescale=0%2C.8000&rescale=0%2C1.000&rescale=0%2C1.000&format=png"
- type "image/png"
- title "Rendered preview"
- rel "preview"
roles [] 1 items
- 0 "overview"
bbox [] 4 items
- 0 86.20631901
- 1 26.36668765
- 2 88.98497197
- 3 28.28960155
stac_extensions [] 6 items
- 0 "https://stac-extensions.github.io/sar/v1.0.0/schema.json"
- 1 "https://stac-extensions.github.io/sat/v1.0.0/schema.json"
- 2 "https://stac-extensions.github.io/eo/v1.0.0/schema.json"
- 3 "https://stac-extensions.github.io/projection/v1.0.0/schema.json"
- 4 "https://stac-extensions.github.io/file/v2.0.0/schema.json"
- 5 "https://stac-extensions.github.io/raster/v1.1.0/schema.json"
- collection "sentinel-1-rtc"
89
- type "Feature"
- stac_version "1.0.0"
- id "S1A_IW_GRDH_1SDV_20210801T120548_20210801T120613_039036_049B1F_rtc"
properties
- datetime "2021-08-01T12:06:01.150857Z"
- platform "SENTINEL-1A"
s1:shape [] 2 items
- 0 28423
- 1 21970
proj:bbox [] 4 items
- 0 618240.0
- 1 2960460.0
- 2 902470.0
- 3 3180160.0
- proj:epsg 32645
proj:shape [] 2 items
- 0 21970
- 1 28423
- end_datetime "2021-08-01 12:06:13.649807+00:00"
- constellation "Sentinel-1"
- s1:resolution "high"
proj:transform [] 9 items
- 0 10.0
- 1 0.0
- 2 618240.0
- 3 0.0
- 4 -10.0
- 5 3180160.0
- 6 0.0
- 7 0.0
- 8 1.0
- s1:datatake_id "301855"
- start_datetime "2021-08-01 12:05:48.651907+00:00"
- s1:orbit_source "DOWNLINK"
- s1:slice_number "6"
- s1:total_slices "21"
- sar:looks_range 5
- sat:orbit_state "ascending"
- sar:product_type "GRD"
- sar:looks_azimuth 1
sar:polarizations [] 2 items
- 0 "VV"
- 1 "VH"
- sar:frequency_band "C"
- sat:absolute_orbit 39036
- sat:relative_orbit 114
- s1:processing_level "1"
- sar:instrument_mode "IW"
- sar:center_frequency 5.405
- sar:resolution_range 20
- s1:product_timeliness "Fast-24h"
- sar:resolution_azimuth 22
- sar:pixel_spacing_range 10
- sar:observation_direction "right"
- sar:pixel_spacing_azimuth 10
- sar:looks_equivalent_number 4.4
- s1:instrument_configuration_ID "7"
- sat:platform_international_designator "2014-016A"
geometry
- type "Polygon"
coordinates [] 1 items
0 [] 14 items
0 [] 2 items
- 0 89.9798187
- 1 27.0122831
1 [] 2 items
- 0 90.9937444
- 1 27.1730142
2 [] 2 items
- 0 90.7250623
- 1 28.6820001
3 [] 2 items
- 0 88.2181946
- 1 28.2799384
4 [] 2 items
- 0 88.356085
- 1 27.7231868
5 [] 2 items
- 0 88.330366
- 1 27.5845209
6 [] 2 items
- 0 88.3771013
- 1 27.5223248
7 [] 2 items
- 0 88.3589009
- 1 27.4087696
8 [] 2 items
- 0 88.4009815
- 1 27.3369532
9 [] 2 items
- 0 88.3795312
- 1 27.3025043
10 [] 2 items
- 0 88.4165065
- 1 27.2062715
11 [] 2 items
- 0 88.4048505
- 1 27.0896721
12 [] 2 items
- 0 88.4758368
- 1 26.7597783
13 [] 2 items
- 0 89.9798187
- 1 27.0122831
links [] 7 items
0
- rel "collection"
- href "https://planetarycomputer.microsoft.com/api/stac/v1/collections/sentinel-1-rtc"
- type "application/json"
1
- rel "parent"
- href "https://planetarycomputer.microsoft.com/api/stac/v1/collections/sentinel-1-rtc"
- type "application/json"
2
- rel "root"
- href "https://planetarycomputer.microsoft.com/api/stac/v1"
- type "application/json"
- title "Microsoft Planetary Computer STAC API"
3
- rel "self"
- href "https://planetarycomputer.microsoft.com/api/stac/v1/collections/sentinel-1-rtc/items/S1A_IW_GRDH_1SDV_20210801T120548_20210801T120613_039036_049B1F_rtc"
- type "application/geo+json"
4
- rel "license"
- href "https://sentinel.esa.int/documents/247904/690755/Sentinel_Data_Legal_Notice"
5
- rel "derived_from"
- href "https://planetarycomputer.microsoft.com/api/stac/v1/collections/sentinel-1-grd/items/S1A_IW_GRDH_1SDV_20210801T120548_20210801T120613_039036_049B1F"
- type "application/json"
- title "Sentinel 1 GRD Item"
6
- rel "preview"
- href "https://planetarycomputer.microsoft.com/api/data/v1/item/map?collection=sentinel-1-rtc&item=S1A_IW_GRDH_1SDV_20210801T120548_20210801T120613_039036_049B1F_rtc"
- type "text/html"
- title "Map of item"
assets
vh
- href "https://sentinel1euwestrtc.blob.core.windows.net/sentinel1-grd-rtc/GRD/2021/8/1/IW/DV/S1A_IW_GRDH_1SDV_20210801T120548_20210801T120613_039036_049B1F_F4CF/measurement/iw-vh.rtc.tiff"
- type "image/tiff; application=geotiff; profile=cloud-optimized"
- title "VH: vertical transmit, horizontal receive"
- description "Terrain-corrected gamma naught values of signal transmitted with vertical polarization and received with horizontal polarization with radiometric terrain correction applied."
- file:size 1849667547
- file:checksum "4eb635efbee259c88c82d5d88d54c9d1"
raster:bands [] 1 items
0
- nodata -32768
- data_type "float32"
- spatial_resolution 10.0
roles [] 1 items
- 0 "data"
vv
- href "https://sentinel1euwestrtc.blob.core.windows.net/sentinel1-grd-rtc/GRD/2021/8/1/IW/DV/S1A_IW_GRDH_1SDV_20210801T120548_20210801T120613_039036_049B1F_F4CF/measurement/iw-vv.rtc.tiff"
- type "image/tiff; application=geotiff; profile=cloud-optimized"
- title "VV: vertical transmit, vertical receive"
- description "Terrain-corrected gamma naught values of signal transmitted with vertical polarization and received with vertical polarization with radiometric terrain correction applied."
- file:size 1857752361
- file:checksum "132ed423fcfc43de1554182f7a771302"
raster:bands [] 1 items
0
- nodata -32768
- data_type "float32"
- spatial_resolution 10.0
roles [] 1 items
- 0 "data"
tilejson
- href "https://planetarycomputer.microsoft.com/api/data/v1/item/tilejson.json?collection=sentinel-1-rtc&item=S1A_IW_GRDH_1SDV_20210801T120548_20210801T120613_039036_049B1F_rtc&assets=vv&assets=vh&tile_format=png&expression=0.03+%2B+log+%2810e-4+-+log+%280.05+%2F+%280.02+%2B+2+%2A+vv%29%29%29%3B0.05+%2B+exp+%280.25+%2A+%28log+%280.01+%2B+2+%2A+vv%29+%2B+log+%280.02+%2B+5+%2A+vh%29%29%29%3B1+-+log+%280.05+%2F+%280.045+-+0.9+%2A+vv%29%29&asset_as_band=True&rescale=0%2C.8000&rescale=0%2C1.000&rescale=0%2C1.000&format=png"
- type "application/json"
- title "TileJSON with default rendering"
roles [] 1 items
- 0 "tiles"
rendered_preview
- href "https://planetarycomputer.microsoft.com/api/data/v1/item/preview.png?collection=sentinel-1-rtc&item=S1A_IW_GRDH_1SDV_20210801T120548_20210801T120613_039036_049B1F_rtc&assets=vv&assets=vh&tile_format=png&expression=0.03+%2B+log+%2810e-4+-+log+%280.05+%2F+%280.02+%2B+2+%2A+vv%29%29%29%3B0.05+%2B+exp+%280.25+%2A+%28log+%280.01+%2B+2+%2A+vv%29+%2B+log+%280.02+%2B+5+%2A+vh%29%29%29%3B1+-+log+%280.05+%2F+%280.045+-+0.9+%2A+vv%29%29&asset_as_band=True&rescale=0%2C.8000&rescale=0%2C1.000&rescale=0%2C1.000&format=png"
- type "image/png"
- title "Rendered preview"
- rel "preview"
roles [] 1 items
- 0 "overview"
bbox [] 4 items
- 0 88.21819458
- 1 26.75977826
- 2 90.99374441
- 3 28.6820001
stac_extensions [] 6 items
- 0 "https://stac-extensions.github.io/sar/v1.0.0/schema.json"
- 1 "https://stac-extensions.github.io/sat/v1.0.0/schema.json"
- 2 "https://stac-extensions.github.io/eo/v1.0.0/schema.json"
- 3 "https://stac-extensions.github.io/projection/v1.0.0/schema.json"
- 4 "https://stac-extensions.github.io/file/v2.0.0/schema.json"
- 5 "https://stac-extensions.github.io/raster/v1.1.0/schema.json"
- collection "sentinel-1-rtc"
90
- type "Feature"
- stac_version "1.0.0"
- id "S1A_IW_GRDH_1SDV_20210728T000314_20210728T000339_038970_04991E_rtc"
properties
- datetime "2021-07-28T00:03:26.667023Z"
- platform "SENTINEL-1A"
s1:shape [] 2 items
- 0 27532
- 1 21082
proj:bbox [] 4 items
- 0 524550.0
- 1 2980830.0
- 2 799870.0
- 3 3191650.0
- proj:epsg 32645
proj:shape [] 2 items
- 0 21082
- 1 27532
- end_datetime "2021-07-28 00:03:39.166376+00:00"
- constellation "Sentinel-1"
- s1:resolution "high"
proj:transform [] 9 items
- 0 10.0
- 1 0.0
- 2 524550.0
- 3 0.0
- 4 -10.0
- 5 3191650.0
- 6 0.0
- 7 0.0
- 8 1.0
- s1:datatake_id "301342"
- start_datetime "2021-07-28 00:03:14.167671+00:00"
- s1:orbit_source "DOWNLINK"
- s1:slice_number "12"
- s1:total_slices "17"
- sar:looks_range 5
- sat:orbit_state "descending"
- sar:product_type "GRD"
- sar:looks_azimuth 1
sar:polarizations [] 2 items
- 0 "VV"
- 1 "VH"
- sar:frequency_band "C"
- sat:absolute_orbit 38970
- sat:relative_orbit 48
- s1:processing_level "1"
- sar:instrument_mode "IW"
- sar:center_frequency 5.405
- sar:resolution_range 20
- s1:product_timeliness "Fast-24h"
- sar:resolution_azimuth 22
- sar:pixel_spacing_range 10
- sar:observation_direction "right"
- sar:pixel_spacing_azimuth 10
- sar:looks_equivalent_number 4.4
- s1:instrument_configuration_ID "7"
- sat:platform_international_designator "2014-016A"
geometry
- type "Polygon"
coordinates [] 1 items
0 [] 16 items
0 [] 2 items
- 0 89.8061085
- 1 27.0220796
1 [] 2 items
- 0 89.7789288
- 1 26.9942439
2 [] 2 items
- 0 89.7852751
- 1 26.9227068
3 [] 2 items
- 0 87.3061963
- 1 27.3308234
4 [] 2 items
- 0 87.4269162
- 1 28.1947059
5 [] 2 items
- 0 87.5601722
- 1 28.8400176
6 [] 2 items
- 0 90.050666
- 1 28.4416631
7 [] 2 items
- 0 89.9719965
- 1 28.0842657
8 [] 2 items
- 0 89.9890163
- 1 28.0009988
9 [] 2 items
- 0 89.9459099
- 1 27.9518656
10 [] 2 items
- 0 89.9322146
- 1 27.8509456
11 [] 2 items
- 0 89.9535199
- 1 27.6780136
12 [] 2 items
- 0 89.9238997
- 1 27.6387695
13 [] 2 items
- 0 89.9040649
- 1 27.4279096
14 [] 2 items
- 0 89.8308163
- 1 27.2750558
15 [] 2 items
- 0 89.8061085
- 1 27.0220796
links [] 7 items
0
- rel "collection"
- href "https://planetarycomputer.microsoft.com/api/stac/v1/collections/sentinel-1-rtc"
- type "application/json"
1
- rel "parent"
- href "https://planetarycomputer.microsoft.com/api/stac/v1/collections/sentinel-1-rtc"
- type "application/json"
2
- rel "root"
- href "https://planetarycomputer.microsoft.com/api/stac/v1"
- type "application/json"
- title "Microsoft Planetary Computer STAC API"
3
- rel "self"
- href "https://planetarycomputer.microsoft.com/api/stac/v1/collections/sentinel-1-rtc/items/S1A_IW_GRDH_1SDV_20210728T000314_20210728T000339_038970_04991E_rtc"
- type "application/geo+json"
4
- rel "license"
- href "https://sentinel.esa.int/documents/247904/690755/Sentinel_Data_Legal_Notice"
5
- rel "derived_from"
- href "https://planetarycomputer.microsoft.com/api/stac/v1/collections/sentinel-1-grd/items/S1A_IW_GRDH_1SDV_20210728T000314_20210728T000339_038970_04991E"
- type "application/json"
- title "Sentinel 1 GRD Item"
6
- rel "preview"
- href "https://planetarycomputer.microsoft.com/api/data/v1/item/map?collection=sentinel-1-rtc&item=S1A_IW_GRDH_1SDV_20210728T000314_20210728T000339_038970_04991E_rtc"
- type "text/html"
- title "Map of item"
assets
vh
- href "https://sentinel1euwestrtc.blob.core.windows.net/sentinel1-grd-rtc/GRD/2021/7/28/IW/DV/S1A_IW_GRDH_1SDV_20210728T000314_20210728T000339_038970_04991E_C882/measurement/iw-vh.rtc.tiff"
- type "image/tiff; application=geotiff; profile=cloud-optimized"
- title "VH: vertical transmit, horizontal receive"
- description "Terrain-corrected gamma naught values of signal transmitted with vertical polarization and received with horizontal polarization with radiometric terrain correction applied."
- file:size 1839235753
- file:checksum "929073f1cd952e202e43aa01a874b040"
raster:bands [] 1 items
0
- nodata -32768
- data_type "float32"
- spatial_resolution 10.0
roles [] 1 items
- 0 "data"
vv
- href "https://sentinel1euwestrtc.blob.core.windows.net/sentinel1-grd-rtc/GRD/2021/7/28/IW/DV/S1A_IW_GRDH_1SDV_20210728T000314_20210728T000339_038970_04991E_C882/measurement/iw-vv.rtc.tiff"
- type "image/tiff; application=geotiff; profile=cloud-optimized"
- title "VV: vertical transmit, vertical receive"
- description "Terrain-corrected gamma naught values of signal transmitted with vertical polarization and received with vertical polarization with radiometric terrain correction applied."
- file:size 1848864998
- file:checksum "e1f7470191ffa37e030aa013d9a2df39"
raster:bands [] 1 items
0
- nodata -32768
- data_type "float32"
- spatial_resolution 10.0
roles [] 1 items
- 0 "data"
tilejson
- href "https://planetarycomputer.microsoft.com/api/data/v1/item/tilejson.json?collection=sentinel-1-rtc&item=S1A_IW_GRDH_1SDV_20210728T000314_20210728T000339_038970_04991E_rtc&assets=vv&assets=vh&tile_format=png&expression=0.03+%2B+log+%2810e-4+-+log+%280.05+%2F+%280.02+%2B+2+%2A+vv%29%29%29%3B0.05+%2B+exp+%280.25+%2A+%28log+%280.01+%2B+2+%2A+vv%29+%2B+log+%280.02+%2B+5+%2A+vh%29%29%29%3B1+-+log+%280.05+%2F+%280.045+-+0.9+%2A+vv%29%29&asset_as_band=True&rescale=0%2C.8000&rescale=0%2C1.000&rescale=0%2C1.000&format=png"
- type "application/json"
- title "TileJSON with default rendering"
roles [] 1 items
- 0 "tiles"
rendered_preview
- href "https://planetarycomputer.microsoft.com/api/data/v1/item/preview.png?collection=sentinel-1-rtc&item=S1A_IW_GRDH_1SDV_20210728T000314_20210728T000339_038970_04991E_rtc&assets=vv&assets=vh&tile_format=png&expression=0.03+%2B+log+%2810e-4+-+log+%280.05+%2F+%280.02+%2B+2+%2A+vv%29%29%29%3B0.05+%2B+exp+%280.25+%2A+%28log+%280.01+%2B+2+%2A+vv%29+%2B+log+%280.02+%2B+5+%2A+vh%29%29%29%3B1+-+log+%280.05+%2F+%280.045+-+0.9+%2A+vv%29%29&asset_as_band=True&rescale=0%2C.8000&rescale=0%2C1.000&rescale=0%2C1.000&format=png"
- type "image/png"
- title "Rendered preview"
- rel "preview"
roles [] 1 items
- 0 "overview"
bbox [] 4 items
- 0 87.30619627
- 1 26.92270681
- 2 90.05066603
- 3 28.84001756
stac_extensions [] 6 items
- 0 "https://stac-extensions.github.io/sar/v1.0.0/schema.json"
- 1 "https://stac-extensions.github.io/sat/v1.0.0/schema.json"
- 2 "https://stac-extensions.github.io/eo/v1.0.0/schema.json"
- 3 "https://stac-extensions.github.io/projection/v1.0.0/schema.json"
- 4 "https://stac-extensions.github.io/file/v2.0.0/schema.json"
- 5 "https://stac-extensions.github.io/raster/v1.1.0/schema.json"
- collection "sentinel-1-rtc"
91
- type "Feature"
- stac_version "1.0.0"
- id "S1A_IW_GRDH_1SDV_20210725T121355_20210725T121420_038934_04980F_rtc"
properties
- datetime "2021-07-25T12:14:07.814919Z"
- platform "SENTINEL-1A"
s1:shape [] 2 items
- 0 28156
- 1 21598
proj:bbox [] 4 items
- 0 421910.0
- 1 2916240.0
- 2 703470.0
- 3 3132220.0
- proj:epsg 32645
proj:shape [] 2 items
- 0 21598
- 1 28156
- end_datetime "2021-07-25 12:14:20.313830+00:00"
- constellation "Sentinel-1"
- s1:resolution "high"
proj:transform [] 9 items
- 0 10.0
- 1 0.0
- 2 421910.0
- 3 0.0
- 4 -10.0
- 5 3132220.0
- 6 0.0
- 7 0.0
- 8 1.0
- s1:datatake_id "301071"
- start_datetime "2021-07-25 12:13:55.316007+00:00"
- s1:orbit_source "DOWNLINK"
- s1:slice_number "6"
- s1:total_slices "20"
- sar:looks_range 5
- sat:orbit_state "ascending"
- sar:product_type "GRD"
- sar:looks_azimuth 1
sar:polarizations [] 2 items
- 0 "VV"
- 1 "VH"
- sar:frequency_band "C"
- sat:absolute_orbit 38934
- sat:relative_orbit 12
- s1:processing_level "1"
- sar:instrument_mode "IW"
- sar:center_frequency 5.405
- sar:resolution_range 20
- s1:product_timeliness "Fast-24h"
- sar:resolution_azimuth 22
- sar:pixel_spacing_range 10
- sar:observation_direction "right"
- sar:pixel_spacing_azimuth 10
- sar:looks_equivalent_number 4.4
- s1:instrument_configuration_ID "7"
- sat:platform_international_designator "2014-016A"
geometry
- type "Polygon"
coordinates [] 1 items
0 [] 15 items
0 [] 2 items
- 0 86.2069263
- 1 27.844595
1 [] 2 items
- 0 86.211787
- 1 27.8816335
2 [] 2 items
- 0 88.7399877
- 1 28.2895847
3 [] 2 items
- 0 88.9237666
- 1 27.328475
4 [] 2 items
- 0 88.9861799
- 1 26.7770566
5 [] 2 items
- 0 86.5007803
- 1 26.3666915
6 [] 2 items
- 0 86.373639
- 1 27.0822068
7 [] 2 items
- 0 86.3202836
- 1 27.2322755
8 [] 2 items
- 0 86.3441296
- 1 27.2820428
9 [] 2 items
- 0 86.3157687
- 1 27.3098933
10 [] 2 items
- 0 86.3295116
- 1 27.3773975
11 [] 2 items
- 0 86.2796978
- 1 27.4645368
12 [] 2 items
- 0 86.2727961
- 1 27.6979502
13 [] 2 items
- 0 86.2189474
- 1 27.7541671
14 [] 2 items
- 0 86.2069263
- 1 27.844595
links [] 7 items
0
- rel "collection"
- href "https://planetarycomputer.microsoft.com/api/stac/v1/collections/sentinel-1-rtc"
- type "application/json"
1
- rel "parent"
- href "https://planetarycomputer.microsoft.com/api/stac/v1/collections/sentinel-1-rtc"
- type "application/json"
2
- rel "root"
- href "https://planetarycomputer.microsoft.com/api/stac/v1"
- type "application/json"
- title "Microsoft Planetary Computer STAC API"
3
- rel "self"
- href "https://planetarycomputer.microsoft.com/api/stac/v1/collections/sentinel-1-rtc/items/S1A_IW_GRDH_1SDV_20210725T121355_20210725T121420_038934_04980F_rtc"
- type "application/geo+json"
4
- rel "license"
- href "https://sentinel.esa.int/documents/247904/690755/Sentinel_Data_Legal_Notice"
5
- rel "derived_from"
- href "https://planetarycomputer.microsoft.com/api/stac/v1/collections/sentinel-1-grd/items/S1A_IW_GRDH_1SDV_20210725T121355_20210725T121420_038934_04980F"
- type "application/json"
- title "Sentinel 1 GRD Item"
6
- rel "preview"
- href "https://planetarycomputer.microsoft.com/api/data/v1/item/map?collection=sentinel-1-rtc&item=S1A_IW_GRDH_1SDV_20210725T121355_20210725T121420_038934_04980F_rtc"
- type "text/html"
- title "Map of item"
assets
vh
- href "https://sentinel1euwestrtc.blob.core.windows.net/sentinel1-grd-rtc/GRD/2021/7/25/IW/DV/S1A_IW_GRDH_1SDV_20210725T121355_20210725T121420_038934_04980F_52FF/measurement/iw-vh.rtc.tiff"
- type "image/tiff; application=geotiff; profile=cloud-optimized"
- title "VH: vertical transmit, horizontal receive"
- description "Terrain-corrected gamma naught values of signal transmitted with vertical polarization and received with horizontal polarization with radiometric terrain correction applied."
- file:size 1866902577
- file:checksum "620cc0e00adc415be0da32a043c91fdf"
raster:bands [] 1 items
0
- nodata -32768
- data_type "float32"
- spatial_resolution 10.0
roles [] 1 items
- 0 "data"
vv
- href "https://sentinel1euwestrtc.blob.core.windows.net/sentinel1-grd-rtc/GRD/2021/7/25/IW/DV/S1A_IW_GRDH_1SDV_20210725T121355_20210725T121420_038934_04980F_52FF/measurement/iw-vv.rtc.tiff"
- type "image/tiff; application=geotiff; profile=cloud-optimized"
- title "VV: vertical transmit, vertical receive"
- description "Terrain-corrected gamma naught values of signal transmitted with vertical polarization and received with vertical polarization with radiometric terrain correction applied."
- file:size 1876123828
- file:checksum "4eead1a710574c930ed138ef5ed6d1ca"
raster:bands [] 1 items
0
- nodata -32768
- data_type "float32"
- spatial_resolution 10.0
roles [] 1 items
- 0 "data"
tilejson
- href "https://planetarycomputer.microsoft.com/api/data/v1/item/tilejson.json?collection=sentinel-1-rtc&item=S1A_IW_GRDH_1SDV_20210725T121355_20210725T121420_038934_04980F_rtc&assets=vv&assets=vh&tile_format=png&expression=0.03+%2B+log+%2810e-4+-+log+%280.05+%2F+%280.02+%2B+2+%2A+vv%29%29%29%3B0.05+%2B+exp+%280.25+%2A+%28log+%280.01+%2B+2+%2A+vv%29+%2B+log+%280.02+%2B+5+%2A+vh%29%29%29%3B1+-+log+%280.05+%2F+%280.045+-+0.9+%2A+vv%29%29&asset_as_band=True&rescale=0%2C.8000&rescale=0%2C1.000&rescale=0%2C1.000&format=png"
- type "application/json"
- title "TileJSON with default rendering"
roles [] 1 items
- 0 "tiles"
rendered_preview
- href "https://planetarycomputer.microsoft.com/api/data/v1/item/preview.png?collection=sentinel-1-rtc&item=S1A_IW_GRDH_1SDV_20210725T121355_20210725T121420_038934_04980F_rtc&assets=vv&assets=vh&tile_format=png&expression=0.03+%2B+log+%2810e-4+-+log+%280.05+%2F+%280.02+%2B+2+%2A+vv%29%29%29%3B0.05+%2B+exp+%280.25+%2A+%28log+%280.01+%2B+2+%2A+vv%29+%2B+log+%280.02+%2B+5+%2A+vh%29%29%29%3B1+-+log+%280.05+%2F+%280.045+-+0.9+%2A+vv%29%29&asset_as_band=True&rescale=0%2C.8000&rescale=0%2C1.000&rescale=0%2C1.000&format=png"
- type "image/png"
- title "Rendered preview"
- rel "preview"
roles [] 1 items
- 0 "overview"
bbox [] 4 items
- 0 86.20692635
- 1 26.36669149
- 2 88.98617993
- 3 28.28958466
stac_extensions [] 6 items
- 0 "https://stac-extensions.github.io/sar/v1.0.0/schema.json"
- 1 "https://stac-extensions.github.io/sat/v1.0.0/schema.json"
- 2 "https://stac-extensions.github.io/eo/v1.0.0/schema.json"
- 3 "https://stac-extensions.github.io/projection/v1.0.0/schema.json"
- 4 "https://stac-extensions.github.io/file/v2.0.0/schema.json"
- 5 "https://stac-extensions.github.io/raster/v1.1.0/schema.json"
- collection "sentinel-1-rtc"
92
- type "Feature"
- stac_version "1.0.0"
- id "S1A_IW_GRDH_1SDV_20210720T120547_20210720T120612_038861_0495EC_rtc"
properties
- datetime "2021-07-20T12:06:00.428473Z"
- platform "SENTINEL-1A"
s1:shape [] 2 items
- 0 28425
- 1 21970
proj:bbox [] 4 items
- 0 618170.0
- 1 2960440.0
- 2 902420.0
- 3 3180140.0
- proj:epsg 32645
proj:shape [] 2 items
- 0 21970
- 1 28425
- end_datetime "2021-07-20 12:06:12.927516+00:00"
- constellation "Sentinel-1"
- s1:resolution "high"
proj:transform [] 9 items
- 0 10.0
- 1 0.0
- 2 618170.0
- 3 0.0
- 4 -10.0
- 5 3180140.0
- 6 0.0
- 7 0.0
- 8 1.0
- s1:datatake_id "300524"
- start_datetime "2021-07-20 12:05:47.929430+00:00"
- s1:orbit_source "DOWNLINK"
- s1:slice_number "6"
- s1:total_slices "21"
- sar:looks_range 5
- sat:orbit_state "ascending"
- sar:product_type "GRD"
- sar:looks_azimuth 1
sar:polarizations [] 2 items
- 0 "VV"
- 1 "VH"
- sar:frequency_band "C"
- sat:absolute_orbit 38861
- sat:relative_orbit 114
- s1:processing_level "1"
- sar:instrument_mode "IW"
- sar:center_frequency 5.405
- sar:resolution_range 20
- s1:product_timeliness "Fast-24h"
- sar:resolution_azimuth 22
- sar:pixel_spacing_range 10
- sar:observation_direction "right"
- sar:pixel_spacing_azimuth 10
- sar:looks_equivalent_number 4.4
- s1:instrument_configuration_ID "7"
- sat:platform_international_designator "2014-016A"
geometry
- type "Polygon"
coordinates [] 1 items
0 [] 14 items
0 [] 2 items
- 0 89.9815372
- 1 27.0125173
1 [] 2 items
- 0 90.9933352
- 1 27.1728455
2 [] 2 items
- 0 90.7246506
- 1 28.6819213
3 [] 2 items
- 0 88.2174789
- 1 28.2797643
4 [] 2 items
- 0 88.3547666
- 1 27.7231997
5 [] 2 items
- 0 88.3296548
- 1 27.5843472
6 [] 2 items
- 0 88.3761869
- 1 27.522063
7 [] 2 items
- 0 88.3577918
- 1 27.4090512
8 [] 2 items
- 0 88.4001685
- 1 27.3366002
9 [] 2 items
- 0 88.3790305
- 1 27.3028703
10 [] 2 items
- 0 88.4160063
- 1 27.2066376
11 [] 2 items
- 0 88.4040392
- 1 27.0893192
12 [] 2 items
- 0 88.4751307
- 1 26.7596051
13 [] 2 items
- 0 89.9815372
- 1 27.0125173
links [] 7 items
0
- rel "collection"
- href "https://planetarycomputer.microsoft.com/api/stac/v1/collections/sentinel-1-rtc"
- type "application/json"
1
- rel "parent"
- href "https://planetarycomputer.microsoft.com/api/stac/v1/collections/sentinel-1-rtc"
- type "application/json"
2
- rel "root"
- href "https://planetarycomputer.microsoft.com/api/stac/v1"
- type "application/json"
- title "Microsoft Planetary Computer STAC API"
3
- rel "self"
- href "https://planetarycomputer.microsoft.com/api/stac/v1/collections/sentinel-1-rtc/items/S1A_IW_GRDH_1SDV_20210720T120547_20210720T120612_038861_0495EC_rtc"
- type "application/geo+json"
4
- rel "license"
- href "https://sentinel.esa.int/documents/247904/690755/Sentinel_Data_Legal_Notice"
5
- rel "derived_from"
- href "https://planetarycomputer.microsoft.com/api/stac/v1/collections/sentinel-1-grd/items/S1A_IW_GRDH_1SDV_20210720T120547_20210720T120612_038861_0495EC"
- type "application/json"
- title "Sentinel 1 GRD Item"
6
- rel "preview"
- href "https://planetarycomputer.microsoft.com/api/data/v1/item/map?collection=sentinel-1-rtc&item=S1A_IW_GRDH_1SDV_20210720T120547_20210720T120612_038861_0495EC_rtc"
- type "text/html"
- title "Map of item"
assets
vh
- href "https://sentinel1euwestrtc.blob.core.windows.net/sentinel1-grd-rtc/GRD/2021/7/20/IW/DV/S1A_IW_GRDH_1SDV_20210720T120547_20210720T120612_038861_0495EC_D05A/measurement/iw-vh.rtc.tiff"
- type "image/tiff; application=geotiff; profile=cloud-optimized"
- title "VH: vertical transmit, horizontal receive"
- description "Terrain-corrected gamma naught values of signal transmitted with vertical polarization and received with horizontal polarization with radiometric terrain correction applied."
- file:size 1849476617
- file:checksum "364673a424eff2e7a337d7b810ce5116"
raster:bands [] 1 items
0
- nodata -32768
- data_type "float32"
- spatial_resolution 10.0
roles [] 1 items
- 0 "data"
vv
- href "https://sentinel1euwestrtc.blob.core.windows.net/sentinel1-grd-rtc/GRD/2021/7/20/IW/DV/S1A_IW_GRDH_1SDV_20210720T120547_20210720T120612_038861_0495EC_D05A/measurement/iw-vv.rtc.tiff"
- type "image/tiff; application=geotiff; profile=cloud-optimized"
- title "VV: vertical transmit, vertical receive"
- description "Terrain-corrected gamma naught values of signal transmitted with vertical polarization and received with vertical polarization with radiometric terrain correction applied."
- file:size 1858328480
- file:checksum "f1bb06901c94a5fb1a3c659115a7ea81"
raster:bands [] 1 items
0
- nodata -32768
- data_type "float32"
- spatial_resolution 10.0
roles [] 1 items
- 0 "data"
tilejson
- href "https://planetarycomputer.microsoft.com/api/data/v1/item/tilejson.json?collection=sentinel-1-rtc&item=S1A_IW_GRDH_1SDV_20210720T120547_20210720T120612_038861_0495EC_rtc&assets=vv&assets=vh&tile_format=png&expression=0.03+%2B+log+%2810e-4+-+log+%280.05+%2F+%280.02+%2B+2+%2A+vv%29%29%29%3B0.05+%2B+exp+%280.25+%2A+%28log+%280.01+%2B+2+%2A+vv%29+%2B+log+%280.02+%2B+5+%2A+vh%29%29%29%3B1+-+log+%280.05+%2F+%280.045+-+0.9+%2A+vv%29%29&asset_as_band=True&rescale=0%2C.8000&rescale=0%2C1.000&rescale=0%2C1.000&format=png"
- type "application/json"
- title "TileJSON with default rendering"
roles [] 1 items
- 0 "tiles"
rendered_preview
- href "https://planetarycomputer.microsoft.com/api/data/v1/item/preview.png?collection=sentinel-1-rtc&item=S1A_IW_GRDH_1SDV_20210720T120547_20210720T120612_038861_0495EC_rtc&assets=vv&assets=vh&tile_format=png&expression=0.03+%2B+log+%2810e-4+-+log+%280.05+%2F+%280.02+%2B+2+%2A+vv%29%29%29%3B0.05+%2B+exp+%280.25+%2A+%28log+%280.01+%2B+2+%2A+vv%29+%2B+log+%280.02+%2B+5+%2A+vh%29%29%29%3B1+-+log+%280.05+%2F+%280.045+-+0.9+%2A+vv%29%29&asset_as_band=True&rescale=0%2C.8000&rescale=0%2C1.000&rescale=0%2C1.000&format=png"
- type "image/png"
- title "Rendered preview"
- rel "preview"
roles [] 1 items
- 0 "overview"
bbox [] 4 items
- 0 88.21747889
- 1 26.75960507
- 2 90.99333519
- 3 28.68192128
stac_extensions [] 6 items
- 0 "https://stac-extensions.github.io/sar/v1.0.0/schema.json"
- 1 "https://stac-extensions.github.io/sat/v1.0.0/schema.json"
- 2 "https://stac-extensions.github.io/eo/v1.0.0/schema.json"
- 3 "https://stac-extensions.github.io/projection/v1.0.0/schema.json"
- 4 "https://stac-extensions.github.io/file/v2.0.0/schema.json"
- 5 "https://stac-extensions.github.io/raster/v1.1.0/schema.json"
- collection "sentinel-1-rtc"
93
- type "Feature"
- stac_version "1.0.0"
- id "S1A_IW_GRDH_1SDV_20210716T000313_20210716T000338_038795_0493DB_rtc"
properties
- datetime "2021-07-16T00:03:26.093195Z"
- platform "SENTINEL-1A"
s1:shape [] 2 items
- 0 27538
- 1 21084
proj:bbox [] 4 items
- 0 524400.0
- 1 2980820.0
- 2 799780.0
- 3 3191660.0
- proj:epsg 32645
proj:shape [] 2 items
- 0 21084
- 1 27538
- end_datetime "2021-07-16 00:03:38.592472+00:00"
- constellation "Sentinel-1"
- s1:resolution "high"
proj:transform [] 9 items
- 0 10.0
- 1 0.0
- 2 524400.0
- 3 0.0
- 4 -10.0
- 5 3191660.0
- 6 0.0
- 7 0.0
- 8 1.0
- s1:datatake_id "299995"
- start_datetime "2021-07-16 00:03:13.593918+00:00"
- s1:orbit_source "DOWNLINK"
- s1:slice_number "12"
- s1:total_slices "17"
- sar:looks_range 5
- sat:orbit_state "descending"
- sar:product_type "GRD"
- sar:looks_azimuth 1
sar:polarizations [] 2 items
- 0 "VV"
- 1 "VH"
- sar:frequency_band "C"
- sat:absolute_orbit 38795
- sat:relative_orbit 48
- s1:processing_level "1"
- sar:instrument_mode "IW"
- sar:center_frequency 5.405
- sar:resolution_range 20
- s1:product_timeliness "Fast-24h"
- sar:resolution_azimuth 22
- sar:pixel_spacing_range 10
- sar:observation_direction "right"
- sar:pixel_spacing_azimuth 10
- sar:looks_equivalent_number 4.4
- s1:instrument_configuration_ID "7"
- sat:platform_international_designator "2014-016A"
geometry
- type "Polygon"
coordinates [] 1 items
0 [] 19 items
0 [] 2 items
- 0 89.8040142
- 1 27.0229333
1 [] 2 items
- 0 89.7768347
- 1 26.9950972
2 [] 2 items
- 0 89.784667
- 1 26.9225384
3 [] 2 items
- 0 87.3047751
- 1 27.3286598
4 [] 2 items
- 0 87.4257922
- 1 28.193897
5 [] 2 items
- 0 87.558532
- 1 28.8400244
6 [] 2 items
- 0 90.0496436
- 1 28.4415958
7 [] 2 items
- 0 90.0260265
- 1 28.2909957
8 [] 2 items
- 0 89.9731371
- 1 28.1918535
9 [] 2 items
- 0 89.997677
- 1 28.1482013
10 [] 2 items
- 0 89.9710817
- 1 28.0842856
11 [] 2 items
- 0 89.9874385
- 1 28.002747
12 [] 2 items
- 0 89.9441448
- 1 27.9504601
13 [] 2 items
- 0 89.9284301
- 1 27.8234223
14 [] 2 items
- 0 89.9524181
- 1 27.6784882
15 [] 2 items
- 0 89.921606
- 1 27.6325032
16 [] 2 items
- 0 89.9024392
- 1 27.4314618
17 [] 2 items
- 0 89.8290871
- 1 27.2745495
18 [] 2 items
- 0 89.8040142
- 1 27.0229333
links [] 7 items
0
- rel "collection"
- href "https://planetarycomputer.microsoft.com/api/stac/v1/collections/sentinel-1-rtc"
- type "application/json"
1
- rel "parent"
- href "https://planetarycomputer.microsoft.com/api/stac/v1/collections/sentinel-1-rtc"
- type "application/json"
2
- rel "root"
- href "https://planetarycomputer.microsoft.com/api/stac/v1"
- type "application/json"
- title "Microsoft Planetary Computer STAC API"
3
- rel "self"
- href "https://planetarycomputer.microsoft.com/api/stac/v1/collections/sentinel-1-rtc/items/S1A_IW_GRDH_1SDV_20210716T000313_20210716T000338_038795_0493DB_rtc"
- type "application/geo+json"
4
- rel "license"
- href "https://sentinel.esa.int/documents/247904/690755/Sentinel_Data_Legal_Notice"
5
- rel "derived_from"
- href "https://planetarycomputer.microsoft.com/api/stac/v1/collections/sentinel-1-grd/items/S1A_IW_GRDH_1SDV_20210716T000313_20210716T000338_038795_0493DB"
- type "application/json"
- title "Sentinel 1 GRD Item"
6
- rel "preview"
- href "https://planetarycomputer.microsoft.com/api/data/v1/item/map?collection=sentinel-1-rtc&item=S1A_IW_GRDH_1SDV_20210716T000313_20210716T000338_038795_0493DB_rtc"
- type "text/html"
- title "Map of item"
assets
vh
- href "https://sentinel1euwestrtc.blob.core.windows.net/sentinel1-grd-rtc/GRD/2021/7/16/IW/DV/S1A_IW_GRDH_1SDV_20210716T000313_20210716T000338_038795_0493DB_D5AF/measurement/iw-vh.rtc.tiff"
- type "image/tiff; application=geotiff; profile=cloud-optimized"
- title "VH: vertical transmit, horizontal receive"
- description "Terrain-corrected gamma naught values of signal transmitted with vertical polarization and received with horizontal polarization with radiometric terrain correction applied."
- file:size 1840030943
- file:checksum "bf1988ead80831e90bd12747b6e20abe"
raster:bands [] 1 items
0
- nodata -32768
- data_type "float32"
- spatial_resolution 10.0
roles [] 1 items
- 0 "data"
vv
- href "https://sentinel1euwestrtc.blob.core.windows.net/sentinel1-grd-rtc/GRD/2021/7/16/IW/DV/S1A_IW_GRDH_1SDV_20210716T000313_20210716T000338_038795_0493DB_D5AF/measurement/iw-vv.rtc.tiff"
- type "image/tiff; application=geotiff; profile=cloud-optimized"
- title "VV: vertical transmit, vertical receive"
- description "Terrain-corrected gamma naught values of signal transmitted with vertical polarization and received with vertical polarization with radiometric terrain correction applied."
- file:size 1848342594
- file:checksum "a1f42a31e13b40abc547d541ecc99106"
raster:bands [] 1 items
0
- nodata -32768
- data_type "float32"
- spatial_resolution 10.0
roles [] 1 items
- 0 "data"
tilejson
- href "https://planetarycomputer.microsoft.com/api/data/v1/item/tilejson.json?collection=sentinel-1-rtc&item=S1A_IW_GRDH_1SDV_20210716T000313_20210716T000338_038795_0493DB_rtc&assets=vv&assets=vh&tile_format=png&expression=0.03+%2B+log+%2810e-4+-+log+%280.05+%2F+%280.02+%2B+2+%2A+vv%29%29%29%3B0.05+%2B+exp+%280.25+%2A+%28log+%280.01+%2B+2+%2A+vv%29+%2B+log+%280.02+%2B+5+%2A+vh%29%29%29%3B1+-+log+%280.05+%2F+%280.045+-+0.9+%2A+vv%29%29&asset_as_band=True&rescale=0%2C.8000&rescale=0%2C1.000&rescale=0%2C1.000&format=png"
- type "application/json"
- title "TileJSON with default rendering"
roles [] 1 items
- 0 "tiles"
rendered_preview
- href "https://planetarycomputer.microsoft.com/api/data/v1/item/preview.png?collection=sentinel-1-rtc&item=S1A_IW_GRDH_1SDV_20210716T000313_20210716T000338_038795_0493DB_rtc&assets=vv&assets=vh&tile_format=png&expression=0.03+%2B+log+%2810e-4+-+log+%280.05+%2F+%280.02+%2B+2+%2A+vv%29%29%29%3B0.05+%2B+exp+%280.25+%2A+%28log+%280.01+%2B+2+%2A+vv%29+%2B+log+%280.02+%2B+5+%2A+vh%29%29%29%3B1+-+log+%280.05+%2F+%280.045+-+0.9+%2A+vv%29%29&asset_as_band=True&rescale=0%2C.8000&rescale=0%2C1.000&rescale=0%2C1.000&format=png"
- type "image/png"
- title "Rendered preview"
- rel "preview"
roles [] 1 items
- 0 "overview"
bbox [] 4 items
- 0 87.30477513
- 1 26.92253836
- 2 90.04964364
- 3 28.84002436
stac_extensions [] 6 items
- 0 "https://stac-extensions.github.io/sar/v1.0.0/schema.json"
- 1 "https://stac-extensions.github.io/sat/v1.0.0/schema.json"
- 2 "https://stac-extensions.github.io/eo/v1.0.0/schema.json"
- 3 "https://stac-extensions.github.io/projection/v1.0.0/schema.json"
- 4 "https://stac-extensions.github.io/file/v2.0.0/schema.json"
- 5 "https://stac-extensions.github.io/raster/v1.1.0/schema.json"
- collection "sentinel-1-rtc"
94
- type "Feature"
- stac_version "1.0.0"
- id "S1A_IW_GRDH_1SDV_20210713T121354_20210713T121419_038759_0492D4_rtc"
properties
- datetime "2021-07-13T12:14:07.266919Z"
- platform "SENTINEL-1A"
s1:shape [] 2 items
- 0 28150
- 1 21599
proj:bbox [] 4 items
- 0 421840.0
- 1 2916210.0
- 2 703340.0
- 3 3132200.0
- proj:epsg 32645
proj:shape [] 2 items
- 0 21599
- 1 28150
- end_datetime "2021-07-13 12:14:19.766644+00:00"
- constellation "Sentinel-1"
- s1:resolution "high"
proj:transform [] 9 items
- 0 10.0
- 1 0.0
- 2 421840.0
- 3 0.0
- 4 -10.0
- 5 3132200.0
- 6 0.0
- 7 0.0
- 8 1.0
- s1:datatake_id "299732"
- start_datetime "2021-07-13 12:13:54.767193+00:00"
- s1:orbit_source "DOWNLINK"
- s1:slice_number "6"
- s1:total_slices "20"
- sar:looks_range 5
- sat:orbit_state "ascending"
- sar:product_type "GRD"
- sar:looks_azimuth 1
sar:polarizations [] 2 items
- 0 "VV"
- 1 "VH"
- sar:frequency_band "C"
- sat:absolute_orbit 38759
- sat:relative_orbit 12
- s1:processing_level "1"
- sar:instrument_mode "IW"
- sar:center_frequency 5.405
- sar:resolution_range 20
- s1:product_timeliness "Fast-24h"
- sar:resolution_azimuth 22
- sar:pixel_spacing_range 10
- sar:observation_direction "right"
- sar:pixel_spacing_azimuth 10
- sar:looks_equivalent_number 4.4
- s1:instrument_configuration_ID "7"
- sat:platform_international_designator "2014-016A"
geometry
- type "Polygon"
coordinates [] 1 items
0 [] 15 items
0 [] 2 items
- 0 86.2062188
- 1 27.8441396
1 [] 2 items
- 0 86.2107711
- 1 27.8816277
2 [] 2 items
- 0 88.7382534
- 1 28.2895165
3 [] 2 items
- 0 88.9225387
- 1 27.3275894
4 [] 2 items
- 0 88.9847693
- 1 26.7768959
5 [] 2 items
- 0 86.4992776
- 1 26.3665057
6 [] 2 items
- 0 86.3555358
- 1 27.1612112
7 [] 2 items
- 0 86.3188747
- 1 27.2314562
8 [] 2 items
- 0 86.3279969
- 1 27.3770291
9 [] 2 items
- 0 86.2777744
- 1 27.4646171
10 [] 2 items
- 0 86.2711753
- 1 27.6976708
11 [] 2 items
- 0 86.2165988
- 1 27.75623
12 [] 2 items
- 0 86.2347879
- 1 27.7816079
13 [] 2 items
- 0 86.2101115
- 1 27.7833647
14 [] 2 items
- 0 86.2062188
- 1 27.8441396
links [] 7 items
0
- rel "collection"
- href "https://planetarycomputer.microsoft.com/api/stac/v1/collections/sentinel-1-rtc"
- type "application/json"
1
- rel "parent"
- href "https://planetarycomputer.microsoft.com/api/stac/v1/collections/sentinel-1-rtc"
- type "application/json"
2
- rel "root"
- href "https://planetarycomputer.microsoft.com/api/stac/v1"
- type "application/json"
- title "Microsoft Planetary Computer STAC API"
3
- rel "self"
- href "https://planetarycomputer.microsoft.com/api/stac/v1/collections/sentinel-1-rtc/items/S1A_IW_GRDH_1SDV_20210713T121354_20210713T121419_038759_0492D4_rtc"
- type "application/geo+json"
4
- rel "license"
- href "https://sentinel.esa.int/documents/247904/690755/Sentinel_Data_Legal_Notice"
5
- rel "derived_from"
- href "https://planetarycomputer.microsoft.com/api/stac/v1/collections/sentinel-1-grd/items/S1A_IW_GRDH_1SDV_20210713T121354_20210713T121419_038759_0492D4"
- type "application/json"
- title "Sentinel 1 GRD Item"
6
- rel "preview"
- href "https://planetarycomputer.microsoft.com/api/data/v1/item/map?collection=sentinel-1-rtc&item=S1A_IW_GRDH_1SDV_20210713T121354_20210713T121419_038759_0492D4_rtc"
- type "text/html"
- title "Map of item"
assets
vh
- href "https://sentinel1euwestrtc.blob.core.windows.net/sentinel1-grd-rtc/GRD/2021/7/13/IW/DV/S1A_IW_GRDH_1SDV_20210713T121354_20210713T121419_038759_0492D4_F4F6/measurement/iw-vh.rtc.tiff"
- type "image/tiff; application=geotiff; profile=cloud-optimized"
- title "VH: vertical transmit, horizontal receive"
- description "Terrain-corrected gamma naught values of signal transmitted with vertical polarization and received with horizontal polarization with radiometric terrain correction applied."
- file:size 1865746386
- file:checksum "b45ffe469526a80df7f15f3cf06d3920"
raster:bands [] 1 items
0
- nodata -32768
- data_type "float32"
- spatial_resolution 10.0
roles [] 1 items
- 0 "data"
vv
- href "https://sentinel1euwestrtc.blob.core.windows.net/sentinel1-grd-rtc/GRD/2021/7/13/IW/DV/S1A_IW_GRDH_1SDV_20210713T121354_20210713T121419_038759_0492D4_F4F6/measurement/iw-vv.rtc.tiff"
- type "image/tiff; application=geotiff; profile=cloud-optimized"
- title "VV: vertical transmit, vertical receive"
- description "Terrain-corrected gamma naught values of signal transmitted with vertical polarization and received with vertical polarization with radiometric terrain correction applied."
- file:size 1875309435
- file:checksum "98702060e657dff744c1f739527efc93"
raster:bands [] 1 items
0
- nodata -32768
- data_type "float32"
- spatial_resolution 10.0
roles [] 1 items
- 0 "data"
tilejson
- href "https://planetarycomputer.microsoft.com/api/data/v1/item/tilejson.json?collection=sentinel-1-rtc&item=S1A_IW_GRDH_1SDV_20210713T121354_20210713T121419_038759_0492D4_rtc&assets=vv&assets=vh&tile_format=png&expression=0.03+%2B+log+%2810e-4+-+log+%280.05+%2F+%280.02+%2B+2+%2A+vv%29%29%29%3B0.05+%2B+exp+%280.25+%2A+%28log+%280.01+%2B+2+%2A+vv%29+%2B+log+%280.02+%2B+5+%2A+vh%29%29%29%3B1+-+log+%280.05+%2F+%280.045+-+0.9+%2A+vv%29%29&asset_as_band=True&rescale=0%2C.8000&rescale=0%2C1.000&rescale=0%2C1.000&format=png"
- type "application/json"
- title "TileJSON with default rendering"
roles [] 1 items
- 0 "tiles"
rendered_preview
- href "https://planetarycomputer.microsoft.com/api/data/v1/item/preview.png?collection=sentinel-1-rtc&item=S1A_IW_GRDH_1SDV_20210713T121354_20210713T121419_038759_0492D4_rtc&assets=vv&assets=vh&tile_format=png&expression=0.03+%2B+log+%2810e-4+-+log+%280.05+%2F+%280.02+%2B+2+%2A+vv%29%29%29%3B0.05+%2B+exp+%280.25+%2A+%28log+%280.01+%2B+2+%2A+vv%29+%2B+log+%280.02+%2B+5+%2A+vh%29%29%29%3B1+-+log+%280.05+%2F+%280.045+-+0.9+%2A+vv%29%29&asset_as_band=True&rescale=0%2C.8000&rescale=0%2C1.000&rescale=0%2C1.000&format=png"
- type "image/png"
- title "Rendered preview"
- rel "preview"
roles [] 1 items
- 0 "overview"
bbox [] 4 items
- 0 86.20621878
- 1 26.36650566
- 2 88.98476934
- 3 28.28951651
stac_extensions [] 6 items
- 0 "https://stac-extensions.github.io/sar/v1.0.0/schema.json"
- 1 "https://stac-extensions.github.io/sat/v1.0.0/schema.json"
- 2 "https://stac-extensions.github.io/eo/v1.0.0/schema.json"
- 3 "https://stac-extensions.github.io/projection/v1.0.0/schema.json"
- 4 "https://stac-extensions.github.io/file/v2.0.0/schema.json"
- 5 "https://stac-extensions.github.io/raster/v1.1.0/schema.json"
- collection "sentinel-1-rtc"
95
- type "Feature"
- stac_version "1.0.0"
- id "S1A_IW_GRDH_1SDV_20210708T120547_20210708T120612_038686_0490AD_rtc"
properties
- datetime "2021-07-08T12:05:59.613554Z"
- platform "SENTINEL-1A"
s1:shape [] 2 items
- 0 28421
- 1 21970
proj:bbox [] 4 items
- 0 618280.0
- 1 2960440.0
- 2 902490.0
- 3 3180140.0
- proj:epsg 32645
proj:shape [] 2 items
- 0 21970
- 1 28421
- end_datetime "2021-07-08 12:06:12.112559+00:00"
- constellation "Sentinel-1"
- s1:resolution "high"
proj:transform [] 9 items
- 0 10.0
- 1 0.0
- 2 618280.0
- 3 0.0
- 4 -10.0
- 5 3180140.0
- 6 0.0
- 7 0.0
- 8 1.0
- s1:datatake_id "299181"
- start_datetime "2021-07-08 12:05:47.114550+00:00"
- s1:orbit_source "DOWNLINK"
- s1:slice_number "6"
- s1:total_slices "21"
- sar:looks_range 5
- sat:orbit_state "ascending"
- sar:product_type "GRD"
- sar:looks_azimuth 1
sar:polarizations [] 2 items
- 0 "VV"
- 1 "VH"
- sar:frequency_band "C"
- sat:absolute_orbit 38686
- sat:relative_orbit 114
- s1:processing_level "1"
- sar:instrument_mode "IW"
- sar:center_frequency 5.405
- sar:resolution_range 20
- s1:product_timeliness "Fast-24h"
- sar:resolution_azimuth 22
- sar:pixel_spacing_range 10
- sar:observation_direction "right"
- sar:pixel_spacing_azimuth 10
- sar:looks_equivalent_number 4.4
- s1:instrument_configuration_ID "7"
- sat:platform_international_designator "2014-016A"
geometry
- type "Polygon"
coordinates [] 1 items
0 [] 14 items
0 [] 2 items
- 0 89.9800153
- 1 27.0120985
1 [] 2 items
- 0 90.9941408
- 1 27.1728225
2 [] 2 items
- 0 90.7254645
- 1 28.6818087
3 [] 2 items
- 0 88.2186013
- 1 28.2798445
4 [] 2 items
- 0 88.3565932
- 1 27.7232721
5 [] 2 items
- 0 88.330769
- 1 27.5843365
6 [] 2 items
- 0 88.3775063
- 1 27.5223208
7 [] 2 items
- 0 88.3592076
- 1 27.4090374
8 [] 2 items
- 0 88.4013847
- 1 27.3368588
9 [] 2 items
- 0 88.3799309
- 1 27.3021393
10 [] 2 items
- 0 88.4168093
- 1 27.2062684
11 [] 2 items
- 0 88.4052516
- 1 27.0894876
12 [] 2 items
- 0 88.4762379
- 1 26.7596838
13 [] 2 items
- 0 89.9800153
- 1 27.0120985
links [] 7 items
0
- rel "collection"
- href "https://planetarycomputer.microsoft.com/api/stac/v1/collections/sentinel-1-rtc"
- type "application/json"
1
- rel "parent"
- href "https://planetarycomputer.microsoft.com/api/stac/v1/collections/sentinel-1-rtc"
- type "application/json"
2
- rel "root"
- href "https://planetarycomputer.microsoft.com/api/stac/v1"
- type "application/json"
- title "Microsoft Planetary Computer STAC API"
3
- rel "self"
- href "https://planetarycomputer.microsoft.com/api/stac/v1/collections/sentinel-1-rtc/items/S1A_IW_GRDH_1SDV_20210708T120547_20210708T120612_038686_0490AD_rtc"
- type "application/geo+json"
4
- rel "license"
- href "https://sentinel.esa.int/documents/247904/690755/Sentinel_Data_Legal_Notice"
5
- rel "derived_from"
- href "https://planetarycomputer.microsoft.com/api/stac/v1/collections/sentinel-1-grd/items/S1A_IW_GRDH_1SDV_20210708T120547_20210708T120612_038686_0490AD"
- type "application/json"
- title "Sentinel 1 GRD Item"
6
- rel "preview"
- href "https://planetarycomputer.microsoft.com/api/data/v1/item/map?collection=sentinel-1-rtc&item=S1A_IW_GRDH_1SDV_20210708T120547_20210708T120612_038686_0490AD_rtc"
- type "text/html"
- title "Map of item"
assets
vh
- href "https://sentinel1euwestrtc.blob.core.windows.net/sentinel1-grd-rtc/GRD/2021/7/8/IW/DV/S1A_IW_GRDH_1SDV_20210708T120547_20210708T120612_038686_0490AD_1560/measurement/iw-vh.rtc.tiff"
- type "image/tiff; application=geotiff; profile=cloud-optimized"
- title "VH: vertical transmit, horizontal receive"
- description "Terrain-corrected gamma naught values of signal transmitted with vertical polarization and received with horizontal polarization with radiometric terrain correction applied."
- file:size 1850256435
- file:checksum "c4f837a30c3504e963a3b47dabd6c752"
raster:bands [] 1 items
0
- nodata -32768
- data_type "float32"
- spatial_resolution 10.0
roles [] 1 items
- 0 "data"
vv
- href "https://sentinel1euwestrtc.blob.core.windows.net/sentinel1-grd-rtc/GRD/2021/7/8/IW/DV/S1A_IW_GRDH_1SDV_20210708T120547_20210708T120612_038686_0490AD_1560/measurement/iw-vv.rtc.tiff"
- type "image/tiff; application=geotiff; profile=cloud-optimized"
- title "VV: vertical transmit, vertical receive"
- description "Terrain-corrected gamma naught values of signal transmitted with vertical polarization and received with vertical polarization with radiometric terrain correction applied."
- file:size 1858557537
- file:checksum "feae8308c196144a7f077b63baef7aa7"
raster:bands [] 1 items
0
- nodata -32768
- data_type "float32"
- spatial_resolution 10.0
roles [] 1 items
- 0 "data"
tilejson
- href "https://planetarycomputer.microsoft.com/api/data/v1/item/tilejson.json?collection=sentinel-1-rtc&item=S1A_IW_GRDH_1SDV_20210708T120547_20210708T120612_038686_0490AD_rtc&assets=vv&assets=vh&tile_format=png&expression=0.03+%2B+log+%2810e-4+-+log+%280.05+%2F+%280.02+%2B+2+%2A+vv%29%29%29%3B0.05+%2B+exp+%280.25+%2A+%28log+%280.01+%2B+2+%2A+vv%29+%2B+log+%280.02+%2B+5+%2A+vh%29%29%29%3B1+-+log+%280.05+%2F+%280.045+-+0.9+%2A+vv%29%29&asset_as_band=True&rescale=0%2C.8000&rescale=0%2C1.000&rescale=0%2C1.000&format=png"
- type "application/json"
- title "TileJSON with default rendering"
roles [] 1 items
- 0 "tiles"
rendered_preview
- href "https://planetarycomputer.microsoft.com/api/data/v1/item/preview.png?collection=sentinel-1-rtc&item=S1A_IW_GRDH_1SDV_20210708T120547_20210708T120612_038686_0490AD_rtc&assets=vv&assets=vh&tile_format=png&expression=0.03+%2B+log+%2810e-4+-+log+%280.05+%2F+%280.02+%2B+2+%2A+vv%29%29%29%3B0.05+%2B+exp+%280.25+%2A+%28log+%280.01+%2B+2+%2A+vv%29+%2B+log+%280.02+%2B+5+%2A+vh%29%29%29%3B1+-+log+%280.05+%2F+%280.045+-+0.9+%2A+vv%29%29&asset_as_band=True&rescale=0%2C.8000&rescale=0%2C1.000&rescale=0%2C1.000&format=png"
- type "image/png"
- title "Rendered preview"
- rel "preview"
roles [] 1 items
- 0 "overview"
bbox [] 4 items
- 0 88.21860134
- 1 26.75968381
- 2 90.99414079
- 3 28.6818087
stac_extensions [] 6 items
- 0 "https://stac-extensions.github.io/sar/v1.0.0/schema.json"
- 1 "https://stac-extensions.github.io/sat/v1.0.0/schema.json"
- 2 "https://stac-extensions.github.io/eo/v1.0.0/schema.json"
- 3 "https://stac-extensions.github.io/projection/v1.0.0/schema.json"
- 4 "https://stac-extensions.github.io/file/v2.0.0/schema.json"
- 5 "https://stac-extensions.github.io/raster/v1.1.0/schema.json"
- collection "sentinel-1-rtc"
96
- type "Feature"
- stac_version "1.0.0"
- id "S1A_IW_GRDH_1SDV_20210704T000312_20210704T000337_038620_048E99_rtc"
properties
- datetime "2021-07-04T00:03:25.347747Z"
- platform "SENTINEL-1A"
s1:shape [] 2 items
- 0 27537
- 1 21083
proj:bbox [] 4 items
- 0 524430.0
- 1 2980840.0
- 2 799800.0
- 3 3191670.0
- proj:epsg 32645
proj:shape [] 2 items
- 0 21083
- 1 27537
- end_datetime "2021-07-04 00:03:37.847082+00:00"
- constellation "Sentinel-1"
- s1:resolution "high"
proj:transform [] 9 items
- 0 10.0
- 1 0.0
- 2 524430.0
- 3 0.0
- 4 -10.0
- 5 3191670.0
- 6 0.0
- 7 0.0
- 8 1.0
- s1:datatake_id "298649"
- start_datetime "2021-07-04 00:03:12.848412+00:00"
- s1:orbit_source "DOWNLINK"
- s1:slice_number "12"
- s1:total_slices "17"
- sar:looks_range 5
- sat:orbit_state "descending"
- sar:product_type "GRD"
- sar:looks_azimuth 1
sar:polarizations [] 2 items
- 0 "VV"
- 1 "VH"
- sar:frequency_band "C"
- sat:absolute_orbit 38620
- sat:relative_orbit 48
- s1:processing_level "1"
- sar:instrument_mode "IW"
- sar:center_frequency 5.405
- sar:resolution_range 20
- s1:product_timeliness "Fast-24h"
- sar:resolution_azimuth 22
- sar:pixel_spacing_range 10
- sar:observation_direction "right"
- sar:pixel_spacing_azimuth 10
- sar:looks_equivalent_number 4.4
- s1:instrument_configuration_ID "7"
- sat:platform_international_designator "2014-016A"
geometry
- type "Polygon"
coordinates [] 1 items
0 [] 19 items
0 [] 2 items
- 0 89.804314
- 1 27.0228371
1 [] 2 items
- 0 89.7772374
- 1 26.9950893
2 [] 2 items
- 0 89.7848705
- 1 26.9226246
3 [] 2 items
- 0 87.304979
- 1 27.3292913
4 [] 2 items
- 0 87.4259974
- 1 28.1942574
5 [] 2 items
- 0 87.5585325
- 1 28.8401146
6 [] 2 items
- 0 90.0497482
- 1 28.4416837
7 [] 2 items
- 0 90.026332
- 1 28.2909889
8 [] 2 items
- 0 89.9733431
- 1 28.1919392
9 [] 2 items
- 0 89.9978804
- 1 28.1481969
10 [] 2 items
- 0 89.9712875
- 1 28.0843713
11 [] 2 items
- 0 89.9877183
- 1 28.0018389
12 [] 2 items
- 0 89.9443454
- 1 27.9503656
13 [] 2 items
- 0 89.9293622
- 1 27.8241242
14 [] 2 items
- 0 89.9526182
- 1 27.6783937
15 [] 2 items
- 0 89.9219193
- 1 27.6328574
16 [] 2 items
- 0 89.9032405
- 1 27.4311745
17 [] 2 items
- 0 89.8292935
- 1 27.2747258
18 [] 2 items
- 0 89.804314
- 1 27.0228371
links [] 7 items
0
- rel "collection"
- href "https://planetarycomputer.microsoft.com/api/stac/v1/collections/sentinel-1-rtc"
- type "application/json"
1
- rel "parent"
- href "https://planetarycomputer.microsoft.com/api/stac/v1/collections/sentinel-1-rtc"
- type "application/json"
2
- rel "root"
- href "https://planetarycomputer.microsoft.com/api/stac/v1"
- type "application/json"
- title "Microsoft Planetary Computer STAC API"
3
- rel "self"
- href "https://planetarycomputer.microsoft.com/api/stac/v1/collections/sentinel-1-rtc/items/S1A_IW_GRDH_1SDV_20210704T000312_20210704T000337_038620_048E99_rtc"
- type "application/geo+json"
4
- rel "license"
- href "https://sentinel.esa.int/documents/247904/690755/Sentinel_Data_Legal_Notice"
5
- rel "derived_from"
- href "https://planetarycomputer.microsoft.com/api/stac/v1/collections/sentinel-1-grd/items/S1A_IW_GRDH_1SDV_20210704T000312_20210704T000337_038620_048E99"
- type "application/json"
- title "Sentinel 1 GRD Item"
6
- rel "preview"
- href "https://planetarycomputer.microsoft.com/api/data/v1/item/map?collection=sentinel-1-rtc&item=S1A_IW_GRDH_1SDV_20210704T000312_20210704T000337_038620_048E99_rtc"
- type "text/html"
- title "Map of item"
assets
vh
- href "https://sentinel1euwestrtc.blob.core.windows.net/sentinel1-grd-rtc/GRD/2021/7/4/IW/DV/S1A_IW_GRDH_1SDV_20210704T000312_20210704T000337_038620_048E99_43E6/measurement/iw-vh.rtc.tiff"
- type "image/tiff; application=geotiff; profile=cloud-optimized"
- title "VH: vertical transmit, horizontal receive"
- description "Terrain-corrected gamma naught values of signal transmitted with vertical polarization and received with horizontal polarization with radiometric terrain correction applied."
- file:size 1838209077
- file:checksum "0036e0eeaf5c838c0043755597fd76ab"
raster:bands [] 1 items
0
- nodata -32768
- data_type "float32"
- spatial_resolution 10.0
roles [] 1 items
- 0 "data"
vv
- href "https://sentinel1euwestrtc.blob.core.windows.net/sentinel1-grd-rtc/GRD/2021/7/4/IW/DV/S1A_IW_GRDH_1SDV_20210704T000312_20210704T000337_038620_048E99_43E6/measurement/iw-vv.rtc.tiff"
- type "image/tiff; application=geotiff; profile=cloud-optimized"
- title "VV: vertical transmit, vertical receive"
- description "Terrain-corrected gamma naught values of signal transmitted with vertical polarization and received with vertical polarization with radiometric terrain correction applied."
- file:size 1846834581
- file:checksum "22349dd14a66ce75eeeb22dbe3435e40"
raster:bands [] 1 items
0
- nodata -32768
- data_type "float32"
- spatial_resolution 10.0
roles [] 1 items
- 0 "data"
tilejson
- href "https://planetarycomputer.microsoft.com/api/data/v1/item/tilejson.json?collection=sentinel-1-rtc&item=S1A_IW_GRDH_1SDV_20210704T000312_20210704T000337_038620_048E99_rtc&assets=vv&assets=vh&tile_format=png&expression=0.03+%2B+log+%2810e-4+-+log+%280.05+%2F+%280.02+%2B+2+%2A+vv%29%29%29%3B0.05+%2B+exp+%280.25+%2A+%28log+%280.01+%2B+2+%2A+vv%29+%2B+log+%280.02+%2B+5+%2A+vh%29%29%29%3B1+-+log+%280.05+%2F+%280.045+-+0.9+%2A+vv%29%29&asset_as_band=True&rescale=0%2C.8000&rescale=0%2C1.000&rescale=0%2C1.000&format=png"
- type "application/json"
- title "TileJSON with default rendering"
roles [] 1 items
- 0 "tiles"
rendered_preview
- href "https://planetarycomputer.microsoft.com/api/data/v1/item/preview.png?collection=sentinel-1-rtc&item=S1A_IW_GRDH_1SDV_20210704T000312_20210704T000337_038620_048E99_rtc&assets=vv&assets=vh&tile_format=png&expression=0.03+%2B+log+%2810e-4+-+log+%280.05+%2F+%280.02+%2B+2+%2A+vv%29%29%29%3B0.05+%2B+exp+%280.25+%2A+%28log+%280.01+%2B+2+%2A+vv%29+%2B+log+%280.02+%2B+5+%2A+vh%29%29%29%3B1+-+log+%280.05+%2F+%280.045+-+0.9+%2A+vv%29%29&asset_as_band=True&rescale=0%2C.8000&rescale=0%2C1.000&rescale=0%2C1.000&format=png"
- type "image/png"
- title "Rendered preview"
- rel "preview"
roles [] 1 items
- 0 "overview"
bbox [] 4 items
- 0 87.30497903
- 1 26.92262457
- 2 90.04974821
- 3 28.84011462
stac_extensions [] 6 items
- 0 "https://stac-extensions.github.io/sar/v1.0.0/schema.json"
- 1 "https://stac-extensions.github.io/sat/v1.0.0/schema.json"
- 2 "https://stac-extensions.github.io/eo/v1.0.0/schema.json"
- 3 "https://stac-extensions.github.io/projection/v1.0.0/schema.json"
- 4 "https://stac-extensions.github.io/file/v2.0.0/schema.json"
- 5 "https://stac-extensions.github.io/raster/v1.1.0/schema.json"
- collection "sentinel-1-rtc"
97
- type "Feature"
- stac_version "1.0.0"
- id "S1A_IW_GRDH_1SDV_20210701T121354_20210701T121419_038584_048D87_rtc"
properties
- datetime "2021-07-01T12:14:06.572473Z"
- platform "SENTINEL-1A"
s1:shape [] 2 items
- 0 28150
- 1 21598
proj:bbox [] 4 items
- 0 421830.0
- 1 2916230.0
- 2 703330.0
- 3 3132210.0
- proj:epsg 32645
proj:shape [] 2 items
- 0 21598
- 1 28150
- end_datetime "2021-07-01 12:14:19.071405+00:00"
- constellation "Sentinel-1"
- s1:resolution "high"
proj:transform [] 9 items
- 0 10.0
- 1 0.0
- 2 421830.0
- 3 0.0
- 4 -10.0
- 5 3132210.0
- 6 0.0
- 7 0.0
- 8 1.0
- s1:datatake_id "298375"
- start_datetime "2021-07-01 12:13:54.073541+00:00"
- s1:orbit_source "DOWNLINK"
- s1:slice_number "6"
- s1:total_slices "20"
- sar:looks_range 5
- sat:orbit_state "ascending"
- sar:product_type "GRD"
- sar:looks_azimuth 1
sar:polarizations [] 2 items
- 0 "VV"
- 1 "VH"
- sar:frequency_band "C"
- sat:absolute_orbit 38584
- sat:relative_orbit 12
- s1:processing_level "1"
- sar:instrument_mode "IW"
- sar:center_frequency 5.405
- sar:resolution_range 20
- s1:product_timeliness "Fast-24h"
- sar:resolution_azimuth 22
- sar:pixel_spacing_range 10
- sar:observation_direction "right"
- sar:pixel_spacing_azimuth 10
- sar:looks_equivalent_number 4.4
- s1:instrument_configuration_ID "7"
- sat:platform_international_designator "2014-016A"
geometry
- type "Polygon"
coordinates [] 1 items
0 [] 15 items
0 [] 2 items
- 0 86.2061166
- 1 27.8442293
1 [] 2 items
- 0 86.2111768
- 1 27.8817203
2 [] 2 items
- 0 88.7381515
- 1 28.2895178
3 [] 2 items
- 0 88.9224392
- 1 27.327681
4 [] 2 items
- 0 88.9846704
- 1 26.7769876
5 [] 2 items
- 0 86.4993774
- 1 26.3665963
6 [] 2 items
- 0 86.3555352
- 1 27.1613015
7 [] 2 items
- 0 86.3188725
- 1 27.2318173
8 [] 2 items
- 0 86.3280981
- 1 27.3770295
9 [] 2 items
- 0 86.2778762
- 1 27.4645274
10 [] 2 items
- 0 86.2712767
- 1 27.6976714
11 [] 2 items
- 0 86.2165981
- 1 27.7563203
12 [] 2 items
- 0 86.2348913
- 1 27.7813376
13 [] 2 items
- 0 86.2102136
- 1 27.783275
14 [] 2 items
- 0 86.2061166
- 1 27.8442293
links [] 7 items
0
- rel "collection"
- href "https://planetarycomputer.microsoft.com/api/stac/v1/collections/sentinel-1-rtc"
- type "application/json"
1
- rel "parent"
- href "https://planetarycomputer.microsoft.com/api/stac/v1/collections/sentinel-1-rtc"
- type "application/json"
2
- rel "root"
- href "https://planetarycomputer.microsoft.com/api/stac/v1"
- type "application/json"
- title "Microsoft Planetary Computer STAC API"
3
- rel "self"
- href "https://planetarycomputer.microsoft.com/api/stac/v1/collections/sentinel-1-rtc/items/S1A_IW_GRDH_1SDV_20210701T121354_20210701T121419_038584_048D87_rtc"
- type "application/geo+json"
4
- rel "license"
- href "https://sentinel.esa.int/documents/247904/690755/Sentinel_Data_Legal_Notice"
5
- rel "derived_from"
- href "https://planetarycomputer.microsoft.com/api/stac/v1/collections/sentinel-1-grd/items/S1A_IW_GRDH_1SDV_20210701T121354_20210701T121419_038584_048D87"
- type "application/json"
- title "Sentinel 1 GRD Item"
6
- rel "preview"
- href "https://planetarycomputer.microsoft.com/api/data/v1/item/map?collection=sentinel-1-rtc&item=S1A_IW_GRDH_1SDV_20210701T121354_20210701T121419_038584_048D87_rtc"
- type "text/html"
- title "Map of item"
assets
vh
- href "https://sentinel1euwestrtc.blob.core.windows.net/sentinel1-grd-rtc/GRD/2021/7/1/IW/DV/S1A_IW_GRDH_1SDV_20210701T121354_20210701T121419_038584_048D87_1EBB/measurement/iw-vh.rtc.tiff"
- type "image/tiff; application=geotiff; profile=cloud-optimized"
- title "VH: vertical transmit, horizontal receive"
- description "Terrain-corrected gamma naught values of signal transmitted with vertical polarization and received with horizontal polarization with radiometric terrain correction applied."
- file:size 1866677367
- file:checksum "889320f3af4af71ae729f904fa35c22f"
raster:bands [] 1 items
0
- nodata -32768
- data_type "float32"
- spatial_resolution 10.0
roles [] 1 items
- 0 "data"
vv
- href "https://sentinel1euwestrtc.blob.core.windows.net/sentinel1-grd-rtc/GRD/2021/7/1/IW/DV/S1A_IW_GRDH_1SDV_20210701T121354_20210701T121419_038584_048D87_1EBB/measurement/iw-vv.rtc.tiff"
- type "image/tiff; application=geotiff; profile=cloud-optimized"
- title "VV: vertical transmit, vertical receive"
- description "Terrain-corrected gamma naught values of signal transmitted with vertical polarization and received with vertical polarization with radiometric terrain correction applied."
- file:size 1876314082
- file:checksum "f3978d8c1ecb65af00647b43a46a0b98"
raster:bands [] 1 items
0
- nodata -32768
- data_type "float32"
- spatial_resolution 10.0
roles [] 1 items
- 0 "data"
tilejson
- href "https://planetarycomputer.microsoft.com/api/data/v1/item/tilejson.json?collection=sentinel-1-rtc&item=S1A_IW_GRDH_1SDV_20210701T121354_20210701T121419_038584_048D87_rtc&assets=vv&assets=vh&tile_format=png&expression=0.03+%2B+log+%2810e-4+-+log+%280.05+%2F+%280.02+%2B+2+%2A+vv%29%29%29%3B0.05+%2B+exp+%280.25+%2A+%28log+%280.01+%2B+2+%2A+vv%29+%2B+log+%280.02+%2B+5+%2A+vh%29%29%29%3B1+-+log+%280.05+%2F+%280.045+-+0.9+%2A+vv%29%29&asset_as_band=True&rescale=0%2C.8000&rescale=0%2C1.000&rescale=0%2C1.000&format=png"
- type "application/json"
- title "TileJSON with default rendering"
roles [] 1 items
- 0 "tiles"
rendered_preview
- href "https://planetarycomputer.microsoft.com/api/data/v1/item/preview.png?collection=sentinel-1-rtc&item=S1A_IW_GRDH_1SDV_20210701T121354_20210701T121419_038584_048D87_rtc&assets=vv&assets=vh&tile_format=png&expression=0.03+%2B+log+%2810e-4+-+log+%280.05+%2F+%280.02+%2B+2+%2A+vv%29%29%29%3B0.05+%2B+exp+%280.25+%2A+%28log+%280.01+%2B+2+%2A+vv%29+%2B+log+%280.02+%2B+5+%2A+vh%29%29%29%3B1+-+log+%280.05+%2F+%280.045+-+0.9+%2A+vv%29%29&asset_as_band=True&rescale=0%2C.8000&rescale=0%2C1.000&rescale=0%2C1.000&format=png"
- type "image/png"
- title "Rendered preview"
- rel "preview"
roles [] 1 items
- 0 "overview"
bbox [] 4 items
- 0 86.20611657
- 1 26.3665963
- 2 88.98467037
- 3 28.28951781
stac_extensions [] 6 items
- 0 "https://stac-extensions.github.io/sar/v1.0.0/schema.json"
- 1 "https://stac-extensions.github.io/sat/v1.0.0/schema.json"
- 2 "https://stac-extensions.github.io/eo/v1.0.0/schema.json"
- 3 "https://stac-extensions.github.io/projection/v1.0.0/schema.json"
- 4 "https://stac-extensions.github.io/file/v2.0.0/schema.json"
- 5 "https://stac-extensions.github.io/raster/v1.1.0/schema.json"
- collection "sentinel-1-rtc"
98
- type "Feature"
- stac_version "1.0.0"
- id "S1A_IW_GRDH_1SDV_20210626T120546_20210626T120611_038511_048B6C_rtc"
properties
- datetime "2021-06-26T12:05:58.982444Z"
- platform "SENTINEL-1A"
s1:shape [] 2 items
- 0 28420
- 1 21971
proj:bbox [] 4 items
- 0 618310.0
- 1 2960450.0
- 2 902510.0
- 3 3180160.0
- proj:epsg 32645
proj:shape [] 2 items
- 0 21971
- 1 28420
- end_datetime "2021-06-26 12:06:11.482149+00:00"
- constellation "Sentinel-1"
- s1:resolution "high"
proj:transform [] 9 items
- 0 10.0
- 1 0.0
- 2 618310.0
- 3 0.0
- 4 -10.0
- 5 3180160.0
- 6 0.0
- 7 0.0
- 8 1.0
- s1:datatake_id "297836"
- start_datetime "2021-06-26 12:05:46.482738+00:00"
- s1:orbit_source "DOWNLINK"
- s1:slice_number "6"
- s1:total_slices "21"
- sar:looks_range 5
- sat:orbit_state "ascending"
- sar:product_type "GRD"
- sar:looks_azimuth 1
sar:polarizations [] 2 items
- 0 "VV"
- 1 "VH"
- sar:frequency_band "C"
- sat:absolute_orbit 38511
- sat:relative_orbit 114
- s1:processing_level "1"
- sar:instrument_mode "IW"
- sar:center_frequency 5.405
- sar:resolution_range 20
- s1:product_timeliness "Fast-24h"
- sar:resolution_azimuth 22
- sar:pixel_spacing_range 10
- sar:observation_direction "right"
- sar:pixel_spacing_azimuth 10
- sar:looks_equivalent_number 4.4
- s1:instrument_configuration_ID "7"
- sat:platform_international_designator "2014-016A"
geometry
- type "Polygon"
coordinates [] 1 items
0 [] 14 items
0 [] 2 items
- 0 89.9811274
- 1 27.0122553
1 [] 2 items
- 0 90.9943422
- 1 27.1728168
2 [] 2 items
- 0 90.7256752
- 1 28.6819832
3 [] 2 items
- 0 88.2189082
- 1 28.279932
4 [] 2 items
- 0 88.3568964
- 1 27.7231789
5 [] 2 items
- 0 88.3309749
- 1 27.5846053
6 [] 2 items
- 0 88.377711
- 1 27.5224993
7 [] 2 items
- 0 88.3595099
- 1 27.4089442
8 [] 2 items
- 0 88.4017855
- 1 27.336584
9 [] 2 items
- 0 88.380033
- 1 27.3022285
10 [] 2 items
- 0 88.4172097
- 1 27.2059935
11 [] 2 items
- 0 88.4055552
- 1 27.0895748
12 [] 2 items
- 0 88.4765395
- 1 26.7596807
13 [] 2 items
- 0 89.9811274
- 1 27.0122553
links [] 7 items
0
- rel "collection"
- href "https://planetarycomputer.microsoft.com/api/stac/v1/collections/sentinel-1-rtc"
- type "application/json"
1
- rel "parent"
- href "https://planetarycomputer.microsoft.com/api/stac/v1/collections/sentinel-1-rtc"
- type "application/json"
2
- rel "root"
- href "https://planetarycomputer.microsoft.com/api/stac/v1"
- type "application/json"
- title "Microsoft Planetary Computer STAC API"
3
- rel "self"
- href "https://planetarycomputer.microsoft.com/api/stac/v1/collections/sentinel-1-rtc/items/S1A_IW_GRDH_1SDV_20210626T120546_20210626T120611_038511_048B6C_rtc"
- type "application/geo+json"
4
- rel "license"
- href "https://sentinel.esa.int/documents/247904/690755/Sentinel_Data_Legal_Notice"
5
- rel "derived_from"
- href "https://planetarycomputer.microsoft.com/api/stac/v1/collections/sentinel-1-grd/items/S1A_IW_GRDH_1SDV_20210626T120546_20210626T120611_038511_048B6C"
- type "application/json"
- title "Sentinel 1 GRD Item"
6
- rel "preview"
- href "https://planetarycomputer.microsoft.com/api/data/v1/item/map?collection=sentinel-1-rtc&item=S1A_IW_GRDH_1SDV_20210626T120546_20210626T120611_038511_048B6C_rtc"
- type "text/html"
- title "Map of item"
assets
vh
- href "https://sentinel1euwestrtc.blob.core.windows.net/sentinel1-grd-rtc/GRD/2021/6/26/IW/DV/S1A_IW_GRDH_1SDV_20210626T120546_20210626T120611_038511_048B6C_65B9/measurement/iw-vh.rtc.tiff"
- type "image/tiff; application=geotiff; profile=cloud-optimized"
- title "VH: vertical transmit, horizontal receive"
- description "Terrain-corrected gamma naught values of signal transmitted with vertical polarization and received with horizontal polarization with radiometric terrain correction applied."
- file:size 1851311121
- file:checksum "b82d6c860dc5ac8ea843f1a97cb6441a"
raster:bands [] 1 items
0
- nodata -32768
- data_type "float32"
- spatial_resolution 10.0
roles [] 1 items
- 0 "data"
vv
- href "https://sentinel1euwestrtc.blob.core.windows.net/sentinel1-grd-rtc/GRD/2021/6/26/IW/DV/S1A_IW_GRDH_1SDV_20210626T120546_20210626T120611_038511_048B6C_65B9/measurement/iw-vv.rtc.tiff"
- type "image/tiff; application=geotiff; profile=cloud-optimized"
- title "VV: vertical transmit, vertical receive"
- description "Terrain-corrected gamma naught values of signal transmitted with vertical polarization and received with vertical polarization with radiometric terrain correction applied."
- file:size 1859184765
- file:checksum "81bfca5f8afc9c06f11b3e4517b230bb"
raster:bands [] 1 items
0
- nodata -32768
- data_type "float32"
- spatial_resolution 10.0
roles [] 1 items
- 0 "data"
tilejson
- href "https://planetarycomputer.microsoft.com/api/data/v1/item/tilejson.json?collection=sentinel-1-rtc&item=S1A_IW_GRDH_1SDV_20210626T120546_20210626T120611_038511_048B6C_rtc&assets=vv&assets=vh&tile_format=png&expression=0.03+%2B+log+%2810e-4+-+log+%280.05+%2F+%280.02+%2B+2+%2A+vv%29%29%29%3B0.05+%2B+exp+%280.25+%2A+%28log+%280.01+%2B+2+%2A+vv%29+%2B+log+%280.02+%2B+5+%2A+vh%29%29%29%3B1+-+log+%280.05+%2F+%280.045+-+0.9+%2A+vv%29%29&asset_as_band=True&rescale=0%2C.8000&rescale=0%2C1.000&rescale=0%2C1.000&format=png"
- type "application/json"
- title "TileJSON with default rendering"
roles [] 1 items
- 0 "tiles"
rendered_preview
- href "https://planetarycomputer.microsoft.com/api/data/v1/item/preview.png?collection=sentinel-1-rtc&item=S1A_IW_GRDH_1SDV_20210626T120546_20210626T120611_038511_048B6C_rtc&assets=vv&assets=vh&tile_format=png&expression=0.03+%2B+log+%2810e-4+-+log+%280.05+%2F+%280.02+%2B+2+%2A+vv%29%29%29%3B0.05+%2B+exp+%280.25+%2A+%28log+%280.01+%2B+2+%2A+vv%29+%2B+log+%280.02+%2B+5+%2A+vh%29%29%29%3B1+-+log+%280.05+%2F+%280.045+-+0.9+%2A+vv%29%29&asset_as_band=True&rescale=0%2C.8000&rescale=0%2C1.000&rescale=0%2C1.000&format=png"
- type "image/png"
- title "Rendered preview"
- rel "preview"
roles [] 1 items
- 0 "overview"
bbox [] 4 items
- 0 88.21890821
- 1 26.75968067
- 2 90.99434219
- 3 28.68198321
stac_extensions [] 6 items
- 0 "https://stac-extensions.github.io/sar/v1.0.0/schema.json"
- 1 "https://stac-extensions.github.io/sat/v1.0.0/schema.json"
- 2 "https://stac-extensions.github.io/eo/v1.0.0/schema.json"
- 3 "https://stac-extensions.github.io/projection/v1.0.0/schema.json"
- 4 "https://stac-extensions.github.io/file/v2.0.0/schema.json"
- 5 "https://stac-extensions.github.io/raster/v1.1.0/schema.json"
- collection "sentinel-1-rtc"
99
- type "Feature"
- stac_version "1.0.0"
- id "S1A_IW_GRDH_1SDV_20210622T000312_20210622T000337_038445_04895A_rtc"
properties
- datetime "2021-06-22T00:03:24.594621Z"
- platform "SENTINEL-1A"
s1:shape [] 2 items
- 0 27538
- 1 21084
proj:bbox [] 4 items
- 0 524380.0
- 1 2980830.0
- 2 799760.0
- 3 3191670.0
- proj:epsg 32645
proj:shape [] 2 items
- 0 21084
- 1 27538
- end_datetime "2021-06-22 00:03:37.093898+00:00"
- constellation "Sentinel-1"
- s1:resolution "high"
proj:transform [] 9 items
- 0 10.0
- 1 0.0
- 2 524380.0
- 3 0.0
- 4 -10.0
- 5 3191670.0
- 6 0.0
- 7 0.0
- 8 1.0
- s1:datatake_id "297306"
- start_datetime "2021-06-22 00:03:12.095344+00:00"
- s1:orbit_source "DOWNLINK"
- s1:slice_number "12"
- s1:total_slices "17"
- sar:looks_range 5
- sat:orbit_state "descending"
- sar:product_type "GRD"
- sar:looks_azimuth 1
sar:polarizations [] 2 items
- 0 "VV"
- 1 "VH"
- sar:frequency_band "C"
- sat:absolute_orbit 38445
- sat:relative_orbit 48
- s1:processing_level "1"
- sar:instrument_mode "IW"
- sar:center_frequency 5.405
- sar:resolution_range 20
- s1:product_timeliness "Fast-24h"
- sar:resolution_azimuth 22
- sar:pixel_spacing_range 10
- sar:observation_direction "right"
- sar:pixel_spacing_azimuth 10
- sar:looks_equivalent_number 4.4
- s1:instrument_configuration_ID "6"
- sat:platform_international_designator "2014-016A"
geometry
- type "Polygon"
coordinates [] 1 items
0 [] 18 items
0 [] 2 items
- 0 89.804764
- 1 27.0652323
1 [] 2 items
- 0 89.7842669
- 1 26.9226365
2 [] 2 items
- 0 87.304573
- 1 27.3286602
3 [] 2 items
- 0 87.4255881
- 1 28.1938073
4 [] 2 items
- 0 87.557815
- 1 28.8401176
5 [] 2 items
- 0 90.0494397
- 1 28.4416004
6 [] 2 items
- 0 90.0258279
- 1 28.2911805
7 [] 2 items
- 0 89.9729311
- 1 28.1917677
8 [] 2 items
- 0 89.9973744
- 1 28.1482981
9 [] 2 items
- 0 89.97098
- 1 28.0842878
10 [] 2 items
- 0 89.9872403
- 1 28.0029317
11 [] 2 items
- 0 89.9439393
- 1 27.9503743
12 [] 2 items
- 0 89.9281259
- 1 27.8234288
13 [] 2 items
- 0 89.9521118
- 1 27.6784045
14 [] 2 items
- 0 89.9212975
- 1 27.6323293
15 [] 2 items
- 0 89.9015415
- 1 27.4319316
16 [] 2 items
- 0 89.8289885
- 1 27.2746417
17 [] 2 items
- 0 89.804764
- 1 27.0652323
links [] 7 items
0
- rel "collection"
- href "https://planetarycomputer.microsoft.com/api/stac/v1/collections/sentinel-1-rtc"
- type "application/json"
1
- rel "parent"
- href "https://planetarycomputer.microsoft.com/api/stac/v1/collections/sentinel-1-rtc"
- type "application/json"
2
- rel "root"
- href "https://planetarycomputer.microsoft.com/api/stac/v1"
- type "application/json"
- title "Microsoft Planetary Computer STAC API"
3
- rel "self"
- href "https://planetarycomputer.microsoft.com/api/stac/v1/collections/sentinel-1-rtc/items/S1A_IW_GRDH_1SDV_20210622T000312_20210622T000337_038445_04895A_rtc"
- type "application/geo+json"
4
- rel "license"
- href "https://sentinel.esa.int/documents/247904/690755/Sentinel_Data_Legal_Notice"
5
- rel "derived_from"
- href "https://planetarycomputer.microsoft.com/api/stac/v1/collections/sentinel-1-grd/items/S1A_IW_GRDH_1SDV_20210622T000312_20210622T000337_038445_04895A"
- type "application/json"
- title "Sentinel 1 GRD Item"
6
- rel "preview"
- href "https://planetarycomputer.microsoft.com/api/data/v1/item/map?collection=sentinel-1-rtc&item=S1A_IW_GRDH_1SDV_20210622T000312_20210622T000337_038445_04895A_rtc"
- type "text/html"
- title "Map of item"
assets
vh
- href "https://sentinel1euwestrtc.blob.core.windows.net/sentinel1-grd-rtc/GRD/2021/6/22/IW/DV/S1A_IW_GRDH_1SDV_20210622T000312_20210622T000337_038445_04895A_5DA4/measurement/iw-vh.rtc.tiff"
- type "image/tiff; application=geotiff; profile=cloud-optimized"
- title "VH: vertical transmit, horizontal receive"
- description "Terrain-corrected gamma naught values of signal transmitted with vertical polarization and received with horizontal polarization with radiometric terrain correction applied."
- file:size 1840705741
- file:checksum "2b125f8aa43c4904d69da9562a4474ed"
raster:bands [] 1 items
0
- nodata -32768
- data_type "float32"
- spatial_resolution 10.0
roles [] 1 items
- 0 "data"
vv
- href "https://sentinel1euwestrtc.blob.core.windows.net/sentinel1-grd-rtc/GRD/2021/6/22/IW/DV/S1A_IW_GRDH_1SDV_20210622T000312_20210622T000337_038445_04895A_5DA4/measurement/iw-vv.rtc.tiff"
- type "image/tiff; application=geotiff; profile=cloud-optimized"
- title "VV: vertical transmit, vertical receive"
- description "Terrain-corrected gamma naught values of signal transmitted with vertical polarization and received with vertical polarization with radiometric terrain correction applied."
- file:size 1848037975
- file:checksum "bf12dbd35a278927b8e1a0fa88e6cf08"
raster:bands [] 1 items
0
- nodata -32768
- data_type "float32"
- spatial_resolution 10.0
roles [] 1 items
- 0 "data"
tilejson
- href "https://planetarycomputer.microsoft.com/api/data/v1/item/tilejson.json?collection=sentinel-1-rtc&item=S1A_IW_GRDH_1SDV_20210622T000312_20210622T000337_038445_04895A_rtc&assets=vv&assets=vh&tile_format=png&expression=0.03+%2B+log+%2810e-4+-+log+%280.05+%2F+%280.02+%2B+2+%2A+vv%29%29%29%3B0.05+%2B+exp+%280.25+%2A+%28log+%280.01+%2B+2+%2A+vv%29+%2B+log+%280.02+%2B+5+%2A+vh%29%29%29%3B1+-+log+%280.05+%2F+%280.045+-+0.9+%2A+vv%29%29&asset_as_band=True&rescale=0%2C.8000&rescale=0%2C1.000&rescale=0%2C1.000&format=png"
- type "application/json"
- title "TileJSON with default rendering"
roles [] 1 items
- 0 "tiles"
rendered_preview
- href "https://planetarycomputer.microsoft.com/api/data/v1/item/preview.png?collection=sentinel-1-rtc&item=S1A_IW_GRDH_1SDV_20210622T000312_20210622T000337_038445_04895A_rtc&assets=vv&assets=vh&tile_format=png&expression=0.03+%2B+log+%2810e-4+-+log+%280.05+%2F+%280.02+%2B+2+%2A+vv%29%29%29%3B0.05+%2B+exp+%280.25+%2A+%28log+%280.01+%2B+2+%2A+vv%29+%2B+log+%280.02+%2B+5+%2A+vh%29%29%29%3B1+-+log+%280.05+%2F+%280.045+-+0.9+%2A+vv%29%29&asset_as_band=True&rescale=0%2C.8000&rescale=0%2C1.000&rescale=0%2C1.000&format=png"
- type "image/png"
- title "Rendered preview"
- rel "preview"
roles [] 1 items
- 0 "overview"
bbox [] 4 items
- 0 87.30457296
- 1 26.92263649
- 2 90.04943968
- 3 28.84011759
stac_extensions [] 6 items
- 0 "https://stac-extensions.github.io/sar/v1.0.0/schema.json"
- 1 "https://stac-extensions.github.io/sat/v1.0.0/schema.json"
- 2 "https://stac-extensions.github.io/eo/v1.0.0/schema.json"
- 3 "https://stac-extensions.github.io/projection/v1.0.0/schema.json"
- 4 "https://stac-extensions.github.io/file/v2.0.0/schema.json"
- 5 "https://stac-extensions.github.io/raster/v1.1.0/schema.json"
- collection "sentinel-1-rtc"
100
- type "Feature"
- stac_version "1.0.0"
- id "S1A_IW_GRDH_1SDV_20210619T121353_20210619T121418_038409_04884C_rtc"
properties
- datetime "2021-06-19T12:14:05.865662Z"
- platform "SENTINEL-1A"
s1:shape [] 2 items
- 0 28147
- 1 21599
proj:bbox [] 4 items
- 0 421800.0
- 1 2916210.0
- 2 703270.0
- 3 3132200.0
- proj:epsg 32645
proj:shape [] 2 items
- 0 21599
- 1 28147
- end_datetime "2021-06-19 12:14:18.365410+00:00"
- constellation "Sentinel-1"
- s1:resolution "high"
proj:transform [] 9 items
- 0 10.0
- 1 0.0
- 2 421800.0
- 3 0.0
- 4 -10.0
- 5 3132200.0
- 6 0.0
- 7 0.0
- 8 1.0
- s1:datatake_id "297036"
- start_datetime "2021-06-19 12:13:53.365914+00:00"
- s1:orbit_source "DOWNLINK"
- s1:slice_number "6"
- s1:total_slices "20"
- sar:looks_range 5
- sat:orbit_state "ascending"
- sar:product_type "GRD"
- sar:looks_azimuth 1
sar:polarizations [] 2 items
- 0 "VV"
- 1 "VH"
- sar:frequency_band "C"
- sat:absolute_orbit 38409
- sat:relative_orbit 12
- s1:processing_level "1"
- sar:instrument_mode "IW"
- sar:center_frequency 5.405
- sar:resolution_range 20
- s1:product_timeliness "Fast-24h"
- sar:resolution_azimuth 22
- sar:pixel_spacing_range 10
- sar:observation_direction "right"
- sar:pixel_spacing_azimuth 10
- sar:looks_equivalent_number 4.4
- s1:instrument_configuration_ID "6"
- sat:platform_international_designator "2014-016A"
geometry
- type "Polygon"
coordinates [] 1 items
0 [] 15 items
0 [] 2 items
- 0 86.2058139
- 1 27.8439567
1 [] 2 items
- 0 86.2104664
- 1 27.881626
2 [] 2 items
- 0 88.7374365
- 1 28.2894367
3 [] 2 items
- 0 88.922133
- 1 27.3275047
4 [] 2 items
- 0 88.9841646
- 1 26.7768141
5 [] 2 items
- 0 86.4986766
- 1 26.3664133
6 [] 2 items
- 0 86.3549302
- 1 27.1612084
7 [] 2 items
- 0 86.3181661
- 1 27.2317236
8 [] 2 items
- 0 86.326585
- 1 27.3763903
9 [] 2 items
- 0 86.2770684
- 1 27.4642523
10 [] 2 items
- 0 86.2703657
- 1 27.6973958
11 [] 2 items
- 0 86.2158885
- 1 27.756226
12 [] 2 items
- 0 86.2343832
- 1 27.7814251
13 [] 2 items
- 0 86.2096112
- 1 27.7823689
14 [] 2 items
- 0 86.2058139
- 1 27.8439567
links [] 7 items
0
- rel "collection"
- href "https://planetarycomputer.microsoft.com/api/stac/v1/collections/sentinel-1-rtc"
- type "application/json"
1
- rel "parent"
- href "https://planetarycomputer.microsoft.com/api/stac/v1/collections/sentinel-1-rtc"
- type "application/json"
2
- rel "root"
- href "https://planetarycomputer.microsoft.com/api/stac/v1"
- type "application/json"
- title "Microsoft Planetary Computer STAC API"
3
- rel "self"
- href "https://planetarycomputer.microsoft.com/api/stac/v1/collections/sentinel-1-rtc/items/S1A_IW_GRDH_1SDV_20210619T121353_20210619T121418_038409_04884C_rtc"
- type "application/geo+json"
4
- rel "license"
- href "https://sentinel.esa.int/documents/247904/690755/Sentinel_Data_Legal_Notice"
5
- rel "derived_from"
- href "https://planetarycomputer.microsoft.com/api/stac/v1/collections/sentinel-1-grd/items/S1A_IW_GRDH_1SDV_20210619T121353_20210619T121418_038409_04884C"
- type "application/json"
- title "Sentinel 1 GRD Item"
6
- rel "preview"
- href "https://planetarycomputer.microsoft.com/api/data/v1/item/map?collection=sentinel-1-rtc&item=S1A_IW_GRDH_1SDV_20210619T121353_20210619T121418_038409_04884C_rtc"
- type "text/html"
- title "Map of item"
assets
vh
- href "https://sentinel1euwestrtc.blob.core.windows.net/sentinel1-grd-rtc/GRD/2021/6/19/IW/DV/S1A_IW_GRDH_1SDV_20210619T121353_20210619T121418_038409_04884C_9CDE/measurement/iw-vh.rtc.tiff"
- type "image/tiff; application=geotiff; profile=cloud-optimized"
- title "VH: vertical transmit, horizontal receive"
- description "Terrain-corrected gamma naught values of signal transmitted with vertical polarization and received with horizontal polarization with radiometric terrain correction applied."
- file:size 1862410918
- file:checksum "c5103e6b371b903e1ed9ceb79fea3128"
raster:bands [] 1 items
0
- nodata -32768
- data_type "float32"
- spatial_resolution 10.0
roles [] 1 items
- 0 "data"
vv
- href "https://sentinel1euwestrtc.blob.core.windows.net/sentinel1-grd-rtc/GRD/2021/6/19/IW/DV/S1A_IW_GRDH_1SDV_20210619T121353_20210619T121418_038409_04884C_9CDE/measurement/iw-vv.rtc.tiff"
- type "image/tiff; application=geotiff; profile=cloud-optimized"
- title "VV: vertical transmit, vertical receive"
- description "Terrain-corrected gamma naught values of signal transmitted with vertical polarization and received with vertical polarization with radiometric terrain correction applied."
- file:size 1872031535
- file:checksum "6aec364b490644e199334a7a156cc0b0"
raster:bands [] 1 items
0
- nodata -32768
- data_type "float32"
- spatial_resolution 10.0
roles [] 1 items
- 0 "data"
tilejson
- href "https://planetarycomputer.microsoft.com/api/data/v1/item/tilejson.json?collection=sentinel-1-rtc&item=S1A_IW_GRDH_1SDV_20210619T121353_20210619T121418_038409_04884C_rtc&assets=vv&assets=vh&tile_format=png&expression=0.03+%2B+log+%2810e-4+-+log+%280.05+%2F+%280.02+%2B+2+%2A+vv%29%29%29%3B0.05+%2B+exp+%280.25+%2A+%28log+%280.01+%2B+2+%2A+vv%29+%2B+log+%280.02+%2B+5+%2A+vh%29%29%29%3B1+-+log+%280.05+%2F+%280.045+-+0.9+%2A+vv%29%29&asset_as_band=True&rescale=0%2C.8000&rescale=0%2C1.000&rescale=0%2C1.000&format=png"
- type "application/json"
- title "TileJSON with default rendering"
roles [] 1 items
- 0 "tiles"
rendered_preview
- href "https://planetarycomputer.microsoft.com/api/data/v1/item/preview.png?collection=sentinel-1-rtc&item=S1A_IW_GRDH_1SDV_20210619T121353_20210619T121418_038409_04884C_rtc&assets=vv&assets=vh&tile_format=png&expression=0.03+%2B+log+%2810e-4+-+log+%280.05+%2F+%280.02+%2B+2+%2A+vv%29%29%29%3B0.05+%2B+exp+%280.25+%2A+%28log+%280.01+%2B+2+%2A+vv%29+%2B+log+%280.02+%2B+5+%2A+vh%29%29%29%3B1+-+log+%280.05+%2F+%280.045+-+0.9+%2A+vv%29%29&asset_as_band=True&rescale=0%2C.8000&rescale=0%2C1.000&rescale=0%2C1.000&format=png"
- type "image/png"
- title "Rendered preview"
- rel "preview"
roles [] 1 items
- 0 "overview"
bbox [] 4 items
- 0 86.20581389
- 1 26.36641327
- 2 88.98416457
- 3 28.28943666
stac_extensions [] 6 items
- 0 "https://stac-extensions.github.io/sar/v1.0.0/schema.json"
- 1 "https://stac-extensions.github.io/sat/v1.0.0/schema.json"
- 2 "https://stac-extensions.github.io/eo/v1.0.0/schema.json"
- 3 "https://stac-extensions.github.io/projection/v1.0.0/schema.json"
- 4 "https://stac-extensions.github.io/file/v2.0.0/schema.json"
- 5 "https://stac-extensions.github.io/raster/v1.1.0/schema.json"
- collection "sentinel-1-rtc"
101
- type "Feature"
- stac_version "1.0.0"
- id "S1A_IW_GRDH_1SDV_20210614T120545_20210614T120610_038336_04862F_rtc"
properties
- datetime "2021-06-14T12:05:58.373830Z"
- platform "SENTINEL-1A"
s1:shape [] 2 items
- 0 28425
- 1 21970
proj:bbox [] 4 items
- 0 618170.0
- 1 2960440.0
- 2 902420.0
- 3 3180140.0
- proj:epsg 32645
proj:shape [] 2 items
- 0 21970
- 1 28425
- end_datetime "2021-06-14 12:06:10.872859+00:00"
- constellation "Sentinel-1"
- s1:resolution "high"
proj:transform [] 9 items
- 0 10.0
- 1 0.0
- 2 618170.0
- 3 0.0
- 4 -10.0
- 5 3180140.0
- 6 0.0
- 7 0.0
- 8 1.0
- s1:datatake_id "296495"
- start_datetime "2021-06-14 12:05:45.874802+00:00"
- s1:orbit_source "DOWNLINK"
- s1:slice_number "6"
- s1:total_slices "21"
- sar:looks_range 5
- sat:orbit_state "ascending"
- sar:product_type "GRD"
- sar:looks_azimuth 1
sar:polarizations [] 2 items
- 0 "VV"
- 1 "VH"
- sar:frequency_band "C"
- sat:absolute_orbit 38336
- sat:relative_orbit 114
- s1:processing_level "1"
- sar:instrument_mode "IW"
- sar:center_frequency 5.405
- sar:resolution_range 20
- s1:product_timeliness "Fast-24h"
- sar:resolution_azimuth 22
- sar:pixel_spacing_range 10
- sar:observation_direction "right"
- sar:pixel_spacing_azimuth 10
- sar:looks_equivalent_number 4.4
- s1:instrument_configuration_ID "6"
- sat:platform_international_designator "2014-016A"
geometry
- type "Polygon"
coordinates [] 1 items
0 [] 14 items
0 [] 2 items
- 0 89.9816378
- 1 27.0125152
1 [] 2 items
- 0 90.9934359
- 1 27.1728426
2 [] 2 items
- 0 90.7245453
- 1 28.681834
3 [] 2 items
- 0 88.2174789
- 1 28.2797643
4 [] 2 items
- 0 88.3547666
- 1 27.7231997
5 [] 2 items
- 0 88.3296548
- 1 27.5843472
6 [] 2 items
- 0 88.3761869
- 1 27.522063
7 [] 2 items
- 0 88.3578918
- 1 27.40896
8 [] 2 items
- 0 88.4001685
- 1 27.3366002
9 [] 2 items
- 0 88.3790305
- 1 27.3028703
10 [] 2 items
- 0 88.4160063
- 1 27.2066376
11 [] 2 items
- 0 88.4040392
- 1 27.0893192
12 [] 2 items
- 0 88.4751307
- 1 26.7596051
13 [] 2 items
- 0 89.9816378
- 1 27.0125152
links [] 7 items
0
- rel "collection"
- href "https://planetarycomputer.microsoft.com/api/stac/v1/collections/sentinel-1-rtc"
- type "application/json"
1
- rel "parent"
- href "https://planetarycomputer.microsoft.com/api/stac/v1/collections/sentinel-1-rtc"
- type "application/json"
2
- rel "root"
- href "https://planetarycomputer.microsoft.com/api/stac/v1"
- type "application/json"
- title "Microsoft Planetary Computer STAC API"
3
- rel "self"
- href "https://planetarycomputer.microsoft.com/api/stac/v1/collections/sentinel-1-rtc/items/S1A_IW_GRDH_1SDV_20210614T120545_20210614T120610_038336_04862F_rtc"
- type "application/geo+json"
4
- rel "license"
- href "https://sentinel.esa.int/documents/247904/690755/Sentinel_Data_Legal_Notice"
5
- rel "derived_from"
- href "https://planetarycomputer.microsoft.com/api/stac/v1/collections/sentinel-1-grd/items/S1A_IW_GRDH_1SDV_20210614T120545_20210614T120610_038336_04862F"
- type "application/json"
- title "Sentinel 1 GRD Item"
6
- rel "preview"
- href "https://planetarycomputer.microsoft.com/api/data/v1/item/map?collection=sentinel-1-rtc&item=S1A_IW_GRDH_1SDV_20210614T120545_20210614T120610_038336_04862F_rtc"
- type "text/html"
- title "Map of item"
assets
vh
- href "https://sentinel1euwestrtc.blob.core.windows.net/sentinel1-grd-rtc/GRD/2021/6/14/IW/DV/S1A_IW_GRDH_1SDV_20210614T120545_20210614T120610_038336_04862F_72A7/measurement/iw-vh.rtc.tiff"
- type "image/tiff; application=geotiff; profile=cloud-optimized"
- title "VH: vertical transmit, horizontal receive"
- description "Terrain-corrected gamma naught values of signal transmitted with vertical polarization and received with horizontal polarization with radiometric terrain correction applied."
- file:size 1849869905
- file:checksum "9096824f8bccbf42172788b36d2ddd87"
raster:bands [] 1 items
0
- nodata -32768
- data_type "float32"
- spatial_resolution 10.0
roles [] 1 items
- 0 "data"
vv
- href "https://sentinel1euwestrtc.blob.core.windows.net/sentinel1-grd-rtc/GRD/2021/6/14/IW/DV/S1A_IW_GRDH_1SDV_20210614T120545_20210614T120610_038336_04862F_72A7/measurement/iw-vv.rtc.tiff"
- type "image/tiff; application=geotiff; profile=cloud-optimized"
- title "VV: vertical transmit, vertical receive"
- description "Terrain-corrected gamma naught values of signal transmitted with vertical polarization and received with vertical polarization with radiometric terrain correction applied."
- file:size 1858333551
- file:checksum "9d9c0437a9e671247144be198054a379"
raster:bands [] 1 items
0
- nodata -32768
- data_type "float32"
- spatial_resolution 10.0
roles [] 1 items
- 0 "data"
tilejson
- href "https://planetarycomputer.microsoft.com/api/data/v1/item/tilejson.json?collection=sentinel-1-rtc&item=S1A_IW_GRDH_1SDV_20210614T120545_20210614T120610_038336_04862F_rtc&assets=vv&assets=vh&tile_format=png&expression=0.03+%2B+log+%2810e-4+-+log+%280.05+%2F+%280.02+%2B+2+%2A+vv%29%29%29%3B0.05+%2B+exp+%280.25+%2A+%28log+%280.01+%2B+2+%2A+vv%29+%2B+log+%280.02+%2B+5+%2A+vh%29%29%29%3B1+-+log+%280.05+%2F+%280.045+-+0.9+%2A+vv%29%29&asset_as_band=True&rescale=0%2C.8000&rescale=0%2C1.000&rescale=0%2C1.000&format=png"
- type "application/json"
- title "TileJSON with default rendering"
roles [] 1 items
- 0 "tiles"
rendered_preview
- href "https://planetarycomputer.microsoft.com/api/data/v1/item/preview.png?collection=sentinel-1-rtc&item=S1A_IW_GRDH_1SDV_20210614T120545_20210614T120610_038336_04862F_rtc&assets=vv&assets=vh&tile_format=png&expression=0.03+%2B+log+%2810e-4+-+log+%280.05+%2F+%280.02+%2B+2+%2A+vv%29%29%29%3B0.05+%2B+exp+%280.25+%2A+%28log+%280.01+%2B+2+%2A+vv%29+%2B+log+%280.02+%2B+5+%2A+vh%29%29%29%3B1+-+log+%280.05+%2F+%280.045+-+0.9+%2A+vv%29%29&asset_as_band=True&rescale=0%2C.8000&rescale=0%2C1.000&rescale=0%2C1.000&format=png"
- type "image/png"
- title "Rendered preview"
- rel "preview"
roles [] 1 items
- 0 "overview"
bbox [] 4 items
- 0 88.21747889
- 1 26.75960507
- 2 90.99343589
- 3 28.68183403
stac_extensions [] 6 items
- 0 "https://stac-extensions.github.io/sar/v1.0.0/schema.json"
- 1 "https://stac-extensions.github.io/sat/v1.0.0/schema.json"
- 2 "https://stac-extensions.github.io/eo/v1.0.0/schema.json"
- 3 "https://stac-extensions.github.io/projection/v1.0.0/schema.json"
- 4 "https://stac-extensions.github.io/file/v2.0.0/schema.json"
- 5 "https://stac-extensions.github.io/raster/v1.1.0/schema.json"
- collection "sentinel-1-rtc"
102
- type "Feature"
- stac_version "1.0.0"
- id "S1A_IW_GRDH_1SDV_20210610T000311_20210610T000336_038270_04841E_rtc"
properties
- datetime "2021-06-10T00:03:23.870450Z"
- platform "SENTINEL-1A"
s1:shape [] 2 items
- 0 27538
- 1 21083
proj:bbox [] 4 items
- 0 524400.0
- 1 2980840.0
- 2 799780.0
- 3 3191670.0
- proj:epsg 32645
proj:shape [] 2 items
- 0 21083
- 1 27538
- end_datetime "2021-06-10 00:03:36.369821+00:00"
- constellation "Sentinel-1"
- s1:resolution "high"
proj:transform [] 9 items
- 0 10.0
- 1 0.0
- 2 524400.0
- 3 0.0
- 4 -10.0
- 5 3191670.0
- 6 0.0
- 7 0.0
- 8 1.0
- s1:datatake_id "295966"
- start_datetime "2021-06-10 00:03:11.371078+00:00"
- s1:orbit_source "DOWNLINK"
- s1:slice_number "12"
- s1:total_slices "17"
- sar:looks_range 5
- sat:orbit_state "descending"
- sar:product_type "GRD"
- sar:looks_azimuth 1
sar:polarizations [] 2 items
- 0 "VV"
- 1 "VH"
- sar:frequency_band "C"
- sat:absolute_orbit 38270
- sat:relative_orbit 48
- s1:processing_level "1"
- sar:instrument_mode "IW"
- sar:center_frequency 5.405
- sar:resolution_range 20
- s1:product_timeliness "Fast-24h"
- sar:resolution_azimuth 22
- sar:pixel_spacing_range 10
- sar:observation_direction "right"
- sar:pixel_spacing_azimuth 10
- sar:looks_equivalent_number 4.4
- s1:instrument_configuration_ID "6"
- sat:platform_international_designator "2014-016A"
geometry
- type "Polygon"
coordinates [] 1 items
0 [] 19 items
0 [] 2 items
- 0 89.8042156
- 1 27.0229293
1 [] 2 items
- 0 89.7770383
- 1 26.9951834
2 [] 2 items
- 0 89.7848705
- 1 26.9226246
3 [] 2 items
- 0 87.3048787
- 1 27.3295623
4 [] 2 items
- 0 87.4258955
- 1 28.1942577
5 [] 2 items
- 0 87.5585325
- 1 28.8401146
6 [] 2 items
- 0 90.0497482
- 1 28.4416837
7 [] 2 items
- 0 90.0262378
- 1 28.2912616
8 [] 2 items
- 0 89.9732389
- 1 28.1918512
9 [] 2 items
- 0 89.9977787
- 1 28.1481991
10 [] 2 items
- 0 89.9711858
- 1 28.0843735
11 [] 2 items
- 0 89.9875152
- 1 28.0018433
12 [] 2 items
- 0 89.9442464
- 1 27.9504579
13 [] 2 items
- 0 89.9291497
- 1 27.8237679
14 [] 2 items
- 0 89.9525194
- 1 27.678486
15 [] 2 items
- 0 89.9217072
- 1 27.6325011
16 [] 2 items
- 0 89.9030408
- 1 27.4312689
17 [] 2 items
- 0 89.8291903
- 1 27.2746376
18 [] 2 items
- 0 89.8042156
- 1 27.0229293
links [] 7 items
0
- rel "collection"
- href "https://planetarycomputer.microsoft.com/api/stac/v1/collections/sentinel-1-rtc"
- type "application/json"
1
- rel "parent"
- href "https://planetarycomputer.microsoft.com/api/stac/v1/collections/sentinel-1-rtc"
- type "application/json"
2
- rel "root"
- href "https://planetarycomputer.microsoft.com/api/stac/v1"
- type "application/json"
- title "Microsoft Planetary Computer STAC API"
3
- rel "self"
- href "https://planetarycomputer.microsoft.com/api/stac/v1/collections/sentinel-1-rtc/items/S1A_IW_GRDH_1SDV_20210610T000311_20210610T000336_038270_04841E_rtc"
- type "application/geo+json"
4
- rel "license"
- href "https://sentinel.esa.int/documents/247904/690755/Sentinel_Data_Legal_Notice"
5
- rel "derived_from"
- href "https://planetarycomputer.microsoft.com/api/stac/v1/collections/sentinel-1-grd/items/S1A_IW_GRDH_1SDV_20210610T000311_20210610T000336_038270_04841E"
- type "application/json"
- title "Sentinel 1 GRD Item"
6
- rel "preview"
- href "https://planetarycomputer.microsoft.com/api/data/v1/item/map?collection=sentinel-1-rtc&item=S1A_IW_GRDH_1SDV_20210610T000311_20210610T000336_038270_04841E_rtc"
- type "text/html"
- title "Map of item"
assets
vh
- href "https://sentinel1euwestrtc.blob.core.windows.net/sentinel1-grd-rtc/GRD/2021/6/10/IW/DV/S1A_IW_GRDH_1SDV_20210610T000311_20210610T000336_038270_04841E_3FA6/measurement/iw-vh.rtc.tiff"
- type "image/tiff; application=geotiff; profile=cloud-optimized"
- title "VH: vertical transmit, horizontal receive"
- description "Terrain-corrected gamma naught values of signal transmitted with vertical polarization and received with horizontal polarization with radiometric terrain correction applied."
- file:size 1840290420
- file:checksum "e5730aa51e4b026514360c13ee17a584"
raster:bands [] 1 items
0
- nodata -32768
- data_type "float32"
- spatial_resolution 10.0
roles [] 1 items
- 0 "data"
vv
- href "https://sentinel1euwestrtc.blob.core.windows.net/sentinel1-grd-rtc/GRD/2021/6/10/IW/DV/S1A_IW_GRDH_1SDV_20210610T000311_20210610T000336_038270_04841E_3FA6/measurement/iw-vv.rtc.tiff"
- type "image/tiff; application=geotiff; profile=cloud-optimized"
- title "VV: vertical transmit, vertical receive"
- description "Terrain-corrected gamma naught values of signal transmitted with vertical polarization and received with vertical polarization with radiometric terrain correction applied."
- file:size 1847644659
- file:checksum "41689411ff4fb41e2006846f825dccaa"
raster:bands [] 1 items
0
- nodata -32768
- data_type "float32"
- spatial_resolution 10.0
roles [] 1 items
- 0 "data"
tilejson
- href "https://planetarycomputer.microsoft.com/api/data/v1/item/tilejson.json?collection=sentinel-1-rtc&item=S1A_IW_GRDH_1SDV_20210610T000311_20210610T000336_038270_04841E_rtc&assets=vv&assets=vh&tile_format=png&expression=0.03+%2B+log+%2810e-4+-+log+%280.05+%2F+%280.02+%2B+2+%2A+vv%29%29%29%3B0.05+%2B+exp+%280.25+%2A+%28log+%280.01+%2B+2+%2A+vv%29+%2B+log+%280.02+%2B+5+%2A+vh%29%29%29%3B1+-+log+%280.05+%2F+%280.045+-+0.9+%2A+vv%29%29&asset_as_band=True&rescale=0%2C.8000&rescale=0%2C1.000&rescale=0%2C1.000&format=png"
- type "application/json"
- title "TileJSON with default rendering"
roles [] 1 items
- 0 "tiles"
rendered_preview
- href "https://planetarycomputer.microsoft.com/api/data/v1/item/preview.png?collection=sentinel-1-rtc&item=S1A_IW_GRDH_1SDV_20210610T000311_20210610T000336_038270_04841E_rtc&assets=vv&assets=vh&tile_format=png&expression=0.03+%2B+log+%2810e-4+-+log+%280.05+%2F+%280.02+%2B+2+%2A+vv%29%29%29%3B0.05+%2B+exp+%280.25+%2A+%28log+%280.01+%2B+2+%2A+vv%29+%2B+log+%280.02+%2B+5+%2A+vh%29%29%29%3B1+-+log+%280.05+%2F+%280.045+-+0.9+%2A+vv%29%29&asset_as_band=True&rescale=0%2C.8000&rescale=0%2C1.000&rescale=0%2C1.000&format=png"
- type "image/png"
- title "Rendered preview"
- rel "preview"
roles [] 1 items
- 0 "overview"
bbox [] 4 items
- 0 87.30487868
- 1 26.92262457
- 2 90.04974821
- 3 28.84011462
stac_extensions [] 6 items
- 0 "https://stac-extensions.github.io/sar/v1.0.0/schema.json"
- 1 "https://stac-extensions.github.io/sat/v1.0.0/schema.json"
- 2 "https://stac-extensions.github.io/eo/v1.0.0/schema.json"
- 3 "https://stac-extensions.github.io/projection/v1.0.0/schema.json"
- 4 "https://stac-extensions.github.io/file/v2.0.0/schema.json"
- 5 "https://stac-extensions.github.io/raster/v1.1.0/schema.json"
- collection "sentinel-1-rtc"
103
- type "Feature"
- stac_version "1.0.0"
- id "S1A_IW_GRDH_1SDV_20210607T121352_20210607T121417_038234_048318_rtc"
properties
- datetime "2021-06-07T12:14:05.058343Z"
- platform "SENTINEL-1A"
s1:shape [] 2 items
- 0 28151
- 1 21598
proj:bbox [] 4 items
- 0 421840.0
- 1 2916230.0
- 2 703350.0
- 3 3132210.0
- proj:epsg 32645
proj:shape [] 2 items
- 0 21598
- 1 28151
- end_datetime "2021-06-07 12:14:17.557268+00:00"
- constellation "Sentinel-1"
- s1:resolution "high"
proj:transform [] 9 items
- 0 10.0
- 1 0.0
- 2 421840.0
- 3 0.0
- 4 -10.0
- 5 3132210.0
- 6 0.0
- 7 0.0
- 8 1.0
- s1:datatake_id "295704"
- start_datetime "2021-06-07 12:13:52.559418+00:00"
- s1:orbit_source "DOWNLINK"
- s1:slice_number "6"
- s1:total_slices "20"
- sar:looks_range 5
- sat:orbit_state "ascending"
- sar:product_type "GRD"
- sar:looks_azimuth 1
sar:polarizations [] 2 items
- 0 "VV"
- 1 "VH"
- sar:frequency_band "C"
- sat:absolute_orbit 38234
- sat:relative_orbit 12
- s1:processing_level "1"
- sar:instrument_mode "IW"
- sar:center_frequency 5.405
- sar:resolution_range 20
- s1:product_timeliness "Fast-24h"
- sar:resolution_azimuth 22
- sar:pixel_spacing_range 10
- sar:observation_direction "right"
- sar:pixel_spacing_azimuth 10
- sar:looks_equivalent_number 4.4
- s1:instrument_configuration_ID "6"
- sat:platform_international_designator "2014-016A"
geometry
- type "Polygon"
coordinates [] 1 items
0 [] 15 items
0 [] 2 items
- 0 86.2062181
- 1 27.8442299
1 [] 2 items
- 0 86.2112784
- 1 27.8817209
2 [] 2 items
- 0 88.7383553
- 1 28.2895152
3 [] 2 items
- 0 88.9225387
- 1 27.3275894
4 [] 2 items
- 0 88.9847709
- 1 26.7769861
5 [] 2 items
- 0 86.4993774
- 1 26.3665963
6 [] 2 items
- 0 86.3556367
- 1 27.1612117
7 [] 2 items
- 0 86.3189746
- 1 27.2316372
8 [] 2 items
- 0 86.3284014
- 1 27.377031
9 [] 2 items
- 0 86.2779768
- 1 27.4646182
10 [] 2 items
- 0 86.2713781
- 1 27.6976719
11 [] 2 items
- 0 86.216803
- 1 27.7560506
12 [] 2 items
- 0 86.23489
- 1 27.7815182
13 [] 2 items
- 0 86.2103145
- 1 27.7833659
14 [] 2 items
- 0 86.2062181
- 1 27.8442299
links [] 7 items
0
- rel "collection"
- href "https://planetarycomputer.microsoft.com/api/stac/v1/collections/sentinel-1-rtc"
- type "application/json"
1
- rel "parent"
- href "https://planetarycomputer.microsoft.com/api/stac/v1/collections/sentinel-1-rtc"
- type "application/json"
2
- rel "root"
- href "https://planetarycomputer.microsoft.com/api/stac/v1"
- type "application/json"
- title "Microsoft Planetary Computer STAC API"
3
- rel "self"
- href "https://planetarycomputer.microsoft.com/api/stac/v1/collections/sentinel-1-rtc/items/S1A_IW_GRDH_1SDV_20210607T121352_20210607T121417_038234_048318_rtc"
- type "application/geo+json"
4
- rel "license"
- href "https://sentinel.esa.int/documents/247904/690755/Sentinel_Data_Legal_Notice"
5
- rel "derived_from"
- href "https://planetarycomputer.microsoft.com/api/stac/v1/collections/sentinel-1-grd/items/S1A_IW_GRDH_1SDV_20210607T121352_20210607T121417_038234_048318"
- type "application/json"
- title "Sentinel 1 GRD Item"
6
- rel "preview"
- href "https://planetarycomputer.microsoft.com/api/data/v1/item/map?collection=sentinel-1-rtc&item=S1A_IW_GRDH_1SDV_20210607T121352_20210607T121417_038234_048318_rtc"
- type "text/html"
- title "Map of item"
assets
vh
- href "https://sentinel1euwestrtc.blob.core.windows.net/sentinel1-grd-rtc/GRD/2021/6/7/IW/DV/S1A_IW_GRDH_1SDV_20210607T121352_20210607T121417_038234_048318_0FB2/measurement/iw-vh.rtc.tiff"
- type "image/tiff; application=geotiff; profile=cloud-optimized"
- title "VH: vertical transmit, horizontal receive"
- description "Terrain-corrected gamma naught values of signal transmitted with vertical polarization and received with horizontal polarization with radiometric terrain correction applied."
- file:size 1864517000
- file:checksum "655c7919cd5d3f53cbabef16d08de6ae"
raster:bands [] 1 items
0
- nodata -32768
- data_type "float32"
- spatial_resolution 10.0
roles [] 1 items
- 0 "data"
vv
- href "https://sentinel1euwestrtc.blob.core.windows.net/sentinel1-grd-rtc/GRD/2021/6/7/IW/DV/S1A_IW_GRDH_1SDV_20210607T121352_20210607T121417_038234_048318_0FB2/measurement/iw-vv.rtc.tiff"
- type "image/tiff; application=geotiff; profile=cloud-optimized"
- title "VV: vertical transmit, vertical receive"
- description "Terrain-corrected gamma naught values of signal transmitted with vertical polarization and received with vertical polarization with radiometric terrain correction applied."
- file:size 1872823263
- file:checksum "dbbfd6dac633e82eabdbac5ac9a68551"
raster:bands [] 1 items
0
- nodata -32768
- data_type "float32"
- spatial_resolution 10.0
roles [] 1 items
- 0 "data"
tilejson
- href "https://planetarycomputer.microsoft.com/api/data/v1/item/tilejson.json?collection=sentinel-1-rtc&item=S1A_IW_GRDH_1SDV_20210607T121352_20210607T121417_038234_048318_rtc&assets=vv&assets=vh&tile_format=png&expression=0.03+%2B+log+%2810e-4+-+log+%280.05+%2F+%280.02+%2B+2+%2A+vv%29%29%29%3B0.05+%2B+exp+%280.25+%2A+%28log+%280.01+%2B+2+%2A+vv%29+%2B+log+%280.02+%2B+5+%2A+vh%29%29%29%3B1+-+log+%280.05+%2F+%280.045+-+0.9+%2A+vv%29%29&asset_as_band=True&rescale=0%2C.8000&rescale=0%2C1.000&rescale=0%2C1.000&format=png"
- type "application/json"
- title "TileJSON with default rendering"
roles [] 1 items
- 0 "tiles"
rendered_preview
- href "https://planetarycomputer.microsoft.com/api/data/v1/item/preview.png?collection=sentinel-1-rtc&item=S1A_IW_GRDH_1SDV_20210607T121352_20210607T121417_038234_048318_rtc&assets=vv&assets=vh&tile_format=png&expression=0.03+%2B+log+%2810e-4+-+log+%280.05+%2F+%280.02+%2B+2+%2A+vv%29%29%29%3B0.05+%2B+exp+%280.25+%2A+%28log+%280.01+%2B+2+%2A+vv%29+%2B+log+%280.02+%2B+5+%2A+vh%29%29%29%3B1+-+log+%280.05+%2F+%280.045+-+0.9+%2A+vv%29%29&asset_as_band=True&rescale=0%2C.8000&rescale=0%2C1.000&rescale=0%2C1.000&format=png"
- type "image/png"
- title "Rendered preview"
- rel "preview"
roles [] 1 items
- 0 "overview"
bbox [] 4 items
- 0 86.20621812
- 1 26.3665963
- 2 88.98477091
- 3 28.28951521
stac_extensions [] 6 items
- 0 "https://stac-extensions.github.io/sar/v1.0.0/schema.json"
- 1 "https://stac-extensions.github.io/sat/v1.0.0/schema.json"
- 2 "https://stac-extensions.github.io/eo/v1.0.0/schema.json"
- 3 "https://stac-extensions.github.io/projection/v1.0.0/schema.json"
- 4 "https://stac-extensions.github.io/file/v2.0.0/schema.json"
- 5 "https://stac-extensions.github.io/raster/v1.1.0/schema.json"
- collection "sentinel-1-rtc"
104
- type "Feature"
- stac_version "1.0.0"
- id "S1A_IW_GRDH_1SDV_20210602T120544_20210602T120609_038161_0480FD_rtc"
properties
- datetime "2021-06-02T12:05:57.441074Z"
- platform "SENTINEL-1A"
s1:shape [] 2 items
- 0 28422
- 1 21971
proj:bbox [] 4 items
- 0 618250.0
- 1 2960440.0
- 2 902470.0
- 3 3180150.0
- proj:epsg 32645
proj:shape [] 2 items
- 0 21971
- 1 28422
- end_datetime "2021-06-02 12:06:09.940813+00:00"
- constellation "Sentinel-1"
- s1:resolution "high"
proj:transform [] 9 items
- 0 10.0
- 1 0.0
- 2 618250.0
- 3 0.0
- 4 -10.0
- 5 3180150.0
- 6 0.0
- 7 0.0
- 8 1.0
- s1:datatake_id "295165"
- start_datetime "2021-06-02 12:05:44.941334+00:00"
- s1:orbit_source "DOWNLINK"
- s1:slice_number "6"
- s1:total_slices "21"
- sar:looks_range 5
- sat:orbit_state "ascending"
- sar:product_type "GRD"
- sar:looks_azimuth 1
sar:polarizations [] 2 items
- 0 "VV"
- 1 "VH"
- sar:frequency_band "C"
- sat:absolute_orbit 38161
- sat:relative_orbit 114
- s1:processing_level "1"
- sar:instrument_mode "IW"
- sar:center_frequency 5.405
- sar:resolution_range 20
- s1:product_timeliness "Fast-24h"
- sar:resolution_azimuth 22
- sar:pixel_spacing_range 10
- sar:observation_direction "right"
- sar:pixel_spacing_azimuth 10
- sar:looks_equivalent_number 4.4
- s1:instrument_configuration_ID "6"
- sat:platform_international_designator "2014-016A"
geometry
- type "Polygon"
coordinates [] 1 items
0 [] 14 items
0 [] 2 items
- 0 89.9803197
- 1 27.0121822
1 [] 2 items
- 0 90.9939394
- 1 27.1728283
2 [] 2 items
- 0 90.7251613
- 1 28.6819072
3 [] 2 items
- 0 88.2182955
- 1 28.2798472
4 [] 2 items
- 0 88.3561865
- 1 27.7231858
5 [] 2 items
- 0 88.3304652
- 1 27.5843394
6 [] 2 items
- 0 88.3771025
- 1 27.522415
7 [] 2 items
- 0 88.3589031
- 1 27.4089501
8 [] 2 items
- 0 88.4010803
- 1 27.3367716
9 [] 2 items
- 0 88.3797288
- 1 27.3021413
10 [] 2 items
- 0 88.4165076
- 1 27.2063617
11 [] 2 items
- 0 88.4049479
- 1 27.0894004
12 [] 2 items
- 0 88.4758345
- 1 26.7595977
13 [] 2 items
- 0 89.9803197
- 1 27.0121822
links [] 7 items
0
- rel "collection"
- href "https://planetarycomputer.microsoft.com/api/stac/v1/collections/sentinel-1-rtc"
- type "application/json"
1
- rel "parent"
- href "https://planetarycomputer.microsoft.com/api/stac/v1/collections/sentinel-1-rtc"
- type "application/json"
2
- rel "root"
- href "https://planetarycomputer.microsoft.com/api/stac/v1"
- type "application/json"
- title "Microsoft Planetary Computer STAC API"
3
- rel "self"
- href "https://planetarycomputer.microsoft.com/api/stac/v1/collections/sentinel-1-rtc/items/S1A_IW_GRDH_1SDV_20210602T120544_20210602T120609_038161_0480FD_rtc"
- type "application/geo+json"
4
- rel "license"
- href "https://sentinel.esa.int/documents/247904/690755/Sentinel_Data_Legal_Notice"
5
- rel "derived_from"
- href "https://planetarycomputer.microsoft.com/api/stac/v1/collections/sentinel-1-grd/items/S1A_IW_GRDH_1SDV_20210602T120544_20210602T120609_038161_0480FD"
- type "application/json"
- title "Sentinel 1 GRD Item"
6
- rel "preview"
- href "https://planetarycomputer.microsoft.com/api/data/v1/item/map?collection=sentinel-1-rtc&item=S1A_IW_GRDH_1SDV_20210602T120544_20210602T120609_038161_0480FD_rtc"
- type "text/html"
- title "Map of item"
assets
vh
- href "https://sentinel1euwestrtc.blob.core.windows.net/sentinel1-grd-rtc/GRD/2021/6/2/IW/DV/S1A_IW_GRDH_1SDV_20210602T120544_20210602T120609_038161_0480FD_CA56/measurement/iw-vh.rtc.tiff"
- type "image/tiff; application=geotiff; profile=cloud-optimized"
- title "VH: vertical transmit, horizontal receive"
- description "Terrain-corrected gamma naught values of signal transmitted with vertical polarization and received with horizontal polarization with radiometric terrain correction applied."
- file:size 1850358920
- file:checksum "684c4f0b5633fecffbd859ab4f3da347"
raster:bands [] 1 items
0
- nodata -32768
- data_type "float32"
- spatial_resolution 10.0
roles [] 1 items
- 0 "data"
vv
- href "https://sentinel1euwestrtc.blob.core.windows.net/sentinel1-grd-rtc/GRD/2021/6/2/IW/DV/S1A_IW_GRDH_1SDV_20210602T120544_20210602T120609_038161_0480FD_CA56/measurement/iw-vv.rtc.tiff"
- type "image/tiff; application=geotiff; profile=cloud-optimized"
- title "VV: vertical transmit, vertical receive"
- description "Terrain-corrected gamma naught values of signal transmitted with vertical polarization and received with vertical polarization with radiometric terrain correction applied."
- file:size 1858726594
- file:checksum "f388e4486f437a599c3b899042a3d9f6"
raster:bands [] 1 items
0
- nodata -32768
- data_type "float32"
- spatial_resolution 10.0
roles [] 1 items
- 0 "data"
tilejson
- href "https://planetarycomputer.microsoft.com/api/data/v1/item/tilejson.json?collection=sentinel-1-rtc&item=S1A_IW_GRDH_1SDV_20210602T120544_20210602T120609_038161_0480FD_rtc&assets=vv&assets=vh&tile_format=png&expression=0.03+%2B+log+%2810e-4+-+log+%280.05+%2F+%280.02+%2B+2+%2A+vv%29%29%29%3B0.05+%2B+exp+%280.25+%2A+%28log+%280.01+%2B+2+%2A+vv%29+%2B+log+%280.02+%2B+5+%2A+vh%29%29%29%3B1+-+log+%280.05+%2F+%280.045+-+0.9+%2A+vv%29%29&asset_as_band=True&rescale=0%2C.8000&rescale=0%2C1.000&rescale=0%2C1.000&format=png"
- type "application/json"
- title "TileJSON with default rendering"
roles [] 1 items
- 0 "tiles"
rendered_preview
- href "https://planetarycomputer.microsoft.com/api/data/v1/item/preview.png?collection=sentinel-1-rtc&item=S1A_IW_GRDH_1SDV_20210602T120544_20210602T120609_038161_0480FD_rtc&assets=vv&assets=vh&tile_format=png&expression=0.03+%2B+log+%2810e-4+-+log+%280.05+%2F+%280.02+%2B+2+%2A+vv%29%29%29%3B0.05+%2B+exp+%280.25+%2A+%28log+%280.01+%2B+2+%2A+vv%29+%2B+log+%280.02+%2B+5+%2A+vh%29%29%29%3B1+-+log+%280.05+%2F+%280.045+-+0.9+%2A+vv%29%29&asset_as_band=True&rescale=0%2C.8000&rescale=0%2C1.000&rescale=0%2C1.000&format=png"
- type "image/png"
- title "Rendered preview"
- rel "preview"
roles [] 1 items
- 0 "overview"
bbox [] 4 items
- 0 88.2182955
- 1 26.75959774
- 2 90.99393939
- 3 28.68190721
stac_extensions [] 6 items
- 0 "https://stac-extensions.github.io/sar/v1.0.0/schema.json"
- 1 "https://stac-extensions.github.io/sat/v1.0.0/schema.json"
- 2 "https://stac-extensions.github.io/eo/v1.0.0/schema.json"
- 3 "https://stac-extensions.github.io/projection/v1.0.0/schema.json"
- 4 "https://stac-extensions.github.io/file/v2.0.0/schema.json"
- 5 "https://stac-extensions.github.io/raster/v1.1.0/schema.json"
- collection "sentinel-1-rtc"
105
- type "Feature"
- stac_version "1.0.0"
- id "S1A_IW_GRDH_1SDV_20210529T000310_20210529T000335_038095_047EF4_rtc"
properties
- datetime "2021-05-29T00:03:23.152330Z"
- platform "SENTINEL-1A"
s1:shape [] 2 items
- 0 27537
- 1 21083
proj:bbox [] 4 items
- 0 524420.0
- 1 2980840.0
- 2 799790.0
- 3 3191670.0
- proj:epsg 32645
proj:shape [] 2 items
- 0 21083
- 1 27537
- end_datetime "2021-05-29 00:03:35.651693+00:00"
- constellation "Sentinel-1"
- s1:resolution "high"
proj:transform [] 9 items
- 0 10.0
- 1 0.0
- 2 524420.0
- 3 0.0
- 4 -10.0
- 5 3191670.0
- 6 0.0
- 7 0.0
- 8 1.0
- s1:datatake_id "294644"
- start_datetime "2021-05-29 00:03:10.652966+00:00"
- s1:orbit_source "DOWNLINK"
- s1:slice_number "12"
- s1:total_slices "17"
- sar:looks_range 5
- sat:orbit_state "descending"
- sar:product_type "GRD"
- sar:looks_azimuth 1
sar:polarizations [] 2 items
- 0 "VV"
- 1 "VH"
- sar:frequency_band "C"
- sat:absolute_orbit 38095
- sat:relative_orbit 48
- s1:processing_level "1"
- sar:instrument_mode "IW"
- sar:center_frequency 5.405
- sar:resolution_range 20
- s1:product_timeliness "Fast-24h"
- sar:resolution_azimuth 22
- sar:pixel_spacing_range 10
- sar:observation_direction "right"
- sar:pixel_spacing_azimuth 10
- sar:looks_equivalent_number 4.4
- s1:instrument_configuration_ID "6"
- sat:platform_international_designator "2014-016A"
geometry
- type "Polygon"
coordinates [] 1 items
0 [] 19 items
0 [] 2 items
- 0 89.8044147
- 1 27.0228351
1 [] 2 items
- 0 89.7773358
- 1 26.9949971
2 [] 2 items
- 0 89.7846715
- 1 26.9227187
3 [] 2 items
- 0 87.3049793
- 1 27.3293816
4 [] 2 items
- 0 87.4259967
- 1 28.1940769
5 [] 2 items
- 0 87.55884
- 1 28.8401133
6 [] 2 items
- 0 90.0498502
- 1 28.4416814
7 [] 2 items
- 0 90.0264415
- 1 28.2912571
8 [] 2 items
- 0 89.9733406
- 1 28.191849
9 [] 2 items
- 0 89.9978829
- 1 28.148287
10 [] 2 items
- 0 89.9712875
- 1 28.0843713
11 [] 2 items
- 0 89.9877158
- 1 28.0017487
12 [] 2 items
- 0 89.9444494
- 1 27.9504536
13 [] 2 items
- 0 89.9294684
- 1 27.8243024
14 [] 2 items
- 0 89.9526158
- 1 27.6783035
15 [] 2 items
- 0 89.9219145
- 1 27.6326771
16 [] 2 items
- 0 89.9033415
- 1 27.4311724
17 [] 2 items
- 0 89.8292912
- 1 27.2746356
18 [] 2 items
- 0 89.8044147
- 1 27.0228351
links [] 7 items
0
- rel "collection"
- href "https://planetarycomputer.microsoft.com/api/stac/v1/collections/sentinel-1-rtc"
- type "application/json"
1
- rel "parent"
- href "https://planetarycomputer.microsoft.com/api/stac/v1/collections/sentinel-1-rtc"
- type "application/json"
2
- rel "root"
- href "https://planetarycomputer.microsoft.com/api/stac/v1"
- type "application/json"
- title "Microsoft Planetary Computer STAC API"
3
- rel "self"
- href "https://planetarycomputer.microsoft.com/api/stac/v1/collections/sentinel-1-rtc/items/S1A_IW_GRDH_1SDV_20210529T000310_20210529T000335_038095_047EF4_rtc"
- type "application/geo+json"
4
- rel "license"
- href "https://sentinel.esa.int/documents/247904/690755/Sentinel_Data_Legal_Notice"
5
- rel "derived_from"
- href "https://planetarycomputer.microsoft.com/api/stac/v1/collections/sentinel-1-grd/items/S1A_IW_GRDH_1SDV_20210529T000310_20210529T000335_038095_047EF4"
- type "application/json"
- title "Sentinel 1 GRD Item"
6
- rel "preview"
- href "https://planetarycomputer.microsoft.com/api/data/v1/item/map?collection=sentinel-1-rtc&item=S1A_IW_GRDH_1SDV_20210529T000310_20210529T000335_038095_047EF4_rtc"
- type "text/html"
- title "Map of item"
assets
vh
- href "https://sentinel1euwestrtc.blob.core.windows.net/sentinel1-grd-rtc/GRD/2021/5/29/IW/DV/S1A_IW_GRDH_1SDV_20210529T000310_20210529T000335_038095_047EF4_E47A/measurement/iw-vh.rtc.tiff"
- type "image/tiff; application=geotiff; profile=cloud-optimized"
- title "VH: vertical transmit, horizontal receive"
- description "Terrain-corrected gamma naught values of signal transmitted with vertical polarization and received with horizontal polarization with radiometric terrain correction applied."
- file:size 1839290925
- file:checksum "6bc0534ddea95367b8af5fdf5c4ef645"
raster:bands [] 1 items
0
- nodata -32768
- data_type "float32"
- spatial_resolution 10.0
roles [] 1 items
- 0 "data"
vv
- href "https://sentinel1euwestrtc.blob.core.windows.net/sentinel1-grd-rtc/GRD/2021/5/29/IW/DV/S1A_IW_GRDH_1SDV_20210529T000310_20210529T000335_038095_047EF4_E47A/measurement/iw-vv.rtc.tiff"
- type "image/tiff; application=geotiff; profile=cloud-optimized"
- title "VV: vertical transmit, vertical receive"
- description "Terrain-corrected gamma naught values of signal transmitted with vertical polarization and received with vertical polarization with radiometric terrain correction applied."
- file:size 1847418243
- file:checksum "77f4f9d73931649b14b98fb252d493d8"
raster:bands [] 1 items
0
- nodata -32768
- data_type "float32"
- spatial_resolution 10.0
roles [] 1 items
- 0 "data"
tilejson
- href "https://planetarycomputer.microsoft.com/api/data/v1/item/tilejson.json?collection=sentinel-1-rtc&item=S1A_IW_GRDH_1SDV_20210529T000310_20210529T000335_038095_047EF4_rtc&assets=vv&assets=vh&tile_format=png&expression=0.03+%2B+log+%2810e-4+-+log+%280.05+%2F+%280.02+%2B+2+%2A+vv%29%29%29%3B0.05+%2B+exp+%280.25+%2A+%28log+%280.01+%2B+2+%2A+vv%29+%2B+log+%280.02+%2B+5+%2A+vh%29%29%29%3B1+-+log+%280.05+%2F+%280.045+-+0.9+%2A+vv%29%29&asset_as_band=True&rescale=0%2C.8000&rescale=0%2C1.000&rescale=0%2C1.000&format=png"
- type "application/json"
- title "TileJSON with default rendering"
roles [] 1 items
- 0 "tiles"
rendered_preview
- href "https://planetarycomputer.microsoft.com/api/data/v1/item/preview.png?collection=sentinel-1-rtc&item=S1A_IW_GRDH_1SDV_20210529T000310_20210529T000335_038095_047EF4_rtc&assets=vv&assets=vh&tile_format=png&expression=0.03+%2B+log+%2810e-4+-+log+%280.05+%2F+%280.02+%2B+2+%2A+vv%29%29%29%3B0.05+%2B+exp+%280.25+%2A+%28log+%280.01+%2B+2+%2A+vv%29+%2B+log+%280.02+%2B+5+%2A+vh%29%29%29%3B1+-+log+%280.05+%2F+%280.045+-+0.9+%2A+vv%29%29&asset_as_band=True&rescale=0%2C.8000&rescale=0%2C1.000&rescale=0%2C1.000&format=png"
- type "image/png"
- title "Rendered preview"
- rel "preview"
roles [] 1 items
- 0 "overview"
bbox [] 4 items
- 0 87.30497928
- 1 26.92271872
- 2 90.04985019
- 3 28.84011335
stac_extensions [] 6 items
- 0 "https://stac-extensions.github.io/sar/v1.0.0/schema.json"
- 1 "https://stac-extensions.github.io/sat/v1.0.0/schema.json"
- 2 "https://stac-extensions.github.io/eo/v1.0.0/schema.json"
- 3 "https://stac-extensions.github.io/projection/v1.0.0/schema.json"
- 4 "https://stac-extensions.github.io/file/v2.0.0/schema.json"
- 5 "https://stac-extensions.github.io/raster/v1.1.0/schema.json"
- collection "sentinel-1-rtc"
106
- type "Feature"
- stac_version "1.0.0"
- id "S1A_IW_GRDH_1SDV_20210526T121351_20210526T121416_038059_047DE5_rtc"
properties
- datetime "2021-05-26T12:14:04.351880Z"
- platform "SENTINEL-1A"
s1:shape [] 2 items
- 0 28151
- 1 21598
proj:bbox [] 4 items
- 0 421860.0
- 1 2916220.0
- 2 703370.0
- 3 3132200.0
- proj:epsg 32645
proj:shape [] 2 items
- 0 21598
- 1 28151
- end_datetime "2021-05-26 12:14:16.850793+00:00"
- constellation "Sentinel-1"
- s1:resolution "high"
proj:transform [] 9 items
- 0 10.0
- 1 0.0
- 2 421860.0
- 3 0.0
- 4 -10.0
- 5 3132200.0
- 6 0.0
- 7 0.0
- 8 1.0
- s1:datatake_id "294373"
- start_datetime "2021-05-26 12:13:51.852966+00:00"
- s1:orbit_source "DOWNLINK"
- s1:slice_number "6"
- s1:total_slices "20"
- sar:looks_range 5
- sat:orbit_state "ascending"
- sar:product_type "GRD"
- sar:looks_azimuth 1
sar:polarizations [] 2 items
- 0 "VV"
- 1 "VH"
- sar:frequency_band "C"
- sat:absolute_orbit 38059
- sat:relative_orbit 12
- s1:processing_level "1"
- sar:instrument_mode "IW"
- sar:center_frequency 5.405
- sar:resolution_range 20
- s1:product_timeliness "Fast-24h"
- sar:resolution_azimuth 22
- sar:pixel_spacing_range 10
- sar:observation_direction "right"
- sar:pixel_spacing_azimuth 10
- sar:looks_equivalent_number 4.4
- s1:instrument_configuration_ID "6"
- sat:platform_international_designator "2014-016A"
geometry
- type "Polygon"
coordinates [] 1 items
0 [] 15 items
0 [] 2 items
- 0 86.2064206
- 1 27.8443213
1 [] 2 items
- 0 86.2113806
- 1 27.8816312
2 [] 2 items
- 0 88.7387616
- 1 28.2894198
3 [] 2 items
- 0 88.922747
- 1 27.3279475
4 [] 2 items
- 0 88.9850709
- 1 26.7768917
5 [] 2 items
- 0 86.4997784
- 1 26.3665977
6 [] 2 items
- 0 86.3727328
- 1 27.081932
7 [] 2 items
- 0 86.3191733
- 1 27.2321799
8 [] 2 items
- 0 86.3288054
- 1 27.3771232
9 [] 2 items
- 0 86.2788871
- 1 27.4647132
10 [] 2 items
- 0 86.2716817
- 1 27.6977638
11 [] 2 items
- 0 86.2172102
- 1 27.7558724
12 [] 2 items
- 0 86.2350924
- 1 27.7816096
13 [] 2 items
- 0 86.2105142
- 1 27.7838184
14 [] 2 items
- 0 86.2064206
- 1 27.8443213
links [] 7 items
0
- rel "collection"
- href "https://planetarycomputer.microsoft.com/api/stac/v1/collections/sentinel-1-rtc"
- type "application/json"
1
- rel "parent"
- href "https://planetarycomputer.microsoft.com/api/stac/v1/collections/sentinel-1-rtc"
- type "application/json"
2
- rel "root"
- href "https://planetarycomputer.microsoft.com/api/stac/v1"
- type "application/json"
- title "Microsoft Planetary Computer STAC API"
3
- rel "self"
- href "https://planetarycomputer.microsoft.com/api/stac/v1/collections/sentinel-1-rtc/items/S1A_IW_GRDH_1SDV_20210526T121351_20210526T121416_038059_047DE5_rtc"
- type "application/geo+json"
4
- rel "license"
- href "https://sentinel.esa.int/documents/247904/690755/Sentinel_Data_Legal_Notice"
5
- rel "derived_from"
- href "https://planetarycomputer.microsoft.com/api/stac/v1/collections/sentinel-1-grd/items/S1A_IW_GRDH_1SDV_20210526T121351_20210526T121416_038059_047DE5"
- type "application/json"
- title "Sentinel 1 GRD Item"
6
- rel "preview"
- href "https://planetarycomputer.microsoft.com/api/data/v1/item/map?collection=sentinel-1-rtc&item=S1A_IW_GRDH_1SDV_20210526T121351_20210526T121416_038059_047DE5_rtc"
- type "text/html"
- title "Map of item"
assets
vh
- href "https://sentinel1euwestrtc.blob.core.windows.net/sentinel1-grd-rtc/GRD/2021/5/26/IW/DV/S1A_IW_GRDH_1SDV_20210526T121351_20210526T121416_038059_047DE5_C35A/measurement/iw-vh.rtc.tiff"
- type "image/tiff; application=geotiff; profile=cloud-optimized"
- title "VH: vertical transmit, horizontal receive"
- description "Terrain-corrected gamma naught values of signal transmitted with vertical polarization and received with horizontal polarization with radiometric terrain correction applied."
- file:size 1865840728
- file:checksum "3f305484c85e14b4b1a588894ed3287b"
raster:bands [] 1 items
0
- nodata -32768
- data_type "float32"
- spatial_resolution 10.0
roles [] 1 items
- 0 "data"
vv
- href "https://sentinel1euwestrtc.blob.core.windows.net/sentinel1-grd-rtc/GRD/2021/5/26/IW/DV/S1A_IW_GRDH_1SDV_20210526T121351_20210526T121416_038059_047DE5_C35A/measurement/iw-vv.rtc.tiff"
- type "image/tiff; application=geotiff; profile=cloud-optimized"
- title "VV: vertical transmit, vertical receive"
- description "Terrain-corrected gamma naught values of signal transmitted with vertical polarization and received with vertical polarization with radiometric terrain correction applied."
- file:size 1873608727
- file:checksum "e4b745f3050b8e44678298b8bb3f0246"
raster:bands [] 1 items
0
- nodata -32768
- data_type "float32"
- spatial_resolution 10.0
roles [] 1 items
- 0 "data"
tilejson
- href "https://planetarycomputer.microsoft.com/api/data/v1/item/tilejson.json?collection=sentinel-1-rtc&item=S1A_IW_GRDH_1SDV_20210526T121351_20210526T121416_038059_047DE5_rtc&assets=vv&assets=vh&tile_format=png&expression=0.03+%2B+log+%2810e-4+-+log+%280.05+%2F+%280.02+%2B+2+%2A+vv%29%29%29%3B0.05+%2B+exp+%280.25+%2A+%28log+%280.01+%2B+2+%2A+vv%29+%2B+log+%280.02+%2B+5+%2A+vh%29%29%29%3B1+-+log+%280.05+%2F+%280.045+-+0.9+%2A+vv%29%29&asset_as_band=True&rescale=0%2C.8000&rescale=0%2C1.000&rescale=0%2C1.000&format=png"
- type "application/json"
- title "TileJSON with default rendering"
roles [] 1 items
- 0 "tiles"
rendered_preview
- href "https://planetarycomputer.microsoft.com/api/data/v1/item/preview.png?collection=sentinel-1-rtc&item=S1A_IW_GRDH_1SDV_20210526T121351_20210526T121416_038059_047DE5_rtc&assets=vv&assets=vh&tile_format=png&expression=0.03+%2B+log+%2810e-4+-+log+%280.05+%2F+%280.02+%2B+2+%2A+vv%29%29%29%3B0.05+%2B+exp+%280.25+%2A+%28log+%280.01+%2B+2+%2A+vv%29+%2B+log+%280.02+%2B+5+%2A+vh%29%29%29%3B1+-+log+%280.05+%2F+%280.045+-+0.9+%2A+vv%29%29&asset_as_band=True&rescale=0%2C.8000&rescale=0%2C1.000&rescale=0%2C1.000&format=png"
- type "image/png"
- title "Rendered preview"
- rel "preview"
roles [] 1 items
- 0 "overview"
bbox [] 4 items
- 0 86.20642056
- 1 26.3665977
- 2 88.98507093
- 3 28.28941979
stac_extensions [] 6 items
- 0 "https://stac-extensions.github.io/sar/v1.0.0/schema.json"
- 1 "https://stac-extensions.github.io/sat/v1.0.0/schema.json"
- 2 "https://stac-extensions.github.io/eo/v1.0.0/schema.json"
- 3 "https://stac-extensions.github.io/projection/v1.0.0/schema.json"
- 4 "https://stac-extensions.github.io/file/v2.0.0/schema.json"
- 5 "https://stac-extensions.github.io/raster/v1.1.0/schema.json"
- collection "sentinel-1-rtc"
107
- type "Feature"
- stac_version "1.0.0"
- id "S1A_IW_GRDH_1SDV_20210521T120544_20210521T120609_037986_047BBD_rtc"
properties
- datetime "2021-05-21T12:05:56.706900Z"
- platform "SENTINEL-1A"
s1:shape [] 2 items
- 0 28424
- 1 21971
proj:bbox [] 4 items
- 0 618220.0
- 1 2960450.0
- 2 902460.0
- 3 3180160.0
- proj:epsg 32645
proj:shape [] 2 items
- 0 21971
- 1 28424
- end_datetime "2021-05-21 12:06:09.206611+00:00"
- constellation "Sentinel-1"
- s1:resolution "high"
proj:transform [] 9 items
- 0 10.0
- 1 0.0
- 2 618220.0
- 3 0.0
- 4 -10.0
- 5 3180160.0
- 6 0.0
- 7 0.0
- 8 1.0
- s1:datatake_id "293821"
- start_datetime "2021-05-21 12:05:44.207189+00:00"
- s1:orbit_source "DOWNLINK"
- s1:slice_number "6"
- s1:total_slices "21"
- sar:looks_range 5
- sat:orbit_state "ascending"
- sar:product_type "GRD"
- sar:looks_azimuth 1
sar:polarizations [] 2 items
- 0 "VV"
- 1 "VH"
- sar:frequency_band "C"
- sat:absolute_orbit 37986
- sat:relative_orbit 114
- s1:processing_level "1"
- sar:instrument_mode "IW"
- sar:center_frequency 5.405
- sar:resolution_range 20
- s1:product_timeliness "Fast-24h"
- sar:resolution_azimuth 22
- sar:pixel_spacing_range 10
- sar:observation_direction "right"
- sar:pixel_spacing_azimuth 10
- sar:looks_equivalent_number 4.4
- s1:instrument_configuration_ID "6"
- sat:platform_international_designator "2014-016A"
geometry
- type "Polygon"
coordinates [] 1 items
0 [] 14 items
0 [] 2 items
- 0 89.9804227
- 1 27.0122703
1 [] 2 items
- 0 90.9937412
- 1 27.1729241
2 [] 2 items
- 0 90.7248549
- 1 28.6819157
3 [] 2 items
- 0 88.2179897
- 1 28.27985
4 [] 2 items
- 0 88.3557808
- 1 27.7231898
5 [] 2 items
- 0 88.3302615
- 1 27.5842511
6 [] 2 items
- 0 88.3768978
- 1 27.5222365
7 [] 2 items
- 0 88.3585997
- 1 27.4089531
8 [] 2 items
- 0 88.4008748
- 1 27.3365029
9 [] 2 items
- 0 88.3794291
- 1 27.302415
10 [] 2 items
- 0 88.416308
- 1 27.2065443
11 [] 2 items
- 0 88.4046476
- 1 27.0895839
12 [] 2 items
- 0 88.4756334
- 1 26.7595998
13 [] 2 items
- 0 89.9804227
- 1 27.0122703
links [] 7 items
0
- rel "collection"
- href "https://planetarycomputer.microsoft.com/api/stac/v1/collections/sentinel-1-rtc"
- type "application/json"
1
- rel "parent"
- href "https://planetarycomputer.microsoft.com/api/stac/v1/collections/sentinel-1-rtc"
- type "application/json"
2
- rel "root"
- href "https://planetarycomputer.microsoft.com/api/stac/v1"
- type "application/json"
- title "Microsoft Planetary Computer STAC API"
3
- rel "self"
- href "https://planetarycomputer.microsoft.com/api/stac/v1/collections/sentinel-1-rtc/items/S1A_IW_GRDH_1SDV_20210521T120544_20210521T120609_037986_047BBD_rtc"
- type "application/geo+json"
4
- rel "license"
- href "https://sentinel.esa.int/documents/247904/690755/Sentinel_Data_Legal_Notice"
5
- rel "derived_from"
- href "https://planetarycomputer.microsoft.com/api/stac/v1/collections/sentinel-1-grd/items/S1A_IW_GRDH_1SDV_20210521T120544_20210521T120609_037986_047BBD"
- type "application/json"
- title "Sentinel 1 GRD Item"
6
- rel "preview"
- href "https://planetarycomputer.microsoft.com/api/data/v1/item/map?collection=sentinel-1-rtc&item=S1A_IW_GRDH_1SDV_20210521T120544_20210521T120609_037986_047BBD_rtc"
- type "text/html"
- title "Map of item"
assets
vh
- href "https://sentinel1euwestrtc.blob.core.windows.net/sentinel1-grd-rtc/GRD/2021/5/21/IW/DV/S1A_IW_GRDH_1SDV_20210521T120544_20210521T120609_037986_047BBD_1FAA/measurement/iw-vh.rtc.tiff"
- type "image/tiff; application=geotiff; profile=cloud-optimized"
- title "VH: vertical transmit, horizontal receive"
- description "Terrain-corrected gamma naught values of signal transmitted with vertical polarization and received with horizontal polarization with radiometric terrain correction applied."
- file:size 1850823804
- file:checksum "e4993f9c2d458bda8f08cfce9719aaa7"
raster:bands [] 1 items
0
- nodata -32768
- data_type "float32"
- spatial_resolution 10.0
roles [] 1 items
- 0 "data"
vv
- href "https://sentinel1euwestrtc.blob.core.windows.net/sentinel1-grd-rtc/GRD/2021/5/21/IW/DV/S1A_IW_GRDH_1SDV_20210521T120544_20210521T120609_037986_047BBD_1FAA/measurement/iw-vv.rtc.tiff"
- type "image/tiff; application=geotiff; profile=cloud-optimized"
- title "VV: vertical transmit, vertical receive"
- description "Terrain-corrected gamma naught values of signal transmitted with vertical polarization and received with vertical polarization with radiometric terrain correction applied."
- file:size 1859433373
- file:checksum "8c550008f76e2752130d375329355c92"
raster:bands [] 1 items
0
- nodata -32768
- data_type "float32"
- spatial_resolution 10.0
roles [] 1 items
- 0 "data"
tilejson
- href "https://planetarycomputer.microsoft.com/api/data/v1/item/tilejson.json?collection=sentinel-1-rtc&item=S1A_IW_GRDH_1SDV_20210521T120544_20210521T120609_037986_047BBD_rtc&assets=vv&assets=vh&tile_format=png&expression=0.03+%2B+log+%2810e-4+-+log+%280.05+%2F+%280.02+%2B+2+%2A+vv%29%29%29%3B0.05+%2B+exp+%280.25+%2A+%28log+%280.01+%2B+2+%2A+vv%29+%2B+log+%280.02+%2B+5+%2A+vh%29%29%29%3B1+-+log+%280.05+%2F+%280.045+-+0.9+%2A+vv%29%29&asset_as_band=True&rescale=0%2C.8000&rescale=0%2C1.000&rescale=0%2C1.000&format=png"
- type "application/json"
- title "TileJSON with default rendering"
roles [] 1 items
- 0 "tiles"
rendered_preview
- href "https://planetarycomputer.microsoft.com/api/data/v1/item/preview.png?collection=sentinel-1-rtc&item=S1A_IW_GRDH_1SDV_20210521T120544_20210521T120609_037986_047BBD_rtc&assets=vv&assets=vh&tile_format=png&expression=0.03+%2B+log+%2810e-4+-+log+%280.05+%2F+%280.02+%2B+2+%2A+vv%29%29%29%3B0.05+%2B+exp+%280.25+%2A+%28log+%280.01+%2B+2+%2A+vv%29+%2B+log+%280.02+%2B+5+%2A+vh%29%29%29%3B1+-+log+%280.05+%2F+%280.045+-+0.9+%2A+vv%29%29&asset_as_band=True&rescale=0%2C.8000&rescale=0%2C1.000&rescale=0%2C1.000&format=png"
- type "image/png"
- title "Rendered preview"
- rel "preview"
roles [] 1 items
- 0 "overview"
bbox [] 4 items
- 0 88.21798965
- 1 26.75959983
- 2 90.9937412
- 3 28.68191566
stac_extensions [] 6 items
- 0 "https://stac-extensions.github.io/sar/v1.0.0/schema.json"
- 1 "https://stac-extensions.github.io/sat/v1.0.0/schema.json"
- 2 "https://stac-extensions.github.io/eo/v1.0.0/schema.json"
- 3 "https://stac-extensions.github.io/projection/v1.0.0/schema.json"
- 4 "https://stac-extensions.github.io/file/v2.0.0/schema.json"
- 5 "https://stac-extensions.github.io/raster/v1.1.0/schema.json"
- collection "sentinel-1-rtc"
108
- type "Feature"
- stac_version "1.0.0"
- id "S1A_IW_GRDH_1SDV_20210517T000309_20210517T000334_037920_0479A9_rtc"
properties
- datetime "2021-05-17T00:03:22.364326Z"
- platform "SENTINEL-1A"
s1:shape [] 2 items
- 0 27534
- 1 21082
proj:bbox [] 4 items
- 0 524470.0
- 1 2980840.0
- 2 799810.0
- 3 3191660.0
- proj:epsg 32645
proj:shape [] 2 items
- 0 21082
- 1 27534
- end_datetime "2021-05-17 00:03:34.863631+00:00"
- constellation "Sentinel-1"
- s1:resolution "high"
proj:transform [] 9 items
- 0 10.0
- 1 0.0
- 2 524470.0
- 3 0.0
- 4 -10.0
- 5 3191660.0
- 6 0.0
- 7 0.0
- 8 1.0
- s1:datatake_id "293289"
- start_datetime "2021-05-17 00:03:09.865021+00:00"
- s1:orbit_source "DOWNLINK"
- s1:slice_number "12"
- s1:total_slices "17"
- sar:looks_range 5
- sat:orbit_state "descending"
- sar:product_type "GRD"
- sar:looks_azimuth 1
sar:polarizations [] 2 items
- 0 "VV"
- 1 "VH"
- sar:frequency_band "C"
- sat:absolute_orbit 37920
- sat:relative_orbit 48
- s1:processing_level "1"
- sar:instrument_mode "IW"
- sar:center_frequency 5.405
- sar:resolution_range 20
- s1:product_timeliness "Fast-24h"
- sar:resolution_azimuth 22
- sar:pixel_spacing_range 10
- sar:observation_direction "right"
- sar:pixel_spacing_azimuth 10
- sar:looks_equivalent_number 4.4
- s1:instrument_configuration_ID "6"
- sat:platform_international_designator "2014-016A"
geometry
- type "Polygon"
coordinates [] 1 items
0 [] 19 items
0 [] 2 items
- 0 89.8046161
- 1 27.0228311
1 [] 2 items
- 0 89.7776356
- 1 26.994901
2 [] 2 items
- 0 89.7846715
- 1 26.9227187
3 [] 2 items
- 0 87.305283
- 1 27.3295615
4 [] 2 items
- 0 87.4262001
- 1 28.193986
5 [] 2 items
- 0 87.5589426
- 1 28.8401129
6 [] 2 items
- 0 90.0499522
- 1 28.4416791
7 [] 2 items
- 0 90.0266427
- 1 28.2911624
8 [] 2 items
- 0 89.9735466
- 1 28.1919348
9 [] 2 items
- 0 89.9980864
- 1 28.1482825
10 [] 2 items
- 0 89.9713891
- 1 28.0843691
11 [] 2 items
- 0 89.9879165
- 1 28.0016541
12 [] 2 items
- 0 89.9451944
- 1 27.9517005
13 [] 2 items
- 0 89.9296834
- 1 27.8247488
14 [] 2 items
- 0 89.9528207
- 1 27.6783894
15 [] 2 items
- 0 89.9221241
- 1 27.6329433
16 [] 2 items
- 0 89.9035389
- 1 27.4309878
17 [] 2 items
- 0 89.8293875
- 1 27.2744532
18 [] 2 items
- 0 89.8046161
- 1 27.0228311
links [] 7 items
0
- rel "collection"
- href "https://planetarycomputer.microsoft.com/api/stac/v1/collections/sentinel-1-rtc"
- type "application/json"
1
- rel "parent"
- href "https://planetarycomputer.microsoft.com/api/stac/v1/collections/sentinel-1-rtc"
- type "application/json"
2
- rel "root"
- href "https://planetarycomputer.microsoft.com/api/stac/v1"
- type "application/json"
- title "Microsoft Planetary Computer STAC API"
3
- rel "self"
- href "https://planetarycomputer.microsoft.com/api/stac/v1/collections/sentinel-1-rtc/items/S1A_IW_GRDH_1SDV_20210517T000309_20210517T000334_037920_0479A9_rtc"
- type "application/geo+json"
4
- rel "license"
- href "https://sentinel.esa.int/documents/247904/690755/Sentinel_Data_Legal_Notice"
5
- rel "derived_from"
- href "https://planetarycomputer.microsoft.com/api/stac/v1/collections/sentinel-1-grd/items/S1A_IW_GRDH_1SDV_20210517T000309_20210517T000334_037920_0479A9"
- type "application/json"
- title "Sentinel 1 GRD Item"
6
- rel "preview"
- href "https://planetarycomputer.microsoft.com/api/data/v1/item/map?collection=sentinel-1-rtc&item=S1A_IW_GRDH_1SDV_20210517T000309_20210517T000334_037920_0479A9_rtc"
- type "text/html"
- title "Map of item"
assets
vh
- href "https://sentinel1euwestrtc.blob.core.windows.net/sentinel1-grd-rtc/GRD/2021/5/17/IW/DV/S1A_IW_GRDH_1SDV_20210517T000309_20210517T000334_037920_0479A9_4C29/measurement/iw-vh.rtc.tiff"
- type "image/tiff; application=geotiff; profile=cloud-optimized"
- title "VH: vertical transmit, horizontal receive"
- description "Terrain-corrected gamma naught values of signal transmitted with vertical polarization and received with horizontal polarization with radiometric terrain correction applied."
- file:size 1840322242
- file:checksum "9d102c47c57bc910df0dd66904b80e33"
raster:bands [] 1 items
0
- nodata -32768
- data_type "float32"
- spatial_resolution 10.0
roles [] 1 items
- 0 "data"
vv
- href "https://sentinel1euwestrtc.blob.core.windows.net/sentinel1-grd-rtc/GRD/2021/5/17/IW/DV/S1A_IW_GRDH_1SDV_20210517T000309_20210517T000334_037920_0479A9_4C29/measurement/iw-vv.rtc.tiff"
- type "image/tiff; application=geotiff; profile=cloud-optimized"
- title "VV: vertical transmit, vertical receive"
- description "Terrain-corrected gamma naught values of signal transmitted with vertical polarization and received with vertical polarization with radiometric terrain correction applied."
- file:size 1848463651
- file:checksum "3aa211782bf91d37da271cea616011d1"
raster:bands [] 1 items
0
- nodata -32768
- data_type "float32"
- spatial_resolution 10.0
roles [] 1 items
- 0 "data"
tilejson
- href "https://planetarycomputer.microsoft.com/api/data/v1/item/tilejson.json?collection=sentinel-1-rtc&item=S1A_IW_GRDH_1SDV_20210517T000309_20210517T000334_037920_0479A9_rtc&assets=vv&assets=vh&tile_format=png&expression=0.03+%2B+log+%2810e-4+-+log+%280.05+%2F+%280.02+%2B+2+%2A+vv%29%29%29%3B0.05+%2B+exp+%280.25+%2A+%28log+%280.01+%2B+2+%2A+vv%29+%2B+log+%280.02+%2B+5+%2A+vh%29%29%29%3B1+-+log+%280.05+%2F+%280.045+-+0.9+%2A+vv%29%29&asset_as_band=True&rescale=0%2C.8000&rescale=0%2C1.000&rescale=0%2C1.000&format=png"
- type "application/json"
- title "TileJSON with default rendering"
roles [] 1 items
- 0 "tiles"
rendered_preview
- href "https://planetarycomputer.microsoft.com/api/data/v1/item/preview.png?collection=sentinel-1-rtc&item=S1A_IW_GRDH_1SDV_20210517T000309_20210517T000334_037920_0479A9_rtc&assets=vv&assets=vh&tile_format=png&expression=0.03+%2B+log+%2810e-4+-+log+%280.05+%2F+%280.02+%2B+2+%2A+vv%29%29%29%3B0.05+%2B+exp+%280.25+%2A+%28log+%280.01+%2B+2+%2A+vv%29+%2B+log+%280.02+%2B+5+%2A+vh%29%29%29%3B1+-+log+%280.05+%2F+%280.045+-+0.9+%2A+vv%29%29&asset_as_band=True&rescale=0%2C.8000&rescale=0%2C1.000&rescale=0%2C1.000&format=png"
- type "image/png"
- title "Rendered preview"
- rel "preview"
roles [] 1 items
- 0 "overview"
bbox [] 4 items
- 0 87.30528303
- 1 26.92271872
- 2 90.04995217
- 3 28.84011292
stac_extensions [] 6 items
- 0 "https://stac-extensions.github.io/sar/v1.0.0/schema.json"
- 1 "https://stac-extensions.github.io/sat/v1.0.0/schema.json"
- 2 "https://stac-extensions.github.io/eo/v1.0.0/schema.json"
- 3 "https://stac-extensions.github.io/projection/v1.0.0/schema.json"
- 4 "https://stac-extensions.github.io/file/v2.0.0/schema.json"
- 5 "https://stac-extensions.github.io/raster/v1.1.0/schema.json"
- collection "sentinel-1-rtc"
109
- type "Feature"
- stac_version "1.0.0"
- id "S1A_IW_GRDH_1SDV_20210514T121351_20210514T121416_037884_047898_rtc"
properties
- datetime "2021-05-14T12:14:03.650190Z"
- platform "SENTINEL-1A"
s1:shape [] 2 items
- 0 28151
- 1 21599
proj:bbox [] 4 items
- 0 421850.0
- 1 2916210.0
- 2 703360.0
- 3 3132200.0
- proj:epsg 32645
proj:shape [] 2 items
- 0 21599
- 1 28151
- end_datetime "2021-05-14 12:14:16.149895+00:00"
- constellation "Sentinel-1"
- s1:resolution "high"
proj:transform [] 9 items
- 0 10.0
- 1 0.0
- 2 421850.0
- 3 0.0
- 4 -10.0
- 5 3132200.0
- 6 0.0
- 7 0.0
- 8 1.0
- s1:datatake_id "293016"
- start_datetime "2021-05-14 12:13:51.150485+00:00"
- s1:orbit_source "DOWNLINK"
- s1:slice_number "6"
- s1:total_slices "20"
- sar:looks_range 5
- sat:orbit_state "ascending"
- sar:product_type "GRD"
- sar:looks_azimuth 1
sar:polarizations [] 2 items
- 0 "VV"
- 1 "VH"
- sar:frequency_band "C"
- sat:absolute_orbit 37884
- sat:relative_orbit 12
- s1:processing_level "1"
- sar:instrument_mode "IW"
- sar:center_frequency 5.405
- sar:resolution_range 20
- s1:product_timeliness "Fast-24h"
- sar:resolution_azimuth 22
- sar:pixel_spacing_range 10
- sar:observation_direction "right"
- sar:pixel_spacing_azimuth 10
- sar:looks_equivalent_number 4.4
- s1:instrument_configuration_ID "6"
- sat:platform_international_designator "2014-016A"
geometry
- type "Polygon"
coordinates [] 1 items
0 [] 15 items
0 [] 2 items
- 0 86.2063197
- 1 27.8442304
1 [] 2 items
- 0 86.2109749
- 1 27.8815386
2 [] 2 items
- 0 88.7385577
- 1 28.2894224
3 [] 2 items
- 0 88.9226475
- 1 27.3280392
4 [] 2 items
- 0 88.9850694
- 1 26.7768015
5 [] 2 items
- 0 86.4996789
- 1 26.3664168
6 [] 2 items
- 0 86.3725316
- 1 27.0818408
7 [] 2 items
- 0 86.3190734
- 1 27.2319988
8 [] 2 items
- 0 86.3287048
- 1 27.3770325
9 [] 2 items
- 0 86.2783816
- 1 27.4646203
10 [] 2 items
- 0 86.2715809
- 1 27.697673
11 [] 2 items
- 0 86.2169032
- 1 27.7562317
12 [] 2 items
- 0 86.2349909
- 1 27.781609
13 [] 2 items
- 0 86.210414
- 1 27.7836373
14 [] 2 items
- 0 86.2063197
- 1 27.8442304
links [] 7 items
0
- rel "collection"
- href "https://planetarycomputer.microsoft.com/api/stac/v1/collections/sentinel-1-rtc"
- type "application/json"
1
- rel "parent"
- href "https://planetarycomputer.microsoft.com/api/stac/v1/collections/sentinel-1-rtc"
- type "application/json"
2
- rel "root"
- href "https://planetarycomputer.microsoft.com/api/stac/v1"
- type "application/json"
- title "Microsoft Planetary Computer STAC API"
3
- rel "self"
- href "https://planetarycomputer.microsoft.com/api/stac/v1/collections/sentinel-1-rtc/items/S1A_IW_GRDH_1SDV_20210514T121351_20210514T121416_037884_047898_rtc"
- type "application/geo+json"
4
- rel "license"
- href "https://sentinel.esa.int/documents/247904/690755/Sentinel_Data_Legal_Notice"
5
- rel "derived_from"
- href "https://planetarycomputer.microsoft.com/api/stac/v1/collections/sentinel-1-grd/items/S1A_IW_GRDH_1SDV_20210514T121351_20210514T121416_037884_047898"
- type "application/json"
- title "Sentinel 1 GRD Item"
6
- rel "preview"
- href "https://planetarycomputer.microsoft.com/api/data/v1/item/map?collection=sentinel-1-rtc&item=S1A_IW_GRDH_1SDV_20210514T121351_20210514T121416_037884_047898_rtc"
- type "text/html"
- title "Map of item"
assets
vh
- href "https://sentinel1euwestrtc.blob.core.windows.net/sentinel1-grd-rtc/GRD/2021/5/14/IW/DV/S1A_IW_GRDH_1SDV_20210514T121351_20210514T121416_037884_047898_B8A6/measurement/iw-vh.rtc.tiff"
- type "image/tiff; application=geotiff; profile=cloud-optimized"
- title "VH: vertical transmit, horizontal receive"
- description "Terrain-corrected gamma naught values of signal transmitted with vertical polarization and received with horizontal polarization with radiometric terrain correction applied."
- file:size 1865477089
- file:checksum "922e8032cee53ac2b3903689eed8e83d"
raster:bands [] 1 items
0
- nodata -32768
- data_type "float32"
- spatial_resolution 10.0
roles [] 1 items
- 0 "data"
vv
- href "https://sentinel1euwestrtc.blob.core.windows.net/sentinel1-grd-rtc/GRD/2021/5/14/IW/DV/S1A_IW_GRDH_1SDV_20210514T121351_20210514T121416_037884_047898_B8A6/measurement/iw-vv.rtc.tiff"
- type "image/tiff; application=geotiff; profile=cloud-optimized"
- title "VV: vertical transmit, vertical receive"
- description "Terrain-corrected gamma naught values of signal transmitted with vertical polarization and received with vertical polarization with radiometric terrain correction applied."
- file:size 1873094701
- file:checksum "9d761e8204075590a645512ce943cf28"
raster:bands [] 1 items
0
- nodata -32768
- data_type "float32"
- spatial_resolution 10.0
roles [] 1 items
- 0 "data"
tilejson
- href "https://planetarycomputer.microsoft.com/api/data/v1/item/tilejson.json?collection=sentinel-1-rtc&item=S1A_IW_GRDH_1SDV_20210514T121351_20210514T121416_037884_047898_rtc&assets=vv&assets=vh&tile_format=png&expression=0.03+%2B+log+%2810e-4+-+log+%280.05+%2F+%280.02+%2B+2+%2A+vv%29%29%29%3B0.05+%2B+exp+%280.25+%2A+%28log+%280.01+%2B+2+%2A+vv%29+%2B+log+%280.02+%2B+5+%2A+vh%29%29%29%3B1+-+log+%280.05+%2F+%280.045+-+0.9+%2A+vv%29%29&asset_as_band=True&rescale=0%2C.8000&rescale=0%2C1.000&rescale=0%2C1.000&format=png"
- type "application/json"
- title "TileJSON with default rendering"
roles [] 1 items
- 0 "tiles"
rendered_preview
- href "https://planetarycomputer.microsoft.com/api/data/v1/item/preview.png?collection=sentinel-1-rtc&item=S1A_IW_GRDH_1SDV_20210514T121351_20210514T121416_037884_047898_rtc&assets=vv&assets=vh&tile_format=png&expression=0.03+%2B+log+%2810e-4+-+log+%280.05+%2F+%280.02+%2B+2+%2A+vv%29%29%29%3B0.05+%2B+exp+%280.25+%2A+%28log+%280.01+%2B+2+%2A+vv%29+%2B+log+%280.02+%2B+5+%2A+vh%29%29%29%3B1+-+log+%280.05+%2F+%280.045+-+0.9+%2A+vv%29%29&asset_as_band=True&rescale=0%2C.8000&rescale=0%2C1.000&rescale=0%2C1.000&format=png"
- type "image/png"
- title "Rendered preview"
- rel "preview"
roles [] 1 items
- 0 "overview"
bbox [] 4 items
- 0 86.20631967
- 1 26.36641677
- 2 88.98506936
- 3 28.28942239
stac_extensions [] 6 items
- 0 "https://stac-extensions.github.io/sar/v1.0.0/schema.json"
- 1 "https://stac-extensions.github.io/sat/v1.0.0/schema.json"
- 2 "https://stac-extensions.github.io/eo/v1.0.0/schema.json"
- 3 "https://stac-extensions.github.io/projection/v1.0.0/schema.json"
- 4 "https://stac-extensions.github.io/file/v2.0.0/schema.json"
- 5 "https://stac-extensions.github.io/raster/v1.1.0/schema.json"
- collection "sentinel-1-rtc"
110
- type "Feature"
- stac_version "1.0.0"
- id "S1A_IW_GRDH_1SDV_20210509T120543_20210509T120608_037811_047676_rtc"
properties
- datetime "2021-05-09T12:05:56.202200Z"
- platform "SENTINEL-1A"
s1:shape [] 2 items
- 0 28423
- 1 21971
proj:bbox [] 4 items
- 0 618230.0
- 1 2960440.0
- 2 902460.0
- 3 3180150.0
- proj:epsg 32645
proj:shape [] 2 items
- 0 21971
- 1 28423
- end_datetime "2021-05-09 12:06:08.701918+00:00"
- constellation "Sentinel-1"
- s1:resolution "high"
proj:transform [] 9 items
- 0 10.0
- 1 0.0
- 2 618230.0
- 3 0.0
- 4 -10.0
- 5 3180150.0
- 6 0.0
- 7 0.0
- 8 1.0
- s1:datatake_id "292470"
- start_datetime "2021-05-09 12:05:43.702482+00:00"
- s1:orbit_source "DOWNLINK"
- s1:slice_number "6"
- s1:total_slices "21"
- sar:looks_range 5
- sat:orbit_state "ascending"
- sar:product_type "GRD"
- sar:looks_azimuth 1
sar:polarizations [] 2 items
- 0 "VV"
- 1 "VH"
- sar:frequency_band "C"
- sat:absolute_orbit 37811
- sat:relative_orbit 114
- s1:processing_level "1"
- sar:instrument_mode "IW"
- sar:center_frequency 5.405
- sar:resolution_range 20
- s1:product_timeliness "Fast-24h"
- sar:resolution_azimuth 22
- sar:pixel_spacing_range 10
- sar:observation_direction "right"
- sar:pixel_spacing_azimuth 10
- sar:looks_equivalent_number 4.4
- s1:instrument_configuration_ID "6"
- sat:platform_international_designator "2014-016A"
geometry
- type "Polygon"
coordinates [] 1 items
0 [] 14 items
0 [] 2 items
- 0 89.9803197
- 1 27.0121822
1 [] 2 items
- 0 90.993738
- 1 27.172834
2 [] 2 items
- 0 90.724957
- 1 28.6819128
3 [] 2 items
- 0 88.2179897
- 1 28.27985
4 [] 2 items
- 0 88.3557808
- 1 27.7231898
5 [] 2 items
- 0 88.3302626
- 1 27.5843413
6 [] 2 items
- 0 88.3768989
- 1 27.5223268
7 [] 2 items
- 0 88.3586986
- 1 27.4087716
8 [] 2 items
- 0 88.4008759
- 1 27.3365932
9 [] 2 items
- 0 88.379529
- 1 27.3023238
10 [] 2 items
- 0 88.416308
- 1 27.2065443
11 [] 2 items
- 0 88.4046476
- 1 27.0895839
12 [] 2 items
- 0 88.4756334
- 1 26.7595998
13 [] 2 items
- 0 89.9803197
- 1 27.0121822
links [] 7 items
0
- rel "collection"
- href "https://planetarycomputer.microsoft.com/api/stac/v1/collections/sentinel-1-rtc"
- type "application/json"
1
- rel "parent"
- href "https://planetarycomputer.microsoft.com/api/stac/v1/collections/sentinel-1-rtc"
- type "application/json"
2
- rel "root"
- href "https://planetarycomputer.microsoft.com/api/stac/v1"
- type "application/json"
- title "Microsoft Planetary Computer STAC API"
3
- rel "self"
- href "https://planetarycomputer.microsoft.com/api/stac/v1/collections/sentinel-1-rtc/items/S1A_IW_GRDH_1SDV_20210509T120543_20210509T120608_037811_047676_rtc"
- type "application/geo+json"
4
- rel "license"
- href "https://sentinel.esa.int/documents/247904/690755/Sentinel_Data_Legal_Notice"
5
- rel "derived_from"
- href "https://planetarycomputer.microsoft.com/api/stac/v1/collections/sentinel-1-grd/items/S1A_IW_GRDH_1SDV_20210509T120543_20210509T120608_037811_047676"
- type "application/json"
- title "Sentinel 1 GRD Item"
6
- rel "preview"
- href "https://planetarycomputer.microsoft.com/api/data/v1/item/map?collection=sentinel-1-rtc&item=S1A_IW_GRDH_1SDV_20210509T120543_20210509T120608_037811_047676_rtc"
- type "text/html"
- title "Map of item"
assets
vh
- href "https://sentinel1euwestrtc.blob.core.windows.net/sentinel1-grd-rtc/GRD/2021/5/9/IW/DV/S1A_IW_GRDH_1SDV_20210509T120543_20210509T120608_037811_047676_F363/measurement/iw-vh.rtc.tiff"
- type "image/tiff; application=geotiff; profile=cloud-optimized"
- title "VH: vertical transmit, horizontal receive"
- description "Terrain-corrected gamma naught values of signal transmitted with vertical polarization and received with horizontal polarization with radiometric terrain correction applied."
- file:size 1849317170
- file:checksum "7172af952b211c9854795fe50e8f2919"
raster:bands [] 1 items
0
- nodata -32768
- data_type "float32"
- spatial_resolution 10.0
roles [] 1 items
- 0 "data"
vv
- href "https://sentinel1euwestrtc.blob.core.windows.net/sentinel1-grd-rtc/GRD/2021/5/9/IW/DV/S1A_IW_GRDH_1SDV_20210509T120543_20210509T120608_037811_047676_F363/measurement/iw-vv.rtc.tiff"
- type "image/tiff; application=geotiff; profile=cloud-optimized"
- title "VV: vertical transmit, vertical receive"
- description "Terrain-corrected gamma naught values of signal transmitted with vertical polarization and received with vertical polarization with radiometric terrain correction applied."
- file:size 1858320559
- file:checksum "de17fb6a802adf48070ef359bd1ea9e4"
raster:bands [] 1 items
0
- nodata -32768
- data_type "float32"
- spatial_resolution 10.0
roles [] 1 items
- 0 "data"
tilejson
- href "https://planetarycomputer.microsoft.com/api/data/v1/item/tilejson.json?collection=sentinel-1-rtc&item=S1A_IW_GRDH_1SDV_20210509T120543_20210509T120608_037811_047676_rtc&assets=vv&assets=vh&tile_format=png&expression=0.03+%2B+log+%2810e-4+-+log+%280.05+%2F+%280.02+%2B+2+%2A+vv%29%29%29%3B0.05+%2B+exp+%280.25+%2A+%28log+%280.01+%2B+2+%2A+vv%29+%2B+log+%280.02+%2B+5+%2A+vh%29%29%29%3B1+-+log+%280.05+%2F+%280.045+-+0.9+%2A+vv%29%29&asset_as_band=True&rescale=0%2C.8000&rescale=0%2C1.000&rescale=0%2C1.000&format=png"
- type "application/json"
- title "TileJSON with default rendering"
roles [] 1 items
- 0 "tiles"
rendered_preview
- href "https://planetarycomputer.microsoft.com/api/data/v1/item/preview.png?collection=sentinel-1-rtc&item=S1A_IW_GRDH_1SDV_20210509T120543_20210509T120608_037811_047676_rtc&assets=vv&assets=vh&tile_format=png&expression=0.03+%2B+log+%2810e-4+-+log+%280.05+%2F+%280.02+%2B+2+%2A+vv%29%29%29%3B0.05+%2B+exp+%280.25+%2A+%28log+%280.01+%2B+2+%2A+vv%29+%2B+log+%280.02+%2B+5+%2A+vh%29%29%29%3B1+-+log+%280.05+%2F+%280.045+-+0.9+%2A+vv%29%29&asset_as_band=True&rescale=0%2C.8000&rescale=0%2C1.000&rescale=0%2C1.000&format=png"
- type "image/png"
- title "Rendered preview"
- rel "preview"
roles [] 1 items
- 0 "overview"
bbox [] 4 items
- 0 88.21798965
- 1 26.75959983
- 2 90.99373799
- 3 28.68191284
stac_extensions [] 6 items
- 0 "https://stac-extensions.github.io/sar/v1.0.0/schema.json"
- 1 "https://stac-extensions.github.io/sat/v1.0.0/schema.json"
- 2 "https://stac-extensions.github.io/eo/v1.0.0/schema.json"
- 3 "https://stac-extensions.github.io/projection/v1.0.0/schema.json"
- 4 "https://stac-extensions.github.io/file/v2.0.0/schema.json"
- 5 "https://stac-extensions.github.io/raster/v1.1.0/schema.json"
- collection "sentinel-1-rtc"
111
- type "Feature"
- stac_version "1.0.0"
- id "S1A_IW_GRDH_1SDV_20210505T000309_20210505T000334_037745_047463_rtc"
properties
- datetime "2021-05-05T00:03:21.746142Z"
- platform "SENTINEL-1A"
s1:shape [] 2 items
- 0 27534
- 1 21082
proj:bbox [] 4 items
- 0 524470.0
- 1 2980840.0
- 2 799810.0
- 3 3191660.0
- proj:epsg 32645
proj:shape [] 2 items
- 0 21082
- 1 27534
- end_datetime "2021-05-05 00:03:34.245439+00:00"
- constellation "Sentinel-1"
- s1:resolution "high"
proj:transform [] 9 items
- 0 10.0
- 1 0.0
- 2 524470.0
- 3 0.0
- 4 -10.0
- 5 3191660.0
- 6 0.0
- 7 0.0
- 8 1.0
- s1:datatake_id "291939"
- start_datetime "2021-05-05 00:03:09.246846+00:00"
- s1:orbit_source "DOWNLINK"
- s1:slice_number "12"
- s1:total_slices "17"
- sar:looks_range 5
- sat:orbit_state "descending"
- sar:product_type "GRD"
- sar:looks_azimuth 1
sar:polarizations [] 2 items
- 0 "VV"
- 1 "VH"
- sar:frequency_band "C"
- sat:absolute_orbit 37745
- sat:relative_orbit 48
- s1:processing_level "1"
- sar:instrument_mode "IW"
- sar:center_frequency 5.405
- sar:resolution_range 20
- s1:product_timeliness "Fast-24h"
- sar:resolution_azimuth 22
- sar:pixel_spacing_range 10
- sar:observation_direction "right"
- sar:pixel_spacing_azimuth 10
- sar:looks_equivalent_number 4.4
- s1:instrument_configuration_ID "6"
- sat:platform_international_designator "2014-016A"
geometry
- type "Polygon"
coordinates [] 1 items
0 [] 19 items
0 [] 2 items
- 0 89.8048197
- 1 27.0229173
1 [] 2 items
- 0 89.7778347
- 1 26.9948068
2 [] 2 items
- 0 89.7848727
- 1 26.9227148
3 [] 2 items
- 0 87.3053844
- 1 27.3296515
4 [] 2 items
- 0 87.4263031
- 1 28.1942565
5 [] 2 items
- 0 87.5590451
- 1 28.8401125
6 [] 2 items
- 0 90.0500541
- 1 28.4416768
7 [] 2 items
- 0 90.0267445
- 1 28.2911601
8 [] 2 items
- 0 89.9736509
- 1 28.1920227
9 [] 2 items
- 0 89.9981881
- 1 28.1482803
10 [] 2 items
- 0 89.9713866
- 1 28.0842789
11 [] 2 items
- 0 89.9880181
- 1 28.0016519
12 [] 2 items
- 0 89.9452983
- 1 27.9517885
13 [] 2 items
- 0 89.9297848
- 1 27.8247467
14 [] 2 items
- 0 89.9529244
- 1 27.6784774
15 [] 2 items
- 0 89.9232779
- 1 27.6382414
16 [] 2 items
- 0 89.9029558
- 1 27.428023
17 [] 2 items
- 0 89.829493
- 1 27.2746315
18 [] 2 items
- 0 89.8048197
- 1 27.0229173
links [] 7 items
0
- rel "collection"
- href "https://planetarycomputer.microsoft.com/api/stac/v1/collections/sentinel-1-rtc"
- type "application/json"
1
- rel "parent"
- href "https://planetarycomputer.microsoft.com/api/stac/v1/collections/sentinel-1-rtc"
- type "application/json"
2
- rel "root"
- href "https://planetarycomputer.microsoft.com/api/stac/v1"
- type "application/json"
- title "Microsoft Planetary Computer STAC API"
3
- rel "self"
- href "https://planetarycomputer.microsoft.com/api/stac/v1/collections/sentinel-1-rtc/items/S1A_IW_GRDH_1SDV_20210505T000309_20210505T000334_037745_047463_rtc"
- type "application/geo+json"
4
- rel "license"
- href "https://sentinel.esa.int/documents/247904/690755/Sentinel_Data_Legal_Notice"
5
- rel "derived_from"
- href "https://planetarycomputer.microsoft.com/api/stac/v1/collections/sentinel-1-grd/items/S1A_IW_GRDH_1SDV_20210505T000309_20210505T000334_037745_047463"
- type "application/json"
- title "Sentinel 1 GRD Item"
6
- rel "preview"
- href "https://planetarycomputer.microsoft.com/api/data/v1/item/map?collection=sentinel-1-rtc&item=S1A_IW_GRDH_1SDV_20210505T000309_20210505T000334_037745_047463_rtc"
- type "text/html"
- title "Map of item"
assets
vh
- href "https://sentinel1euwestrtc.blob.core.windows.net/sentinel1-grd-rtc/GRD/2021/5/5/IW/DV/S1A_IW_GRDH_1SDV_20210505T000309_20210505T000334_037745_047463_35EE/measurement/iw-vh.rtc.tiff"
- type "image/tiff; application=geotiff; profile=cloud-optimized"
- title "VH: vertical transmit, horizontal receive"
- description "Terrain-corrected gamma naught values of signal transmitted with vertical polarization and received with horizontal polarization with radiometric terrain correction applied."
- file:size 1840475079
- file:checksum "c4b168138e0ff50234c9af93ff9f2960"
raster:bands [] 1 items
0
- nodata -32768
- data_type "float32"
- spatial_resolution 10.0
roles [] 1 items
- 0 "data"
vv
- href "https://sentinel1euwestrtc.blob.core.windows.net/sentinel1-grd-rtc/GRD/2021/5/5/IW/DV/S1A_IW_GRDH_1SDV_20210505T000309_20210505T000334_037745_047463_35EE/measurement/iw-vv.rtc.tiff"
- type "image/tiff; application=geotiff; profile=cloud-optimized"
- title "VV: vertical transmit, vertical receive"
- description "Terrain-corrected gamma naught values of signal transmitted with vertical polarization and received with vertical polarization with radiometric terrain correction applied."
- file:size 1847690067
- file:checksum "77ca1e771e902bc345f9e459b9fb1e4e"
raster:bands [] 1 items
0
- nodata -32768
- data_type "float32"
- spatial_resolution 10.0
roles [] 1 items
- 0 "data"
tilejson
- href "https://planetarycomputer.microsoft.com/api/data/v1/item/tilejson.json?collection=sentinel-1-rtc&item=S1A_IW_GRDH_1SDV_20210505T000309_20210505T000334_037745_047463_rtc&assets=vv&assets=vh&tile_format=png&expression=0.03+%2B+log+%2810e-4+-+log+%280.05+%2F+%280.02+%2B+2+%2A+vv%29%29%29%3B0.05+%2B+exp+%280.25+%2A+%28log+%280.01+%2B+2+%2A+vv%29+%2B+log+%280.02+%2B+5+%2A+vh%29%29%29%3B1+-+log+%280.05+%2F+%280.045+-+0.9+%2A+vv%29%29&asset_as_band=True&rescale=0%2C.8000&rescale=0%2C1.000&rescale=0%2C1.000&format=png"
- type "application/json"
- title "TileJSON with default rendering"
roles [] 1 items
- 0 "tiles"
rendered_preview
- href "https://planetarycomputer.microsoft.com/api/data/v1/item/preview.png?collection=sentinel-1-rtc&item=S1A_IW_GRDH_1SDV_20210505T000309_20210505T000334_037745_047463_rtc&assets=vv&assets=vh&tile_format=png&expression=0.03+%2B+log+%2810e-4+-+log+%280.05+%2F+%280.02+%2B+2+%2A+vv%29%29%29%3B0.05+%2B+exp+%280.25+%2A+%28log+%280.01+%2B+2+%2A+vv%29+%2B+log+%280.02+%2B+5+%2A+vh%29%29%29%3B1+-+log+%280.05+%2F+%280.045+-+0.9+%2A+vv%29%29&asset_as_band=True&rescale=0%2C.8000&rescale=0%2C1.000&rescale=0%2C1.000&format=png"
- type "image/png"
- title "Rendered preview"
- rel "preview"
roles [] 1 items
- 0 "overview"
bbox [] 4 items
- 0 87.30538436
- 1 26.92271475
- 2 90.05005415
- 3 28.8401125
stac_extensions [] 6 items
- 0 "https://stac-extensions.github.io/sar/v1.0.0/schema.json"
- 1 "https://stac-extensions.github.io/sat/v1.0.0/schema.json"
- 2 "https://stac-extensions.github.io/eo/v1.0.0/schema.json"
- 3 "https://stac-extensions.github.io/projection/v1.0.0/schema.json"
- 4 "https://stac-extensions.github.io/file/v2.0.0/schema.json"
- 5 "https://stac-extensions.github.io/raster/v1.1.0/schema.json"
- collection "sentinel-1-rtc"
112
- type "Feature"
- stac_version "1.0.0"
- id "S1A_IW_GRDH_1SDV_20210502T121350_20210502T121415_037709_047321_rtc"
properties
- datetime "2021-05-02T12:14:02.953073Z"
- platform "SENTINEL-1A"
s1:shape [] 2 items
- 0 28243
- 1 21598
proj:bbox [] 4 items
- 0 421000.0
- 1 2916220.0
- 2 703430.0
- 3 3132200.0
- proj:epsg 32645
proj:shape [] 2 items
- 0 21598
- 1 28243
- end_datetime "2021-05-02 12:14:15.452022+00:00"
- constellation "Sentinel-1"
- s1:resolution "high"
proj:transform [] 9 items
- 0 10.0
- 1 0.0
- 2 421000.0
- 3 0.0
- 4 -10.0
- 5 3132200.0
- 6 0.0
- 7 0.0
- 8 1.0
- s1:datatake_id "291617"
- start_datetime "2021-05-02 12:13:50.454124+00:00"
- s1:orbit_source "DOWNLINK"
- s1:slice_number "6"
- s1:total_slices "20"
- sar:looks_range 5
- sat:orbit_state "ascending"
- sar:product_type "GRD"
- sar:looks_azimuth 1
sar:polarizations [] 2 items
- 0 "VV"
- 1 "VH"
- sar:frequency_band "C"
- sat:absolute_orbit 37709
- sat:relative_orbit 12
- s1:processing_level "1"
- sar:instrument_mode "IW"
- sar:center_frequency 5.405
- sar:resolution_range 20
- s1:product_timeliness "Fast-24h"
- sar:resolution_azimuth 22
- sar:pixel_spacing_range 10
- sar:observation_direction "right"
- sar:pixel_spacing_azimuth 10
- sar:looks_equivalent_number 4.4
- s1:instrument_configuration_ID "6"
- sat:platform_international_designator "2014-016A"
geometry
- type "Polygon"
coordinates [] 1 items
0 [] 18 items
0 [] 2 items
- 0 87.8653362
- 1 26.5975248
1 [] 2 items
- 0 86.5002799
- 1 26.3665092
2 [] 2 items
- 0 86.3733379
- 1 27.0819347
3 [] 2 items
- 0 86.3196777
- 1 27.2322726
4 [] 2 items
- 0 86.343525
- 1 27.2817691
5 [] 2 items
- 0 86.3150629
- 1 27.309619
6 [] 2 items
- 0 86.3292099
- 1 27.3771252
7 [] 2 items
- 0 86.2791918
- 1 27.4645342
8 [] 2 items
- 0 86.272391
- 1 27.6978578
9 [] 2 items
- 0 86.2176147
- 1 27.7560552
10 [] 2 items
- 0 86.2353962
- 1 27.7817015
11 [] 2 items
- 0 86.2109163
- 1 27.7843623
12 [] 2 items
- 0 86.2047796
- 1 27.8465235
13 [] 2 items
- 0 86.2113819
- 1 27.8814507
14 [] 2 items
- 0 88.7393732
- 1 28.289412
15 [] 2 items
- 0 88.9232584
- 1 27.3283015
16 [] 2 items
- 0 88.9856741
- 1 26.7768832
17 [] 2 items
- 0 87.8653362
- 1 26.5975248
links [] 7 items
0
- rel "collection"
- href "https://planetarycomputer.microsoft.com/api/stac/v1/collections/sentinel-1-rtc"
- type "application/json"
1
- rel "parent"
- href "https://planetarycomputer.microsoft.com/api/stac/v1/collections/sentinel-1-rtc"
- type "application/json"
2
- rel "root"
- href "https://planetarycomputer.microsoft.com/api/stac/v1"
- type "application/json"
- title "Microsoft Planetary Computer STAC API"
3
- rel "self"
- href "https://planetarycomputer.microsoft.com/api/stac/v1/collections/sentinel-1-rtc/items/S1A_IW_GRDH_1SDV_20210502T121350_20210502T121415_037709_047321_rtc"
- type "application/geo+json"
4
- rel "license"
- href "https://sentinel.esa.int/documents/247904/690755/Sentinel_Data_Legal_Notice"
5
- rel "derived_from"
- href "https://planetarycomputer.microsoft.com/api/stac/v1/collections/sentinel-1-grd/items/S1A_IW_GRDH_1SDV_20210502T121350_20210502T121415_037709_047321"
- type "application/json"
- title "Sentinel 1 GRD Item"
6
- rel "preview"
- href "https://planetarycomputer.microsoft.com/api/data/v1/item/map?collection=sentinel-1-rtc&item=S1A_IW_GRDH_1SDV_20210502T121350_20210502T121415_037709_047321_rtc"
- type "text/html"
- title "Map of item"
assets
vh
- href "https://sentinel1euwestrtc.blob.core.windows.net/sentinel1-grd-rtc/GRD/2021/5/2/IW/DV/S1A_IW_GRDH_1SDV_20210502T121350_20210502T121415_037709_047321_709E/measurement/iw-vh.rtc.tiff"
- type "image/tiff; application=geotiff; profile=cloud-optimized"
- title "VH: vertical transmit, horizontal receive"
- description "Terrain-corrected gamma naught values of signal transmitted with vertical polarization and received with horizontal polarization with radiometric terrain correction applied."
- file:size 1868137657
- file:checksum "9e0dc37e6fb1a0e9a6f3a0f1431e2a84"
raster:bands [] 1 items
0
- nodata -32768
- data_type "float32"
- spatial_resolution 10.0
roles [] 1 items
- 0 "data"
vv
- href "https://sentinel1euwestrtc.blob.core.windows.net/sentinel1-grd-rtc/GRD/2021/5/2/IW/DV/S1A_IW_GRDH_1SDV_20210502T121350_20210502T121415_037709_047321_709E/measurement/iw-vv.rtc.tiff"
- type "image/tiff; application=geotiff; profile=cloud-optimized"
- title "VV: vertical transmit, vertical receive"
- description "Terrain-corrected gamma naught values of signal transmitted with vertical polarization and received with vertical polarization with radiometric terrain correction applied."
- file:size 1876026692
- file:checksum "6e7829665ab124a839cbe472642423af"
raster:bands [] 1 items
0
- nodata -32768
- data_type "float32"
- spatial_resolution 10.0
roles [] 1 items
- 0 "data"
tilejson
- href "https://planetarycomputer.microsoft.com/api/data/v1/item/tilejson.json?collection=sentinel-1-rtc&item=S1A_IW_GRDH_1SDV_20210502T121350_20210502T121415_037709_047321_rtc&assets=vv&assets=vh&tile_format=png&expression=0.03+%2B+log+%2810e-4+-+log+%280.05+%2F+%280.02+%2B+2+%2A+vv%29%29%29%3B0.05+%2B+exp+%280.25+%2A+%28log+%280.01+%2B+2+%2A+vv%29+%2B+log+%280.02+%2B+5+%2A+vh%29%29%29%3B1+-+log+%280.05+%2F+%280.045+-+0.9+%2A+vv%29%29&asset_as_band=True&rescale=0%2C.8000&rescale=0%2C1.000&rescale=0%2C1.000&format=png"
- type "application/json"
- title "TileJSON with default rendering"
roles [] 1 items
- 0 "tiles"
rendered_preview
- href "https://planetarycomputer.microsoft.com/api/data/v1/item/preview.png?collection=sentinel-1-rtc&item=S1A_IW_GRDH_1SDV_20210502T121350_20210502T121415_037709_047321_rtc&assets=vv&assets=vh&tile_format=png&expression=0.03+%2B+log+%2810e-4+-+log+%280.05+%2F+%280.02+%2B+2+%2A+vv%29%29%29%3B0.05+%2B+exp+%280.25+%2A+%28log+%280.01+%2B+2+%2A+vv%29+%2B+log+%280.02+%2B+5+%2A+vh%29%29%29%3B1+-+log+%280.05+%2F+%280.045+-+0.9+%2A+vv%29%29&asset_as_band=True&rescale=0%2C.8000&rescale=0%2C1.000&rescale=0%2C1.000&format=png"
- type "image/png"
- title "Rendered preview"
- rel "preview"
roles [] 1 items
- 0 "overview"
bbox [] 4 items
- 0 86.20477962
- 1 26.36650916
- 2 88.98567413
- 3 28.289412
stac_extensions [] 6 items
- 0 "https://stac-extensions.github.io/sar/v1.0.0/schema.json"
- 1 "https://stac-extensions.github.io/sat/v1.0.0/schema.json"
- 2 "https://stac-extensions.github.io/eo/v1.0.0/schema.json"
- 3 "https://stac-extensions.github.io/projection/v1.0.0/schema.json"
- 4 "https://stac-extensions.github.io/file/v2.0.0/schema.json"
- 5 "https://stac-extensions.github.io/raster/v1.1.0/schema.json"
- collection "sentinel-1-rtc"
113
- type "Feature"
- stac_version "1.0.0"
- id "S1A_IW_GRDH_1SDV_20210427T120543_20210427T120608_037636_0470A6_rtc"
properties
- datetime "2021-04-27T12:05:55.506409Z"
- platform "SENTINEL-1A"
s1:shape [] 2 items
- 0 28420
- 1 21971
proj:bbox [] 4 items
- 0 618310.0
- 1 2960430.0
- 2 902510.0
- 3 3180140.0
- proj:epsg 32645
proj:shape [] 2 items
- 0 21971
- 1 28420
- end_datetime "2021-04-27 12:06:08.006150+00:00"
- constellation "Sentinel-1"
- s1:resolution "high"
proj:transform [] 9 items
- 0 10.0
- 1 0.0
- 2 618310.0
- 3 0.0
- 4 -10.0
- 5 3180140.0
- 6 0.0
- 7 0.0
- 8 1.0
- s1:datatake_id "290982"
- start_datetime "2021-04-27 12:05:43.006668+00:00"
- s1:orbit_source "DOWNLINK"
- s1:slice_number "6"
- s1:total_slices "21"
- sar:looks_range 5
- sat:orbit_state "ascending"
- sar:product_type "GRD"
- sar:looks_azimuth 1
sar:polarizations [] 2 items
- 0 "VV"
- 1 "VH"
- sar:frequency_band "C"
- sat:absolute_orbit 37636
- sat:relative_orbit 114
- s1:processing_level "1"
- sar:instrument_mode "IW"
- sar:center_frequency 5.405
- sar:resolution_range 20
- s1:product_timeliness "Fast-24h"
- sar:resolution_azimuth 22
- sar:pixel_spacing_range 10
- sar:observation_direction "right"
- sar:pixel_spacing_azimuth 10
- sar:looks_equivalent_number 4.4
- s1:instrument_configuration_ID "6"
- sat:platform_international_designator "2014-016A"
geometry
- type "Polygon"
coordinates [] 1 items
0 [] 14 items
0 [] 2 items
- 0 89.9808206
- 1 27.0120814
1 [] 2 items
- 0 90.9944397
- 1 27.1727239
2 [] 2 items
- 0 90.7257709
- 1 28.6818003
3 [] 2 items
- 0 88.2189072
- 1 28.2798418
4 [] 2 items
- 0 88.3568964
- 1 27.7231789
5 [] 2 items
- 0 88.3309738
- 1 27.584515
6 [] 2 items
- 0 88.377711
- 1 27.5224993
7 [] 2 items
- 0 88.3595099
- 1 27.4089442
8 [] 2 items
- 0 88.401689
- 1 27.3369461
9 [] 2 items
- 0 88.3801318
- 1 27.302047
10 [] 2 items
- 0 88.4171099
- 1 27.2060848
11 [] 2 items
- 0 88.4055552
- 1 27.0895748
12 [] 2 items
- 0 88.4765383
- 1 26.7595904
13 [] 2 items
- 0 89.9808206
- 1 27.0120814
links [] 7 items
0
- rel "collection"
- href "https://planetarycomputer.microsoft.com/api/stac/v1/collections/sentinel-1-rtc"
- type "application/json"
1
- rel "parent"
- href "https://planetarycomputer.microsoft.com/api/stac/v1/collections/sentinel-1-rtc"
- type "application/json"
2
- rel "root"
- href "https://planetarycomputer.microsoft.com/api/stac/v1"
- type "application/json"
- title "Microsoft Planetary Computer STAC API"
3
- rel "self"
- href "https://planetarycomputer.microsoft.com/api/stac/v1/collections/sentinel-1-rtc/items/S1A_IW_GRDH_1SDV_20210427T120543_20210427T120608_037636_0470A6_rtc"
- type "application/geo+json"
4
- rel "license"
- href "https://sentinel.esa.int/documents/247904/690755/Sentinel_Data_Legal_Notice"
5
- rel "derived_from"
- href "https://planetarycomputer.microsoft.com/api/stac/v1/collections/sentinel-1-grd/items/S1A_IW_GRDH_1SDV_20210427T120543_20210427T120608_037636_0470A6"
- type "application/json"
- title "Sentinel 1 GRD Item"
6
- rel "preview"
- href "https://planetarycomputer.microsoft.com/api/data/v1/item/map?collection=sentinel-1-rtc&item=S1A_IW_GRDH_1SDV_20210427T120543_20210427T120608_037636_0470A6_rtc"
- type "text/html"
- title "Map of item"
assets
vh
- href "https://sentinel1euwestrtc.blob.core.windows.net/sentinel1-grd-rtc/GRD/2021/4/27/IW/DV/S1A_IW_GRDH_1SDV_20210427T120543_20210427T120608_037636_0470A6_D059/measurement/iw-vh.rtc.tiff"
- type "image/tiff; application=geotiff; profile=cloud-optimized"
- title "VH: vertical transmit, horizontal receive"
- description "Terrain-corrected gamma naught values of signal transmitted with vertical polarization and received with horizontal polarization with radiometric terrain correction applied."
- file:size 1851511153
- file:checksum "4282a2b9eca1c33c3fb745616cb50124"
raster:bands [] 1 items
0
- nodata -32768
- data_type "float32"
- spatial_resolution 10.0
roles [] 1 items
- 0 "data"
vv
- href "https://sentinel1euwestrtc.blob.core.windows.net/sentinel1-grd-rtc/GRD/2021/4/27/IW/DV/S1A_IW_GRDH_1SDV_20210427T120543_20210427T120608_037636_0470A6_D059/measurement/iw-vv.rtc.tiff"
- type "image/tiff; application=geotiff; profile=cloud-optimized"
- title "VV: vertical transmit, vertical receive"
- description "Terrain-corrected gamma naught values of signal transmitted with vertical polarization and received with vertical polarization with radiometric terrain correction applied."
- file:size 1860083984
- file:checksum "72b3fa91c78dab08fc8984d56fba5f88"
raster:bands [] 1 items
0
- nodata -32768
- data_type "float32"
- spatial_resolution 10.0
roles [] 1 items
- 0 "data"
tilejson
- href "https://planetarycomputer.microsoft.com/api/data/v1/item/tilejson.json?collection=sentinel-1-rtc&item=S1A_IW_GRDH_1SDV_20210427T120543_20210427T120608_037636_0470A6_rtc&assets=vv&assets=vh&tile_format=png&expression=0.03+%2B+log+%2810e-4+-+log+%280.05+%2F+%280.02+%2B+2+%2A+vv%29%29%29%3B0.05+%2B+exp+%280.25+%2A+%28log+%280.01+%2B+2+%2A+vv%29+%2B+log+%280.02+%2B+5+%2A+vh%29%29%29%3B1+-+log+%280.05+%2F+%280.045+-+0.9+%2A+vv%29%29&asset_as_band=True&rescale=0%2C.8000&rescale=0%2C1.000&rescale=0%2C1.000&format=png"
- type "application/json"
- title "TileJSON with default rendering"
roles [] 1 items
- 0 "tiles"
rendered_preview
- href "https://planetarycomputer.microsoft.com/api/data/v1/item/preview.png?collection=sentinel-1-rtc&item=S1A_IW_GRDH_1SDV_20210427T120543_20210427T120608_037636_0470A6_rtc&assets=vv&assets=vh&tile_format=png&expression=0.03+%2B+log+%2810e-4+-+log+%280.05+%2F+%280.02+%2B+2+%2A+vv%29%29%29%3B0.05+%2B+exp+%280.25+%2A+%28log+%280.01+%2B+2+%2A+vv%29+%2B+log+%280.02+%2B+5+%2A+vh%29%29%29%3B1+-+log+%280.05+%2F+%280.045+-+0.9+%2A+vv%29%29&asset_as_band=True&rescale=0%2C.8000&rescale=0%2C1.000&rescale=0%2C1.000&format=png"
- type "image/png"
- title "Rendered preview"
- rel "preview"
roles [] 1 items
- 0 "overview"
bbox [] 4 items
- 0 88.21890718
- 1 26.75959041
- 2 90.99443967
- 3 28.68180025
stac_extensions [] 6 items
- 0 "https://stac-extensions.github.io/sar/v1.0.0/schema.json"
- 1 "https://stac-extensions.github.io/sat/v1.0.0/schema.json"
- 2 "https://stac-extensions.github.io/eo/v1.0.0/schema.json"
- 3 "https://stac-extensions.github.io/projection/v1.0.0/schema.json"
- 4 "https://stac-extensions.github.io/file/v2.0.0/schema.json"
- 5 "https://stac-extensions.github.io/raster/v1.1.0/schema.json"
- collection "sentinel-1-rtc"
114
- type "Feature"
- stac_version "1.0.0"
- id "S1A_IW_GRDH_1SDV_20210423T000308_20210423T000333_037570_046E48_rtc"
properties
- datetime "2021-04-23T00:03:21.367239Z"
- platform "SENTINEL-1A"
s1:shape [] 2 items
- 0 27536
- 1 21083
proj:bbox [] 4 items
- 0 524430.0
- 1 2980850.0
- 2 799790.0
- 3 3191680.0
- proj:epsg 32645
proj:shape [] 2 items
- 0 21083
- 1 27536
- end_datetime "2021-04-23 00:03:33.866560+00:00"
- constellation "Sentinel-1"
- s1:resolution "high"
proj:transform [] 9 items
- 0 10.0
- 1 0.0
- 2 524430.0
- 3 0.0
- 4 -10.0
- 5 3191680.0
- 6 0.0
- 7 0.0
- 8 1.0
- s1:datatake_id "290376"
- start_datetime "2021-04-23 00:03:08.867917+00:00"
- s1:orbit_source "DOWNLINK"
- s1:slice_number "12"
- s1:total_slices "17"
- sar:looks_range 5
- sat:orbit_state "descending"
- sar:product_type "GRD"
- sar:looks_azimuth 1
sar:polarizations [] 2 items
- 0 "VV"
- 1 "VH"
- sar:frequency_band "C"
- sat:absolute_orbit 37570
- sat:relative_orbit 48
- s1:processing_level "1"
- sar:instrument_mode "IW"
- sar:center_frequency 5.405
- sar:resolution_range 20
- s1:product_timeliness "Fast-24h"
- sar:resolution_azimuth 22
- sar:pixel_spacing_range 10
- sar:observation_direction "right"
- sar:pixel_spacing_azimuth 10
- sar:looks_equivalent_number 4.4
- s1:instrument_configuration_ID "6"
- sat:platform_international_designator "2014-016A"
geometry
- type "Polygon"
coordinates [] 1 items
0 [] 19 items
0 [] 2 items
- 0 89.804314
- 1 27.0228371
1 [] 2 items
- 0 89.7772396
- 1 26.9951795
2 [] 2 items
- 0 89.7848727
- 1 26.9227148
3 [] 2 items
- 0 87.3049793
- 1 27.3293816
4 [] 2 items
- 0 87.4259963
- 1 28.1939866
5 [] 2 items
- 0 87.5586355
- 1 28.8402045
6 [] 2 items
- 0 90.0497508
- 1 28.4417738
7 [] 2 items
- 0 90.0263371
- 1 28.2911692
8 [] 2 items
- 0 89.9733431
- 1 28.1919392
9 [] 2 items
- 0 89.9978804
- 1 28.1481969
10 [] 2 items
- 0 89.9711833
- 1 28.0842833
11 [] 2 items
- 0 89.9876143
- 1 28.0017509
12 [] 2 items
- 0 89.9443479
- 1 27.9504558
13 [] 2 items
- 0 89.9292584
- 1 27.8240362
14 [] 2 items
- 0 89.9526231
- 1 27.678574
15 [] 2 items
- 0 89.9218108
- 1 27.6325891
16 [] 2 items
- 0 89.9032429
- 1 27.4312647
17 [] 2 items
- 0 89.8291811
- 1 27.2742769
18 [] 2 items
- 0 89.804314
- 1 27.0228371
links [] 7 items
0
- rel "collection"
- href "https://planetarycomputer.microsoft.com/api/stac/v1/collections/sentinel-1-rtc"
- type "application/json"
1
- rel "parent"
- href "https://planetarycomputer.microsoft.com/api/stac/v1/collections/sentinel-1-rtc"
- type "application/json"
2
- rel "root"
- href "https://planetarycomputer.microsoft.com/api/stac/v1"
- type "application/json"
- title "Microsoft Planetary Computer STAC API"
3
- rel "self"
- href "https://planetarycomputer.microsoft.com/api/stac/v1/collections/sentinel-1-rtc/items/S1A_IW_GRDH_1SDV_20210423T000308_20210423T000333_037570_046E48_rtc"
- type "application/geo+json"
4
- rel "license"
- href "https://sentinel.esa.int/documents/247904/690755/Sentinel_Data_Legal_Notice"
5
- rel "derived_from"
- href "https://planetarycomputer.microsoft.com/api/stac/v1/collections/sentinel-1-grd/items/S1A_IW_GRDH_1SDV_20210423T000308_20210423T000333_037570_046E48"
- type "application/json"
- title "Sentinel 1 GRD Item"
6
- rel "preview"
- href "https://planetarycomputer.microsoft.com/api/data/v1/item/map?collection=sentinel-1-rtc&item=S1A_IW_GRDH_1SDV_20210423T000308_20210423T000333_037570_046E48_rtc"
- type "text/html"
- title "Map of item"
assets
vh
- href "https://sentinel1euwestrtc.blob.core.windows.net/sentinel1-grd-rtc/GRD/2021/4/23/IW/DV/S1A_IW_GRDH_1SDV_20210423T000308_20210423T000333_037570_046E48_DD3C/measurement/iw-vh.rtc.tiff"
- type "image/tiff; application=geotiff; profile=cloud-optimized"
- title "VH: vertical transmit, horizontal receive"
- description "Terrain-corrected gamma naught values of signal transmitted with vertical polarization and received with horizontal polarization with radiometric terrain correction applied."
- file:size 1840542859
- file:checksum "e27803afbe0278b95912952b8fe6b3d6"
raster:bands [] 1 items
0
- nodata -32768
- data_type "float32"
- spatial_resolution 10.0
roles [] 1 items
- 0 "data"
vv
- href "https://sentinel1euwestrtc.blob.core.windows.net/sentinel1-grd-rtc/GRD/2021/4/23/IW/DV/S1A_IW_GRDH_1SDV_20210423T000308_20210423T000333_037570_046E48_DD3C/measurement/iw-vv.rtc.tiff"
- type "image/tiff; application=geotiff; profile=cloud-optimized"
- title "VV: vertical transmit, vertical receive"
- description "Terrain-corrected gamma naught values of signal transmitted with vertical polarization and received with vertical polarization with radiometric terrain correction applied."
- file:size 1847647099
- file:checksum "94c9d7c30511b961ce76d64a31e044b9"
raster:bands [] 1 items
0
- nodata -32768
- data_type "float32"
- spatial_resolution 10.0
roles [] 1 items
- 0 "data"
tilejson
- href "https://planetarycomputer.microsoft.com/api/data/v1/item/tilejson.json?collection=sentinel-1-rtc&item=S1A_IW_GRDH_1SDV_20210423T000308_20210423T000333_037570_046E48_rtc&assets=vv&assets=vh&tile_format=png&expression=0.03+%2B+log+%2810e-4+-+log+%280.05+%2F+%280.02+%2B+2+%2A+vv%29%29%29%3B0.05+%2B+exp+%280.25+%2A+%28log+%280.01+%2B+2+%2A+vv%29+%2B+log+%280.02+%2B+5+%2A+vh%29%29%29%3B1+-+log+%280.05+%2F+%280.045+-+0.9+%2A+vv%29%29&asset_as_band=True&rescale=0%2C.8000&rescale=0%2C1.000&rescale=0%2C1.000&format=png"
- type "application/json"
- title "TileJSON with default rendering"
roles [] 1 items
- 0 "tiles"
rendered_preview
- href "https://planetarycomputer.microsoft.com/api/data/v1/item/preview.png?collection=sentinel-1-rtc&item=S1A_IW_GRDH_1SDV_20210423T000308_20210423T000333_037570_046E48_rtc&assets=vv&assets=vh&tile_format=png&expression=0.03+%2B+log+%2810e-4+-+log+%280.05+%2F+%280.02+%2B+2+%2A+vv%29%29%29%3B0.05+%2B+exp+%280.25+%2A+%28log+%280.01+%2B+2+%2A+vv%29+%2B+log+%280.02+%2B+5+%2A+vh%29%29%29%3B1+-+log+%280.05+%2F+%280.045+-+0.9+%2A+vv%29%29&asset_as_band=True&rescale=0%2C.8000&rescale=0%2C1.000&rescale=0%2C1.000&format=png"
- type "image/png"
- title "Rendered preview"
- rel "preview"
roles [] 1 items
- 0 "overview"
bbox [] 4 items
- 0 87.30497928
- 1 26.92271475
- 2 90.0497508
- 3 28.84020446
stac_extensions [] 6 items
- 0 "https://stac-extensions.github.io/sar/v1.0.0/schema.json"
- 1 "https://stac-extensions.github.io/sat/v1.0.0/schema.json"
- 2 "https://stac-extensions.github.io/eo/v1.0.0/schema.json"
- 3 "https://stac-extensions.github.io/projection/v1.0.0/schema.json"
- 4 "https://stac-extensions.github.io/file/v2.0.0/schema.json"
- 5 "https://stac-extensions.github.io/raster/v1.1.0/schema.json"
- collection "sentinel-1-rtc"
115
- type "Feature"
- stac_version "1.0.0"
- id "S1A_IW_GRDH_1SDV_20210420T121350_20210420T121415_037534_046D0C_rtc"
properties
- datetime "2021-04-20T12:14:02.616767Z"
- platform "SENTINEL-1A"
s1:shape [] 2 items
- 0 28149
- 1 21598
proj:bbox [] 4 items
- 0 421820.0
- 1 2916220.0
- 2 703310.0
- 3 3132200.0
- proj:epsg 32645
proj:shape [] 2 items
- 0 21598
- 1 28149
- end_datetime "2021-04-20 12:14:15.115720+00:00"
- constellation "Sentinel-1"
- s1:resolution "high"
proj:transform [] 9 items
- 0 10.0
- 1 0.0
- 2 421820.0
- 3 0.0
- 4 -10.0
- 5 3132200.0
- 6 0.0
- 7 0.0
- 8 1.0
- s1:datatake_id "290060"
- start_datetime "2021-04-20 12:13:50.117814+00:00"
- s1:orbit_source "DOWNLINK"
- s1:slice_number "6"
- s1:total_slices "20"
- sar:looks_range 5
- sat:orbit_state "ascending"
- sar:product_type "GRD"
- sar:looks_azimuth 1
sar:polarizations [] 2 items
- 0 "VV"
- 1 "VH"
- sar:frequency_band "C"
- sat:absolute_orbit 37534
- sat:relative_orbit 12
- s1:processing_level "1"
- sar:instrument_mode "IW"
- sar:center_frequency 5.405
- sar:resolution_range 20
- s1:product_timeliness "Fast-24h"
- sar:resolution_azimuth 22
- sar:pixel_spacing_range 10
- sar:observation_direction "right"
- sar:pixel_spacing_azimuth 10
- sar:looks_equivalent_number 4.4
- s1:instrument_configuration_ID "6"
- sat:platform_international_designator "2014-016A"
geometry
- type "Polygon"
coordinates [] 1 items
0 [] 15 items
0 [] 2 items
- 0 86.2060163
- 1 27.8440482
1 [] 2 items
- 0 86.2106702
- 1 27.8815369
2 [] 2 items
- 0 88.7378442
- 1 28.2894315
3 [] 2 items
- 0 88.9223382
- 1 27.3276824
4 [] 2 items
- 0 88.9844677
- 1 26.7769001
5 [] 2 items
- 0 86.4990771
- 1 26.366505
6 [] 2 items
- 0 86.3553339
- 1 27.1612103
7 [] 2 items
- 0 86.3186738
- 1 27.2312747
8 [] 2 items
- 0 86.3269813
- 1 27.3777464
9 [] 2 items
- 0 86.2775732
- 1 27.4644355
10 [] 2 items
- 0 86.2708722
- 1 27.6974887
11 [] 2 items
- 0 86.2162937
- 1 27.7563186
12 [] 2 items
- 0 86.2346883
- 1 27.7813365
13 [] 2 items
- 0 86.2100132
- 1 27.7829128
14 [] 2 items
- 0 86.2060163
- 1 27.8440482
links [] 7 items
0
- rel "collection"
- href "https://planetarycomputer.microsoft.com/api/stac/v1/collections/sentinel-1-rtc"
- type "application/json"
1
- rel "parent"
- href "https://planetarycomputer.microsoft.com/api/stac/v1/collections/sentinel-1-rtc"
- type "application/json"
2
- rel "root"
- href "https://planetarycomputer.microsoft.com/api/stac/v1"
- type "application/json"
- title "Microsoft Planetary Computer STAC API"
3
- rel "self"
- href "https://planetarycomputer.microsoft.com/api/stac/v1/collections/sentinel-1-rtc/items/S1A_IW_GRDH_1SDV_20210420T121350_20210420T121415_037534_046D0C_rtc"
- type "application/geo+json"
4
- rel "license"
- href "https://sentinel.esa.int/documents/247904/690755/Sentinel_Data_Legal_Notice"
5
- rel "derived_from"
- href "https://planetarycomputer.microsoft.com/api/stac/v1/collections/sentinel-1-grd/items/S1A_IW_GRDH_1SDV_20210420T121350_20210420T121415_037534_046D0C"
- type "application/json"
- title "Sentinel 1 GRD Item"
6
- rel "preview"
- href "https://planetarycomputer.microsoft.com/api/data/v1/item/map?collection=sentinel-1-rtc&item=S1A_IW_GRDH_1SDV_20210420T121350_20210420T121415_037534_046D0C_rtc"
- type "text/html"
- title "Map of item"
assets
vh
- href "https://sentinel1euwestrtc.blob.core.windows.net/sentinel1-grd-rtc/GRD/2021/4/20/IW/DV/S1A_IW_GRDH_1SDV_20210420T121350_20210420T121415_037534_046D0C_B82C/measurement/iw-vh.rtc.tiff"
- type "image/tiff; application=geotiff; profile=cloud-optimized"
- title "VH: vertical transmit, horizontal receive"
- description "Terrain-corrected gamma naught values of signal transmitted with vertical polarization and received with horizontal polarization with radiometric terrain correction applied."
- file:size 1868997106
- file:checksum "398187d8fe3aa734bafbac5aa5630469"
raster:bands [] 1 items
0
- nodata -32768
- data_type "float32"
- spatial_resolution 10.0
roles [] 1 items
- 0 "data"
vv
- href "https://sentinel1euwestrtc.blob.core.windows.net/sentinel1-grd-rtc/GRD/2021/4/20/IW/DV/S1A_IW_GRDH_1SDV_20210420T121350_20210420T121415_037534_046D0C_B82C/measurement/iw-vv.rtc.tiff"
- type "image/tiff; application=geotiff; profile=cloud-optimized"
- title "VV: vertical transmit, vertical receive"
- description "Terrain-corrected gamma naught values of signal transmitted with vertical polarization and received with vertical polarization with radiometric terrain correction applied."
- file:size 1876932801
- file:checksum "70a47b71902d03cf4a35bf9b56d9ee5b"
raster:bands [] 1 items
0
- nodata -32768
- data_type "float32"
- spatial_resolution 10.0
roles [] 1 items
- 0 "data"
tilejson
- href "https://planetarycomputer.microsoft.com/api/data/v1/item/tilejson.json?collection=sentinel-1-rtc&item=S1A_IW_GRDH_1SDV_20210420T121350_20210420T121415_037534_046D0C_rtc&assets=vv&assets=vh&tile_format=png&expression=0.03+%2B+log+%2810e-4+-+log+%280.05+%2F+%280.02+%2B+2+%2A+vv%29%29%29%3B0.05+%2B+exp+%280.25+%2A+%28log+%280.01+%2B+2+%2A+vv%29+%2B+log+%280.02+%2B+5+%2A+vh%29%29%29%3B1+-+log+%280.05+%2F+%280.045+-+0.9+%2A+vv%29%29&asset_as_band=True&rescale=0%2C.8000&rescale=0%2C1.000&rescale=0%2C1.000&format=png"
- type "application/json"
- title "TileJSON with default rendering"
roles [] 1 items
- 0 "tiles"
rendered_preview
- href "https://planetarycomputer.microsoft.com/api/data/v1/item/preview.png?collection=sentinel-1-rtc&item=S1A_IW_GRDH_1SDV_20210420T121350_20210420T121415_037534_046D0C_rtc&assets=vv&assets=vh&tile_format=png&expression=0.03+%2B+log+%2810e-4+-+log+%280.05+%2F+%280.02+%2B+2+%2A+vv%29%29%29%3B0.05+%2B+exp+%280.25+%2A+%28log+%280.01+%2B+2+%2A+vv%29+%2B+log+%280.02+%2B+5+%2A+vh%29%29%29%3B1+-+log+%280.05+%2F+%280.045+-+0.9+%2A+vv%29%29&asset_as_band=True&rescale=0%2C.8000&rescale=0%2C1.000&rescale=0%2C1.000&format=png"
- type "image/png"
- title "Rendered preview"
- rel "preview"
roles [] 1 items
- 0 "overview"
bbox [] 4 items
- 0 86.20601633
- 1 26.36650496
- 2 88.98446774
- 3 28.28943147
stac_extensions [] 6 items
- 0 "https://stac-extensions.github.io/sar/v1.0.0/schema.json"
- 1 "https://stac-extensions.github.io/sat/v1.0.0/schema.json"
- 2 "https://stac-extensions.github.io/eo/v1.0.0/schema.json"
- 3 "https://stac-extensions.github.io/projection/v1.0.0/schema.json"
- 4 "https://stac-extensions.github.io/file/v2.0.0/schema.json"
- 5 "https://stac-extensions.github.io/raster/v1.1.0/schema.json"
- collection "sentinel-1-rtc"
116
- type "Feature"
- stac_version "1.0.0"
- id "S1A_IW_GRDH_1SDV_20210415T120542_20210415T120607_037461_046A8E_rtc"
properties
- datetime "2021-04-15T12:05:55.061444Z"
- platform "SENTINEL-1A"
s1:shape [] 2 items
- 0 28423
- 1 21971
proj:bbox [] 4 items
- 0 618220.0
- 1 2960430.0
- 2 902450.0
- 3 3180140.0
- proj:epsg 32645
proj:shape [] 2 items
- 0 21971
- 1 28423
- end_datetime "2021-04-15 12:06:07.561187+00:00"
- constellation "Sentinel-1"
- s1:resolution "high"
proj:transform [] 9 items
- 0 10.0
- 1 0.0
- 2 618220.0
- 3 0.0
- 4 -10.0
- 5 3180140.0
- 6 0.0
- 7 0.0
- 8 1.0
- s1:datatake_id "289422"
- start_datetime "2021-04-15 12:05:42.561702+00:00"
- s1:orbit_source "DOWNLINK"
- s1:slice_number "6"
- s1:total_slices "21"
- sar:looks_range 5
- sat:orbit_state "ascending"
- sar:product_type "GRD"
- sar:looks_azimuth 1
sar:polarizations [] 2 items
- 0 "VV"
- 1 "VH"
- sar:frequency_band "C"
- sat:absolute_orbit 37461
- sat:relative_orbit 114
- s1:processing_level "1"
- sar:instrument_mode "IW"
- sar:center_frequency 5.405
- sar:resolution_range 20
- s1:product_timeliness "Fast-24h"
- sar:resolution_azimuth 22
- sar:pixel_spacing_range 10
- sar:observation_direction "right"
- sar:pixel_spacing_azimuth 10
- sar:looks_equivalent_number 4.4
- s1:instrument_configuration_ID "6"
- sat:platform_international_designator "2014-016A"
geometry
- type "Polygon"
coordinates [] 1 items
0 [] 14 items
0 [] 2 items
- 0 89.9799146
- 1 27.0121006
1 [] 2 items
- 0 90.9937348
- 1 27.172744
2 [] 2 items
- 0 90.724957
- 1 28.6819128
3 [] 2 items
- 0 88.2178867
- 1 28.2797606
4 [] 2 items
- 0 88.3556794
- 1 27.7231908
5 [] 2 items
- 0 88.3301613
- 1 27.5843423
6 [] 2 items
- 0 88.3767965
- 1 27.5222375
7 [] 2 items
- 0 88.3584997
- 1 27.4090443
8 [] 2 items
- 0 88.400776
- 1 27.3366844
9 [] 2 items
- 0 88.3794302
- 1 27.3025053
10 [] 2 items
- 0 88.4163057
- 1 27.2063637
11 [] 2 items
- 0 88.4045468
- 1 27.0895849
12 [] 2 items
- 0 88.4756323
- 1 26.7595096
13 [] 2 items
- 0 89.9799146
- 1 27.0121006
links [] 7 items
0
- rel "collection"
- href "https://planetarycomputer.microsoft.com/api/stac/v1/collections/sentinel-1-rtc"
- type "application/json"
1
- rel "parent"
- href "https://planetarycomputer.microsoft.com/api/stac/v1/collections/sentinel-1-rtc"
- type "application/json"
2
- rel "root"
- href "https://planetarycomputer.microsoft.com/api/stac/v1"
- type "application/json"
- title "Microsoft Planetary Computer STAC API"
3
- rel "self"
- href "https://planetarycomputer.microsoft.com/api/stac/v1/collections/sentinel-1-rtc/items/S1A_IW_GRDH_1SDV_20210415T120542_20210415T120607_037461_046A8E_rtc"
- type "application/geo+json"
4
- rel "license"
- href "https://sentinel.esa.int/documents/247904/690755/Sentinel_Data_Legal_Notice"
5
- rel "derived_from"
- href "https://planetarycomputer.microsoft.com/api/stac/v1/collections/sentinel-1-grd/items/S1A_IW_GRDH_1SDV_20210415T120542_20210415T120607_037461_046A8E"
- type "application/json"
- title "Sentinel 1 GRD Item"
6
- rel "preview"
- href "https://planetarycomputer.microsoft.com/api/data/v1/item/map?collection=sentinel-1-rtc&item=S1A_IW_GRDH_1SDV_20210415T120542_20210415T120607_037461_046A8E_rtc"
- type "text/html"
- title "Map of item"
assets
vh
- href "https://sentinel1euwestrtc.blob.core.windows.net/sentinel1-grd-rtc/GRD/2021/4/15/IW/DV/S1A_IW_GRDH_1SDV_20210415T120542_20210415T120607_037461_046A8E_E06B/measurement/iw-vh.rtc.tiff"
- type "image/tiff; application=geotiff; profile=cloud-optimized"
- title "VH: vertical transmit, horizontal receive"
- description "Terrain-corrected gamma naught values of signal transmitted with vertical polarization and received with horizontal polarization with radiometric terrain correction applied."
- file:size 1850136497
- file:checksum "6257df5d19406c9e1f8ef686eae1368b"
raster:bands [] 1 items
0
- nodata -32768
- data_type "float32"
- spatial_resolution 10.0
roles [] 1 items
- 0 "data"
vv
- href "https://sentinel1euwestrtc.blob.core.windows.net/sentinel1-grd-rtc/GRD/2021/4/15/IW/DV/S1A_IW_GRDH_1SDV_20210415T120542_20210415T120607_037461_046A8E_E06B/measurement/iw-vv.rtc.tiff"
- type "image/tiff; application=geotiff; profile=cloud-optimized"
- title "VV: vertical transmit, vertical receive"
- description "Terrain-corrected gamma naught values of signal transmitted with vertical polarization and received with vertical polarization with radiometric terrain correction applied."
- file:size 1858586252
- file:checksum "492d5f1c8eb59734de956f1f9bc19793"
raster:bands [] 1 items
0
- nodata -32768
- data_type "float32"
- spatial_resolution 10.0
roles [] 1 items
- 0 "data"
tilejson
- href "https://planetarycomputer.microsoft.com/api/data/v1/item/tilejson.json?collection=sentinel-1-rtc&item=S1A_IW_GRDH_1SDV_20210415T120542_20210415T120607_037461_046A8E_rtc&assets=vv&assets=vh&tile_format=png&expression=0.03+%2B+log+%2810e-4+-+log+%280.05+%2F+%280.02+%2B+2+%2A+vv%29%29%29%3B0.05+%2B+exp+%280.25+%2A+%28log+%280.01+%2B+2+%2A+vv%29+%2B+log+%280.02+%2B+5+%2A+vh%29%29%29%3B1+-+log+%280.05+%2F+%280.045+-+0.9+%2A+vv%29%29&asset_as_band=True&rescale=0%2C.8000&rescale=0%2C1.000&rescale=0%2C1.000&format=png"
- type "application/json"
- title "TileJSON with default rendering"
roles [] 1 items
- 0 "tiles"
rendered_preview
- href "https://planetarycomputer.microsoft.com/api/data/v1/item/preview.png?collection=sentinel-1-rtc&item=S1A_IW_GRDH_1SDV_20210415T120542_20210415T120607_037461_046A8E_rtc&assets=vv&assets=vh&tile_format=png&expression=0.03+%2B+log+%2810e-4+-+log+%280.05+%2F+%280.02+%2B+2+%2A+vv%29%29%29%3B0.05+%2B+exp+%280.25+%2A+%28log+%280.01+%2B+2+%2A+vv%29+%2B+log+%280.02+%2B+5+%2A+vh%29%29%29%3B1+-+log+%280.05+%2F+%280.045+-+0.9+%2A+vv%29%29&asset_as_band=True&rescale=0%2C.8000&rescale=0%2C1.000&rescale=0%2C1.000&format=png"
- type "image/png"
- title "Rendered preview"
- rel "preview"
roles [] 1 items
- 0 "overview"
bbox [] 4 items
- 0 88.21788668
- 1 26.75950957
- 2 90.99373478
- 3 28.68191284
stac_extensions [] 6 items
- 0 "https://stac-extensions.github.io/sar/v1.0.0/schema.json"
- 1 "https://stac-extensions.github.io/sat/v1.0.0/schema.json"
- 2 "https://stac-extensions.github.io/eo/v1.0.0/schema.json"
- 3 "https://stac-extensions.github.io/projection/v1.0.0/schema.json"
- 4 "https://stac-extensions.github.io/file/v2.0.0/schema.json"
- 5 "https://stac-extensions.github.io/raster/v1.1.0/schema.json"
- collection "sentinel-1-rtc"
117
- type "Feature"
- stac_version "1.0.0"
- id "S1A_IW_GRDH_1SDV_20210411T000308_20210411T000333_037395_046837_rtc"
properties
- datetime "2021-04-11T00:03:20.827103Z"
- platform "SENTINEL-1A"
s1:shape [] 2 items
- 0 27540
- 1 21084
proj:bbox [] 4 items
- 0 524370.0
- 1 2980840.0
- 2 799770.0
- 3 3191680.0
- proj:epsg 32645
proj:shape [] 2 items
- 0 21084
- 1 27540
- end_datetime "2021-04-11 00:03:33.326434+00:00"
- constellation "Sentinel-1"
- s1:resolution "high"
proj:transform [] 9 items
- 0 10.0
- 1 0.0
- 2 524370.0
- 3 0.0
- 4 -10.0
- 5 3191680.0
- 6 0.0
- 7 0.0
- 8 1.0
- s1:datatake_id "288823"
- start_datetime "2021-04-11 00:03:08.327771+00:00"
- s1:orbit_source "DOWNLINK"
- s1:slice_number "12"
- s1:total_slices "17"
- sar:looks_range 5
- sat:orbit_state "descending"
- sar:product_type "GRD"
- sar:looks_azimuth 1
sar:polarizations [] 2 items
- 0 "VV"
- 1 "VH"
- sar:frequency_band "C"
- sat:absolute_orbit 37395
- sat:relative_orbit 48
- s1:processing_level "1"
- sar:instrument_mode "IW"
- sar:center_frequency 5.405
- sar:resolution_range 20
- s1:product_timeliness "Fast-24h"
- sar:resolution_azimuth 22
- sar:pixel_spacing_range 10
- sar:observation_direction "right"
- sar:pixel_spacing_azimuth 10
- sar:looks_equivalent_number 4.4
- s1:instrument_configuration_ID "6"
- sat:platform_international_designator "2014-016A"
geometry
- type "Polygon"
coordinates [] 1 items
0 [] 18 items
0 [] 2 items
- 0 89.8049677
- 1 27.0653184
1 [] 2 items
- 0 89.7847699
- 1 26.9226266
2 [] 2 items
- 0 87.3045735
- 1 27.3288408
3 [] 2 items
- 0 87.4255891
- 1 28.1940781
4 [] 2 items
- 0 87.557918
- 1 28.8402074
5 [] 2 items
- 0 90.0495442
- 1 28.4416883
6 [] 2 items
- 0 90.0258228
- 1 28.2910002
7 [] 2 items
- 0 89.9729286
- 1 28.1916776
8 [] 2 items
- 0 89.9974736
- 1 28.1482058
9 [] 2 items
- 0 89.97098
- 1 28.0842878
10 [] 2 items
- 0 89.9872354
- 1 28.0027514
11 [] 2 items
- 0 89.9439393
- 1 27.9503743
12 [] 2 items
- 0 89.9281259
- 1 27.8234288
13 [] 2 items
- 0 89.9522155
- 1 27.6784925
14 [] 2 items
- 0 89.9212927
- 1 27.632149
15 [] 2 items
- 0 89.901746
- 1 27.4320176
16 [] 2 items
- 0 89.8289885
- 1 27.2746417
17 [] 2 items
- 0 89.8049677
- 1 27.0653184
links [] 7 items
0
- rel "collection"
- href "https://planetarycomputer.microsoft.com/api/stac/v1/collections/sentinel-1-rtc"
- type "application/json"
1
- rel "parent"
- href "https://planetarycomputer.microsoft.com/api/stac/v1/collections/sentinel-1-rtc"
- type "application/json"
2
- rel "root"
- href "https://planetarycomputer.microsoft.com/api/stac/v1"
- type "application/json"
- title "Microsoft Planetary Computer STAC API"
3
- rel "self"
- href "https://planetarycomputer.microsoft.com/api/stac/v1/collections/sentinel-1-rtc/items/S1A_IW_GRDH_1SDV_20210411T000308_20210411T000333_037395_046837_rtc"
- type "application/geo+json"
4
- rel "license"
- href "https://sentinel.esa.int/documents/247904/690755/Sentinel_Data_Legal_Notice"
5
- rel "derived_from"
- href "https://planetarycomputer.microsoft.com/api/stac/v1/collections/sentinel-1-grd/items/S1A_IW_GRDH_1SDV_20210411T000308_20210411T000333_037395_046837"
- type "application/json"
- title "Sentinel 1 GRD Item"
6
- rel "preview"
- href "https://planetarycomputer.microsoft.com/api/data/v1/item/map?collection=sentinel-1-rtc&item=S1A_IW_GRDH_1SDV_20210411T000308_20210411T000333_037395_046837_rtc"
- type "text/html"
- title "Map of item"
assets
vh
- href "https://sentinel1euwestrtc.blob.core.windows.net/sentinel1-grd-rtc/GRD/2021/4/11/IW/DV/S1A_IW_GRDH_1SDV_20210411T000308_20210411T000333_037395_046837_115A/measurement/iw-vh.rtc.tiff"
- type "image/tiff; application=geotiff; profile=cloud-optimized"
- title "VH: vertical transmit, horizontal receive"
- description "Terrain-corrected gamma naught values of signal transmitted with vertical polarization and received with horizontal polarization with radiometric terrain correction applied."
- file:size 1841631842
- file:checksum "f36c9e342038576cbfd52f4304874713"
raster:bands [] 1 items
0
- nodata -32768
- data_type "float32"
- spatial_resolution 10.0
roles [] 1 items
- 0 "data"
vv
- href "https://sentinel1euwestrtc.blob.core.windows.net/sentinel1-grd-rtc/GRD/2021/4/11/IW/DV/S1A_IW_GRDH_1SDV_20210411T000308_20210411T000333_037395_046837_115A/measurement/iw-vv.rtc.tiff"
- type "image/tiff; application=geotiff; profile=cloud-optimized"
- title "VV: vertical transmit, vertical receive"
- description "Terrain-corrected gamma naught values of signal transmitted with vertical polarization and received with vertical polarization with radiometric terrain correction applied."
- file:size 1848475394
- file:checksum "c0e7935406caf34e7d4c2fb0d5e630c2"
raster:bands [] 1 items
0
- nodata -32768
- data_type "float32"
- spatial_resolution 10.0
roles [] 1 items
- 0 "data"
tilejson
- href "https://planetarycomputer.microsoft.com/api/data/v1/item/tilejson.json?collection=sentinel-1-rtc&item=S1A_IW_GRDH_1SDV_20210411T000308_20210411T000333_037395_046837_rtc&assets=vv&assets=vh&tile_format=png&expression=0.03+%2B+log+%2810e-4+-+log+%280.05+%2F+%280.02+%2B+2+%2A+vv%29%29%29%3B0.05+%2B+exp+%280.25+%2A+%28log+%280.01+%2B+2+%2A+vv%29+%2B+log+%280.02+%2B+5+%2A+vh%29%29%29%3B1+-+log+%280.05+%2F+%280.045+-+0.9+%2A+vv%29%29&asset_as_band=True&rescale=0%2C.8000&rescale=0%2C1.000&rescale=0%2C1.000&format=png"
- type "application/json"
- title "TileJSON with default rendering"
roles [] 1 items
- 0 "tiles"
rendered_preview
- href "https://planetarycomputer.microsoft.com/api/data/v1/item/preview.png?collection=sentinel-1-rtc&item=S1A_IW_GRDH_1SDV_20210411T000308_20210411T000333_037395_046837_rtc&assets=vv&assets=vh&tile_format=png&expression=0.03+%2B+log+%2810e-4+-+log+%280.05+%2F+%280.02+%2B+2+%2A+vv%29%29%29%3B0.05+%2B+exp+%280.25+%2A+%28log+%280.01+%2B+2+%2A+vv%29+%2B+log+%280.02+%2B+5+%2A+vh%29%29%29%3B1+-+log+%280.05+%2F+%280.045+-+0.9+%2A+vv%29%29&asset_as_band=True&rescale=0%2C.8000&rescale=0%2C1.000&rescale=0%2C1.000&format=png"
- type "image/png"
- title "Rendered preview"
- rel "preview"
roles [] 1 items
- 0 "overview"
bbox [] 4 items
- 0 87.30457345
- 1 26.92262656
- 2 90.04954425
- 3 28.84020742
stac_extensions [] 6 items
- 0 "https://stac-extensions.github.io/sar/v1.0.0/schema.json"
- 1 "https://stac-extensions.github.io/sat/v1.0.0/schema.json"
- 2 "https://stac-extensions.github.io/eo/v1.0.0/schema.json"
- 3 "https://stac-extensions.github.io/projection/v1.0.0/schema.json"
- 4 "https://stac-extensions.github.io/file/v2.0.0/schema.json"
- 5 "https://stac-extensions.github.io/raster/v1.1.0/schema.json"
- collection "sentinel-1-rtc"
118
- type "Feature"
- stac_version "1.0.0"
- id "S1A_IW_GRDH_1SDV_20210408T121349_20210408T121414_037359_0466FA_rtc"
properties
- datetime "2021-04-08T12:14:02.083742Z"
- platform "SENTINEL-1A"
s1:shape [] 2 items
- 0 28147
- 1 21598
proj:bbox [] 4 items
- 0 421820.0
- 1 2916210.0
- 2 703290.0
- 3 3132190.0
- proj:epsg 32645
proj:shape [] 2 items
- 0 21598
- 1 28147
- end_datetime "2021-04-08 12:14:14.582680+00:00"
- constellation "Sentinel-1"
- s1:resolution "high"
proj:transform [] 9 items
- 0 10.0
- 1 0.0
- 2 421820.0
- 3 0.0
- 4 -10.0
- 5 3132190.0
- 6 0.0
- 7 0.0
- 8 1.0
- s1:datatake_id "288506"
- start_datetime "2021-04-08 12:13:49.584804+00:00"
- s1:orbit_source "DOWNLINK"
- s1:slice_number "6"
- s1:total_slices "20"
- sar:looks_range 5
- sat:orbit_state "ascending"
- sar:product_type "GRD"
- sar:looks_azimuth 1
sar:polarizations [] 2 items
- 0 "VV"
- 1 "VH"
- sar:frequency_band "C"
- sat:absolute_orbit 37359
- sat:relative_orbit 12
- s1:processing_level "1"
- sar:instrument_mode "IW"
- sar:center_frequency 5.405
- sar:resolution_range 20
- s1:product_timeliness "Fast-24h"
- sar:resolution_azimuth 22
- sar:pixel_spacing_range 10
- sar:observation_direction "right"
- sar:pixel_spacing_azimuth 10
- sar:looks_equivalent_number 4.4
- s1:instrument_configuration_ID "6"
- sat:platform_international_designator "2014-016A"
geometry
- type "Polygon"
coordinates [] 1 items
0 [] 15 items
0 [] 2 items
- 0 86.2060163
- 1 27.8440482
1 [] 2 items
- 0 86.2108727
- 1 27.8816283
2 [] 2 items
- 0 88.7377423
- 1 28.2894328
3 [] 2 items
- 0 88.9222372
- 1 27.3276838
4 [] 2 items
- 0 88.9842667
- 1 26.776903
5 [] 2 items
- 0 86.4989769
- 1 26.3665046
6 [] 2 items
- 0 86.355233
- 1 27.1612098
7 [] 2 items
- 0 86.3185728
- 1 27.2312742
8 [] 2 items
- 0 86.3268807
- 1 27.3776556
9 [] 2 items
- 0 86.277472
- 1 27.464435
10 [] 2 items
- 0 86.2706688
- 1 27.6975779
11 [] 2 items
- 0 86.2161922
- 1 27.756318
12 [] 2 items
- 0 86.2345856
- 1 27.7815165
13 [] 2 items
- 0 86.2100152
- 1 27.782642
14 [] 2 items
- 0 86.2060163
- 1 27.8440482
links [] 7 items
0
- rel "collection"
- href "https://planetarycomputer.microsoft.com/api/stac/v1/collections/sentinel-1-rtc"
- type "application/json"
1
- rel "parent"
- href "https://planetarycomputer.microsoft.com/api/stac/v1/collections/sentinel-1-rtc"
- type "application/json"
2
- rel "root"
- href "https://planetarycomputer.microsoft.com/api/stac/v1"
- type "application/json"
- title "Microsoft Planetary Computer STAC API"
3
- rel "self"
- href "https://planetarycomputer.microsoft.com/api/stac/v1/collections/sentinel-1-rtc/items/S1A_IW_GRDH_1SDV_20210408T121349_20210408T121414_037359_0466FA_rtc"
- type "application/geo+json"
4
- rel "license"
- href "https://sentinel.esa.int/documents/247904/690755/Sentinel_Data_Legal_Notice"
5
- rel "derived_from"
- href "https://planetarycomputer.microsoft.com/api/stac/v1/collections/sentinel-1-grd/items/S1A_IW_GRDH_1SDV_20210408T121349_20210408T121414_037359_0466FA"
- type "application/json"
- title "Sentinel 1 GRD Item"
6
- rel "preview"
- href "https://planetarycomputer.microsoft.com/api/data/v1/item/map?collection=sentinel-1-rtc&item=S1A_IW_GRDH_1SDV_20210408T121349_20210408T121414_037359_0466FA_rtc"
- type "text/html"
- title "Map of item"
assets
vh
- href "https://sentinel1euwestrtc.blob.core.windows.net/sentinel1-grd-rtc/GRD/2021/4/8/IW/DV/S1A_IW_GRDH_1SDV_20210408T121349_20210408T121414_037359_0466FA_0943/measurement/iw-vh.rtc.tiff"
- type "image/tiff; application=geotiff; profile=cloud-optimized"
- title "VH: vertical transmit, horizontal receive"
- description "Terrain-corrected gamma naught values of signal transmitted with vertical polarization and received with horizontal polarization with radiometric terrain correction applied."
- file:size 1868324949
- file:checksum "b24d81cbe89019caff86ec89392506f7"
raster:bands [] 1 items
0
- nodata -32768
- data_type "float32"
- spatial_resolution 10.0
roles [] 1 items
- 0 "data"
vv
- href "https://sentinel1euwestrtc.blob.core.windows.net/sentinel1-grd-rtc/GRD/2021/4/8/IW/DV/S1A_IW_GRDH_1SDV_20210408T121349_20210408T121414_037359_0466FA_0943/measurement/iw-vv.rtc.tiff"
- type "image/tiff; application=geotiff; profile=cloud-optimized"
- title "VV: vertical transmit, vertical receive"
- description "Terrain-corrected gamma naught values of signal transmitted with vertical polarization and received with vertical polarization with radiometric terrain correction applied."
- file:size 1876432960
- file:checksum "18aca2eec884dd83e5e8b096deaafe8c"
raster:bands [] 1 items
0
- nodata -32768
- data_type "float32"
- spatial_resolution 10.0
roles [] 1 items
- 0 "data"
tilejson
- href "https://planetarycomputer.microsoft.com/api/data/v1/item/tilejson.json?collection=sentinel-1-rtc&item=S1A_IW_GRDH_1SDV_20210408T121349_20210408T121414_037359_0466FA_rtc&assets=vv&assets=vh&tile_format=png&expression=0.03+%2B+log+%2810e-4+-+log+%280.05+%2F+%280.02+%2B+2+%2A+vv%29%29%29%3B0.05+%2B+exp+%280.25+%2A+%28log+%280.01+%2B+2+%2A+vv%29+%2B+log+%280.02+%2B+5+%2A+vh%29%29%29%3B1+-+log+%280.05+%2F+%280.045+-+0.9+%2A+vv%29%29&asset_as_band=True&rescale=0%2C.8000&rescale=0%2C1.000&rescale=0%2C1.000&format=png"
- type "application/json"
- title "TileJSON with default rendering"
roles [] 1 items
- 0 "tiles"
rendered_preview
- href "https://planetarycomputer.microsoft.com/api/data/v1/item/preview.png?collection=sentinel-1-rtc&item=S1A_IW_GRDH_1SDV_20210408T121349_20210408T121414_037359_0466FA_rtc&assets=vv&assets=vh&tile_format=png&expression=0.03+%2B+log+%2810e-4+-+log+%280.05+%2F+%280.02+%2B+2+%2A+vv%29%29%29%3B0.05+%2B+exp+%280.25+%2A+%28log+%280.01+%2B+2+%2A+vv%29+%2B+log+%280.02+%2B+5+%2A+vh%29%29%29%3B1+-+log+%280.05+%2F+%280.045+-+0.9+%2A+vv%29%29&asset_as_band=True&rescale=0%2C.8000&rescale=0%2C1.000&rescale=0%2C1.000&format=png"
- type "image/png"
- title "Rendered preview"
- rel "preview"
roles [] 1 items
- 0 "overview"
bbox [] 4 items
- 0 86.20601633
- 1 26.36650461
- 2 88.98426667
- 3 28.28943277
stac_extensions [] 6 items
- 0 "https://stac-extensions.github.io/sar/v1.0.0/schema.json"
- 1 "https://stac-extensions.github.io/sat/v1.0.0/schema.json"
- 2 "https://stac-extensions.github.io/eo/v1.0.0/schema.json"
- 3 "https://stac-extensions.github.io/projection/v1.0.0/schema.json"
- 4 "https://stac-extensions.github.io/file/v2.0.0/schema.json"
- 5 "https://stac-extensions.github.io/raster/v1.1.0/schema.json"
- collection "sentinel-1-rtc"
119
- type "Feature"
- stac_version "1.0.0"
- id "S1A_IW_GRDH_1SDV_20210403T120542_20210403T120607_037286_046480_rtc"
properties
- datetime "2021-04-03T12:05:54.597722Z"
- platform "SENTINEL-1A"
s1:shape [] 2 items
- 0 28425
- 1 21971
proj:bbox [] 4 items
- 0 618190.0
- 1 2960420.0
- 2 902440.0
- 3 3180130.0
- proj:epsg 32645
proj:shape [] 2 items
- 0 21971
- 1 28425
- end_datetime "2021-04-03 12:06:07.096815+00:00"
- constellation "Sentinel-1"
- s1:resolution "high"
proj:transform [] 9 items
- 0 10.0
- 1 0.0
- 2 618190.0
- 3 0.0
- 4 -10.0
- 5 3180130.0
- 6 0.0
- 7 0.0
- 8 1.0
- s1:datatake_id "287872"
- start_datetime "2021-04-03 12:05:42.098629+00:00"
- s1:orbit_source "DOWNLINK"
- s1:slice_number "6"
- s1:total_slices "21"
- sar:looks_range 5
- sat:orbit_state "ascending"
- sar:product_type "GRD"
- sar:looks_azimuth 1
sar:polarizations [] 2 items
- 0 "VV"
- 1 "VH"
- sar:frequency_band "C"
- sat:absolute_orbit 37286
- sat:relative_orbit 114
- s1:processing_level "1"
- sar:instrument_mode "IW"
- sar:center_frequency 5.405
- sar:resolution_range 20
- s1:product_timeliness "Fast-24h"
- sar:resolution_azimuth 22
- sar:pixel_spacing_range 10
- sar:observation_direction "right"
- sar:pixel_spacing_azimuth 10
- sar:looks_equivalent_number 4.4
- s1:instrument_configuration_ID "6"
- sat:platform_international_designator "2014-016A"
geometry
- type "Polygon"
coordinates [] 1 items
0 [] 14 items
0 [] 2 items
- 0 89.9821388
- 1 27.0124143
1 [] 2 items
- 0 90.9936341
- 1 27.1727468
2 [] 2 items
- 0 90.7247463
- 1 28.6817383
3 [] 2 items
- 0 88.2175788
- 1 28.2795829
4 [] 2 items
- 0 88.3549694
- 1 27.7231978
5 [] 2 items
- 0 88.3298552
- 1 27.5841647
6 [] 2 items
- 0 88.3763871
- 1 27.5218805
7 [] 2 items
- 0 88.357994
- 1 27.4090492
8 [] 2 items
- 0 88.4003683
- 1 27.3364177
9 [] 2 items
- 0 88.3791304
- 1 27.302779
10 [] 2 items
- 0 88.4160098
- 1 27.2069083
11 [] 2 items
- 0 88.4042409
- 1 27.0893171
12 [] 2 items
- 0 88.4753295
- 1 26.7594225
13 [] 2 items
- 0 89.9821388
- 1 27.0124143
links [] 7 items
0
- rel "collection"
- href "https://planetarycomputer.microsoft.com/api/stac/v1/collections/sentinel-1-rtc"
- type "application/json"
1
- rel "parent"
- href "https://planetarycomputer.microsoft.com/api/stac/v1/collections/sentinel-1-rtc"
- type "application/json"
2
- rel "root"
- href "https://planetarycomputer.microsoft.com/api/stac/v1"
- type "application/json"
- title "Microsoft Planetary Computer STAC API"
3
- rel "self"
- href "https://planetarycomputer.microsoft.com/api/stac/v1/collections/sentinel-1-rtc/items/S1A_IW_GRDH_1SDV_20210403T120542_20210403T120607_037286_046480_rtc"
- type "application/geo+json"
4
- rel "license"
- href "https://sentinel.esa.int/documents/247904/690755/Sentinel_Data_Legal_Notice"
5
- rel "derived_from"
- href "https://planetarycomputer.microsoft.com/api/stac/v1/collections/sentinel-1-grd/items/S1A_IW_GRDH_1SDV_20210403T120542_20210403T120607_037286_046480"
- type "application/json"
- title "Sentinel 1 GRD Item"
6
- rel "preview"
- href "https://planetarycomputer.microsoft.com/api/data/v1/item/map?collection=sentinel-1-rtc&item=S1A_IW_GRDH_1SDV_20210403T120542_20210403T120607_037286_046480_rtc"
- type "text/html"
- title "Map of item"
assets
vh
- href "https://sentinel1euwestrtc.blob.core.windows.net/sentinel1-grd-rtc/GRD/2021/4/3/IW/DV/S1A_IW_GRDH_1SDV_20210403T120542_20210403T120607_037286_046480_B51E/measurement/iw-vh.rtc.tiff"
- type "image/tiff; application=geotiff; profile=cloud-optimized"
- title "VH: vertical transmit, horizontal receive"
- description "Terrain-corrected gamma naught values of signal transmitted with vertical polarization and received with horizontal polarization with radiometric terrain correction applied."
- file:size 1850690130
- file:checksum "482cf4e210876f5ff7addfc9b9a77cbd"
raster:bands [] 1 items
0
- nodata -32768
- data_type "float32"
- spatial_resolution 10.0
roles [] 1 items
- 0 "data"
vv
- href "https://sentinel1euwestrtc.blob.core.windows.net/sentinel1-grd-rtc/GRD/2021/4/3/IW/DV/S1A_IW_GRDH_1SDV_20210403T120542_20210403T120607_037286_046480_B51E/measurement/iw-vv.rtc.tiff"
- type "image/tiff; application=geotiff; profile=cloud-optimized"
- title "VV: vertical transmit, vertical receive"
- description "Terrain-corrected gamma naught values of signal transmitted with vertical polarization and received with vertical polarization with radiometric terrain correction applied."
- file:size 1859134985
- file:checksum "7e2e880bc52fc3249d37c051cbb58ecd"
raster:bands [] 1 items
0
- nodata -32768
- data_type "float32"
- spatial_resolution 10.0
roles [] 1 items
- 0 "data"
tilejson
- href "https://planetarycomputer.microsoft.com/api/data/v1/item/tilejson.json?collection=sentinel-1-rtc&item=S1A_IW_GRDH_1SDV_20210403T120542_20210403T120607_037286_046480_rtc&assets=vv&assets=vh&tile_format=png&expression=0.03+%2B+log+%2810e-4+-+log+%280.05+%2F+%280.02+%2B+2+%2A+vv%29%29%29%3B0.05+%2B+exp+%280.25+%2A+%28log+%280.01+%2B+2+%2A+vv%29+%2B+log+%280.02+%2B+5+%2A+vh%29%29%29%3B1+-+log+%280.05+%2F+%280.045+-+0.9+%2A+vv%29%29&asset_as_band=True&rescale=0%2C.8000&rescale=0%2C1.000&rescale=0%2C1.000&format=png"
- type "application/json"
- title "TileJSON with default rendering"
roles [] 1 items
- 0 "tiles"
rendered_preview
- href "https://planetarycomputer.microsoft.com/api/data/v1/item/preview.png?collection=sentinel-1-rtc&item=S1A_IW_GRDH_1SDV_20210403T120542_20210403T120607_037286_046480_rtc&assets=vv&assets=vh&tile_format=png&expression=0.03+%2B+log+%2810e-4+-+log+%280.05+%2F+%280.02+%2B+2+%2A+vv%29%29%29%3B0.05+%2B+exp+%280.25+%2A+%28log+%280.01+%2B+2+%2A+vv%29+%2B+log+%280.02+%2B+5+%2A+vh%29%29%29%3B1+-+log+%280.05+%2F+%280.045+-+0.9+%2A+vv%29%29&asset_as_band=True&rescale=0%2C.8000&rescale=0%2C1.000&rescale=0%2C1.000&format=png"
- type "image/png"
- title "Rendered preview"
- rel "preview"
roles [] 1 items
- 0 "overview"
bbox [] 4 items
- 0 88.21757878
- 1 26.75942245
- 2 90.99363408
- 3 28.68173833
stac_extensions [] 6 items
- 0 "https://stac-extensions.github.io/sar/v1.0.0/schema.json"
- 1 "https://stac-extensions.github.io/sat/v1.0.0/schema.json"
- 2 "https://stac-extensions.github.io/eo/v1.0.0/schema.json"
- 3 "https://stac-extensions.github.io/projection/v1.0.0/schema.json"
- 4 "https://stac-extensions.github.io/file/v2.0.0/schema.json"
- 5 "https://stac-extensions.github.io/raster/v1.1.0/schema.json"
- collection "sentinel-1-rtc"
120
- type "Feature"
- stac_version "1.0.0"
- id "S1A_IW_GRDH_1SDV_20210330T000307_20210330T000332_037220_046230_rtc"
properties
- datetime "2021-03-30T00:03:20.340535Z"
- platform "SENTINEL-1A"
s1:shape [] 2 items
- 0 27531
- 1 21084
proj:bbox [] 4 items
- 0 524440.0
- 1 2980830.0
- 2 799750.0
- 3 3191670.0
- proj:epsg 32645
proj:shape [] 2 items
- 0 21084
- 1 27531
- end_datetime "2021-03-30 00:03:32.839794+00:00"
- constellation "Sentinel-1"
- s1:resolution "high"
proj:transform [] 9 items
- 0 10.0
- 1 0.0
- 2 524440.0
- 3 0.0
- 4 -10.0
- 5 3191670.0
- 6 0.0
- 7 0.0
- 8 1.0
- s1:datatake_id "287280"
- start_datetime "2021-03-30 00:03:07.841277+00:00"
- s1:orbit_source "DOWNLINK"
- s1:slice_number "12"
- s1:total_slices "17"
- sar:looks_range 5
- sat:orbit_state "descending"
- sar:product_type "GRD"
- sar:looks_azimuth 1
sar:polarizations [] 2 items
- 0 "VV"
- 1 "VH"
- sar:frequency_band "C"
- sat:absolute_orbit 37220
- sat:relative_orbit 48
- s1:processing_level "1"
- sar:instrument_mode "IW"
- sar:center_frequency 5.405
- sar:resolution_range 20
- s1:product_timeliness "Fast-24h"
- sar:resolution_azimuth 22
- sar:pixel_spacing_range 10
- sar:observation_direction "right"
- sar:pixel_spacing_azimuth 10
- sar:looks_equivalent_number 4.4
- s1:instrument_configuration_ID "6"
- sat:platform_international_designator "2014-016A"
geometry
- type "Polygon"
coordinates [] 1 items
0 [] 19 items
0 [] 2 items
- 0 89.8035152
- 1 27.0231237
1 [] 2 items
- 0 89.8288853
- 1 27.2745536
2 [] 2 items
- 0 89.9064251
- 1 27.4485192
3 [] 2 items
- 0 89.9211939
- 1 27.6322412
4 [] 2 items
- 0 89.9521143
- 1 27.6784946
5 [] 2 items
- 0 89.9281283
- 1 27.8235189
6 [] 2 items
- 0 89.9438378
- 1 27.9503765
7 [] 2 items
- 0 89.9871388
- 1 28.0029339
8 [] 2 items
- 0 89.9709825
- 1 28.0843779
9 [] 2 items
- 0 89.9972727
- 1 28.1483004
10 [] 2 items
- 0 89.9728294
- 1 28.1917699
11 [] 2 items
- 0 90.0257312
- 1 28.291363
12 [] 2 items
- 0 90.0493403
- 1 28.4416928
13 [] 2 items
- 0 87.5581225
- 1 28.8401163
14 [] 2 items
- 0 87.4255898
- 1 28.1942587
15 [] 2 items
- 0 87.304979
- 1 27.3292913
16 [] 2 items
- 0 89.7845687
- 1 26.9226305
17 [] 2 items
- 0 89.7765394
- 1 26.9953737
18 [] 2 items
- 0 89.8035152
- 1 27.0231237
links [] 7 items
0
- rel "collection"
- href "https://planetarycomputer.microsoft.com/api/stac/v1/collections/sentinel-1-rtc"
- type "application/json"
1
- rel "parent"
- href "https://planetarycomputer.microsoft.com/api/stac/v1/collections/sentinel-1-rtc"
- type "application/json"
2
- rel "root"
- href "https://planetarycomputer.microsoft.com/api/stac/v1"
- type "application/json"
- title "Microsoft Planetary Computer STAC API"
3
- rel "self"
- href "https://planetarycomputer.microsoft.com/api/stac/v1/collections/sentinel-1-rtc/items/S1A_IW_GRDH_1SDV_20210330T000307_20210330T000332_037220_046230_rtc"
- type "application/geo+json"
4
- rel "license"
- href "https://sentinel.esa.int/documents/247904/690755/Sentinel_Data_Legal_Notice"
5
- rel "derived_from"
- href "https://planetarycomputer.microsoft.com/api/stac/v1/collections/sentinel-1-grd/items/S1A_IW_GRDH_1SDV_20210330T000307_20210330T000332_037220_046230"
- type "application/json"
- title "Sentinel 1 GRD Item"
6
- rel "preview"
- href "https://planetarycomputer.microsoft.com/api/data/v1/item/map?collection=sentinel-1-rtc&item=S1A_IW_GRDH_1SDV_20210330T000307_20210330T000332_037220_046230_rtc"
- type "text/html"
- title "Map of item"
assets
vh
- href "https://sentinel1euwestrtc.blob.core.windows.net/sentinel1-grd-rtc/GRD/2021/3/30/IW/DV/S1A_IW_GRDH_1SDV_20210330T000307_20210330T000332_037220_046230_0349/measurement/iw-vh.rtc.tiff"
- type "image/tiff; application=geotiff; profile=cloud-optimized"
- title "VH: vertical transmit, horizontal receive"
- description "Terrain-corrected gamma naught values of signal transmitted with vertical polarization and received with horizontal polarization with radiometric terrain correction applied."
- file:size 1840256361
- file:checksum "64f05846135b33746c2671786bf69cb8"
raster:bands [] 1 items
0
- nodata -32768
- data_type "float32"
- spatial_resolution 10.0
roles [] 1 items
- 0 "data"
vv
- href "https://sentinel1euwestrtc.blob.core.windows.net/sentinel1-grd-rtc/GRD/2021/3/30/IW/DV/S1A_IW_GRDH_1SDV_20210330T000307_20210330T000332_037220_046230_0349/measurement/iw-vv.rtc.tiff"
- type "image/tiff; application=geotiff; profile=cloud-optimized"
- title "VV: vertical transmit, vertical receive"
- description "Terrain-corrected gamma naught values of signal transmitted with vertical polarization and received with vertical polarization with radiometric terrain correction applied."
- file:size 1846854044
- file:checksum "91e8c2854f998792d0554fade346bad4"
raster:bands [] 1 items
0
- nodata -32768
- data_type "float32"
- spatial_resolution 10.0
roles [] 1 items
- 0 "data"
tilejson
- href "https://planetarycomputer.microsoft.com/api/data/v1/item/tilejson.json?collection=sentinel-1-rtc&item=S1A_IW_GRDH_1SDV_20210330T000307_20210330T000332_037220_046230_rtc&assets=vv&assets=vh&tile_format=png&expression=0.03+%2B+log+%2810e-4+-+log+%280.05+%2F+%280.02+%2B+2+%2A+vv%29%29%29%3B0.05+%2B+exp+%280.25+%2A+%28log+%280.01+%2B+2+%2A+vv%29+%2B+log+%280.02+%2B+5+%2A+vh%29%29%29%3B1+-+log+%280.05+%2F+%280.045+-+0.9+%2A+vv%29%29&asset_as_band=True&rescale=0%2C.8000&rescale=0%2C1.000&rescale=0%2C1.000&format=png"
- type "application/json"
- title "TileJSON with default rendering"
roles [] 1 items
- 0 "tiles"
rendered_preview
- href "https://planetarycomputer.microsoft.com/api/data/v1/item/preview.png?collection=sentinel-1-rtc&item=S1A_IW_GRDH_1SDV_20210330T000307_20210330T000332_037220_046230_rtc&assets=vv&assets=vh&tile_format=png&expression=0.03+%2B+log+%2810e-4+-+log+%280.05+%2F+%280.02+%2B+2+%2A+vv%29%29%29%3B0.05+%2B+exp+%280.25+%2A+%28log+%280.01+%2B+2+%2A+vv%29+%2B+log+%280.02+%2B+5+%2A+vh%29%29%29%3B1+-+log+%280.05+%2F+%280.045+-+0.9+%2A+vv%29%29&asset_as_band=True&rescale=0%2C.8000&rescale=0%2C1.000&rescale=0%2C1.000&format=png"
- type "image/png"
- title "Rendered preview"
- rel "preview"
roles [] 1 items
- 0 "overview"
bbox [] 4 items
- 0 87.30497903
- 1 26.92263053
- 2 90.04934029
- 3 28.84011632
stac_extensions [] 6 items
- 0 "https://stac-extensions.github.io/sar/v1.0.0/schema.json"
- 1 "https://stac-extensions.github.io/sat/v1.0.0/schema.json"
- 2 "https://stac-extensions.github.io/eo/v1.0.0/schema.json"
- 3 "https://stac-extensions.github.io/projection/v1.0.0/schema.json"
- 4 "https://stac-extensions.github.io/file/v2.0.0/schema.json"
- 5 "https://stac-extensions.github.io/raster/v1.1.0/schema.json"
- collection "sentinel-1-rtc"
121
- type "Feature"
- stac_version "1.0.0"
- id "S1A_IW_GRDH_1SDV_20210327T121349_20210327T121414_037184_0460F2_rtc"
properties
- datetime "2021-03-27T12:14:01.688939Z"
- platform "SENTINEL-1A"
s1:shape [] 2 items
- 0 28239
- 1 21598
proj:bbox [] 4 items
- 0 420930.0
- 1 2916200.0
- 2 703320.0
- 3 3132180.0
- proj:epsg 32645
proj:shape [] 2 items
- 0 21598
- 1 28239
- end_datetime "2021-03-27 12:14:14.187996+00:00"
- constellation "Sentinel-1"
- s1:resolution "high"
proj:transform [] 9 items
- 0 10.0
- 1 0.0
- 2 420930.0
- 3 0.0
- 4 -10.0
- 5 3132180.0
- 6 0.0
- 7 0.0
- 8 1.0
- s1:datatake_id "286962"
- start_datetime "2021-03-27 12:13:49.189882+00:00"
- s1:orbit_source "DOWNLINK"
- s1:slice_number "6"
- s1:total_slices "20"
- sar:looks_range 5
- sat:orbit_state "ascending"
- sar:product_type "GRD"
- sar:looks_azimuth 1
sar:polarizations [] 2 items
- 0 "VV"
- 1 "VH"
- sar:frequency_band "C"
- sat:absolute_orbit 37184
- sat:relative_orbit 12
- s1:processing_level "1"
- sar:instrument_mode "IW"
- sar:center_frequency 5.405
- sar:resolution_range 20
- s1:product_timeliness "Fast-24h"
- sar:resolution_azimuth 22
- sar:pixel_spacing_range 10
- sar:observation_direction "right"
- sar:pixel_spacing_azimuth 10
- sar:looks_equivalent_number 4.4
- s1:instrument_configuration_ID "6"
- sat:platform_international_designator "2014-016A"
geometry
- type "Polygon"
coordinates [] 1 items
0 [] 16 items
0 [] 2 items
- 0 87.8607112
- 1 26.5968306
1 [] 2 items
- 0 86.4989777
- 1 26.366324
2 [] 2 items
- 0 86.355234
- 1 27.1610293
3 [] 2 items
- 0 86.3184707
- 1 27.2314542
4 [] 2 items
- 0 86.3267791
- 1 27.3777454
5 [] 2 items
- 0 86.2773708
- 1 27.4644345
6 [] 2 items
- 0 86.2706694
- 1 27.6974876
7 [] 2 items
- 0 86.2161929
- 1 27.7562277
8 [] 2 items
- 0 86.2345862
- 1 27.7814262
9 [] 2 items
- 0 86.2099137
- 1 27.7826414
10 [] 2 items
- 0 86.2037621
- 1 27.8467884
11 [] 2 items
- 0 86.210874
- 1 27.8814478
12 [] 2 items
- 0 88.7378413
- 1 28.289251
13 [] 2 items
- 0 88.9223382
- 1 27.3276824
14 [] 2 items
- 0 88.9845651
- 1 26.7767183
15 [] 2 items
- 0 87.8607112
- 1 26.5968306
links [] 7 items
0
- rel "collection"
- href "https://planetarycomputer.microsoft.com/api/stac/v1/collections/sentinel-1-rtc"
- type "application/json"
1
- rel "parent"
- href "https://planetarycomputer.microsoft.com/api/stac/v1/collections/sentinel-1-rtc"
- type "application/json"
2
- rel "root"
- href "https://planetarycomputer.microsoft.com/api/stac/v1"
- type "application/json"
- title "Microsoft Planetary Computer STAC API"
3
- rel "self"
- href "https://planetarycomputer.microsoft.com/api/stac/v1/collections/sentinel-1-rtc/items/S1A_IW_GRDH_1SDV_20210327T121349_20210327T121414_037184_0460F2_rtc"
- type "application/geo+json"
4
- rel "license"
- href "https://sentinel.esa.int/documents/247904/690755/Sentinel_Data_Legal_Notice"
5
- rel "derived_from"
- href "https://planetarycomputer.microsoft.com/api/stac/v1/collections/sentinel-1-grd/items/S1A_IW_GRDH_1SDV_20210327T121349_20210327T121414_037184_0460F2"
- type "application/json"
- title "Sentinel 1 GRD Item"
6
- rel "preview"
- href "https://planetarycomputer.microsoft.com/api/data/v1/item/map?collection=sentinel-1-rtc&item=S1A_IW_GRDH_1SDV_20210327T121349_20210327T121414_037184_0460F2_rtc"
- type "text/html"
- title "Map of item"
assets
vh
- href "https://sentinel1euwestrtc.blob.core.windows.net/sentinel1-grd-rtc/GRD/2021/3/27/IW/DV/S1A_IW_GRDH_1SDV_20210327T121349_20210327T121414_037184_0460F2_DCA6/measurement/iw-vh.rtc.tiff"
- type "image/tiff; application=geotiff; profile=cloud-optimized"
- title "VH: vertical transmit, horizontal receive"
- description "Terrain-corrected gamma naught values of signal transmitted with vertical polarization and received with horizontal polarization with radiometric terrain correction applied."
- file:size 1868773937
- file:checksum "a144b440fc73caed629b81a85048acc1"
raster:bands [] 1 items
0
- nodata -32768
- data_type "float32"
- spatial_resolution 10.0
roles [] 1 items
- 0 "data"
vv
- href "https://sentinel1euwestrtc.blob.core.windows.net/sentinel1-grd-rtc/GRD/2021/3/27/IW/DV/S1A_IW_GRDH_1SDV_20210327T121349_20210327T121414_037184_0460F2_DCA6/measurement/iw-vv.rtc.tiff"
- type "image/tiff; application=geotiff; profile=cloud-optimized"
- title "VV: vertical transmit, vertical receive"
- description "Terrain-corrected gamma naught values of signal transmitted with vertical polarization and received with vertical polarization with radiometric terrain correction applied."
- file:size 1876794561
- file:checksum "8d9ea8dccc9c50949b6cb96ec1d11262"
raster:bands [] 1 items
0
- nodata -32768
- data_type "float32"
- spatial_resolution 10.0
roles [] 1 items
- 0 "data"
tilejson
- href "https://planetarycomputer.microsoft.com/api/data/v1/item/tilejson.json?collection=sentinel-1-rtc&item=S1A_IW_GRDH_1SDV_20210327T121349_20210327T121414_037184_0460F2_rtc&assets=vv&assets=vh&tile_format=png&expression=0.03+%2B+log+%2810e-4+-+log+%280.05+%2F+%280.02+%2B+2+%2A+vv%29%29%29%3B0.05+%2B+exp+%280.25+%2A+%28log+%280.01+%2B+2+%2A+vv%29+%2B+log+%280.02+%2B+5+%2A+vh%29%29%29%3B1+-+log+%280.05+%2F+%280.045+-+0.9+%2A+vv%29%29&asset_as_band=True&rescale=0%2C.8000&rescale=0%2C1.000&rescale=0%2C1.000&format=png"
- type "application/json"
- title "TileJSON with default rendering"
roles [] 1 items
- 0 "tiles"
rendered_preview
- href "https://planetarycomputer.microsoft.com/api/data/v1/item/preview.png?collection=sentinel-1-rtc&item=S1A_IW_GRDH_1SDV_20210327T121349_20210327T121414_037184_0460F2_rtc&assets=vv&assets=vh&tile_format=png&expression=0.03+%2B+log+%2810e-4+-+log+%280.05+%2F+%280.02+%2B+2+%2A+vv%29%29%29%3B0.05+%2B+exp+%280.25+%2A+%28log+%280.01+%2B+2+%2A+vv%29+%2B+log+%280.02+%2B+5+%2A+vh%29%29%29%3B1+-+log+%280.05+%2F+%280.045+-+0.9+%2A+vv%29%29&asset_as_band=True&rescale=0%2C.8000&rescale=0%2C1.000&rescale=0%2C1.000&format=png"
- type "image/png"
- title "Rendered preview"
- rel "preview"
roles [] 1 items
- 0 "overview"
bbox [] 4 items
- 0 86.20376212
- 1 26.36632403
- 2 88.98456513
- 3 28.28925102
stac_extensions [] 6 items
- 0 "https://stac-extensions.github.io/sar/v1.0.0/schema.json"
- 1 "https://stac-extensions.github.io/sat/v1.0.0/schema.json"
- 2 "https://stac-extensions.github.io/eo/v1.0.0/schema.json"
- 3 "https://stac-extensions.github.io/projection/v1.0.0/schema.json"
- 4 "https://stac-extensions.github.io/file/v2.0.0/schema.json"
- 5 "https://stac-extensions.github.io/raster/v1.1.0/schema.json"
- collection "sentinel-1-rtc"
122
- type "Feature"
- stac_version "1.0.0"
- id "S1A_IW_GRDH_1SDV_20210322T120541_20210322T120606_037111_045E7A_rtc"
properties
- datetime "2021-03-22T12:05:54.345504Z"
- platform "SENTINEL-1A"
s1:shape [] 2 items
- 0 28428
- 1 21972
proj:bbox [] 4 items
- 0 618160.0
- 1 2960420.0
- 2 902440.0
- 3 3180140.0
- proj:epsg 32645
proj:shape [] 2 items
- 0 21972
- 1 28428
- end_datetime "2021-03-22 12:06:06.845375+00:00"
- constellation "Sentinel-1"
- s1:resolution "high"
proj:transform [] 9 items
- 0 10.0
- 1 0.0
- 2 618160.0
- 3 0.0
- 4 -10.0
- 5 3180140.0
- 6 0.0
- 7 0.0
- 8 1.0
- s1:datatake_id "286330"
- start_datetime "2021-03-22 12:05:41.845632+00:00"
- s1:orbit_source "DOWNLINK"
- s1:slice_number "6"
- s1:total_slices "21"
- sar:looks_range 5
- sat:orbit_state "ascending"
- sar:product_type "GRD"
- sar:looks_azimuth 1
sar:polarizations [] 2 items
- 0 "VV"
- 1 "VH"
- sar:frequency_band "C"
- sat:absolute_orbit 37111
- sat:relative_orbit 114
- s1:processing_level "1"
- sar:instrument_mode "IW"
- sar:center_frequency 5.405
- sar:resolution_range 20
- s1:product_timeliness "Fast-24h"
- sar:resolution_azimuth 22
- sar:pixel_spacing_range 10
- sar:observation_direction "right"
- sar:pixel_spacing_azimuth 10
- sar:looks_equivalent_number 4.4
- s1:instrument_configuration_ID "6"
- sat:platform_international_designator "2014-016A"
geometry
- type "Polygon"
coordinates [] 1 items
0 [] 14 items
0 [] 2 items
- 0 89.9825438
- 1 27.012496
1 [] 2 items
- 0 90.9935334
- 1 27.1727497
2 [] 2 items
- 0 90.7245453
- 1 28.681834
3 [] 2 items
- 0 88.217274
- 1 28.2796758
4 [] 2 items
- 0 88.3545626
- 1 27.7231115
5 [] 2 items
- 0 88.3295524
- 1 27.5842579
6 [] 2 items
- 0 88.3760845
- 1 27.5219738
7 [] 2 items
- 0 88.3576895
- 1 27.4089619
8 [] 2 items
- 0 88.4000652
- 1 27.3364208
9 [] 2 items
- 0 88.3790261
- 1 27.3025093
10 [] 2 items
- 0 88.4159077
- 1 27.2068191
11 [] 2 items
- 0 88.4039384
- 1 27.0893202
12 [] 2 items
- 0 88.4750267
- 1 26.7593353
13 [] 2 items
- 0 89.9825438
- 1 27.012496
links [] 7 items
0
- rel "collection"
- href "https://planetarycomputer.microsoft.com/api/stac/v1/collections/sentinel-1-rtc"
- type "application/json"
1
- rel "parent"
- href "https://planetarycomputer.microsoft.com/api/stac/v1/collections/sentinel-1-rtc"
- type "application/json"
2
- rel "root"
- href "https://planetarycomputer.microsoft.com/api/stac/v1"
- type "application/json"
- title "Microsoft Planetary Computer STAC API"
3
- rel "self"
- href "https://planetarycomputer.microsoft.com/api/stac/v1/collections/sentinel-1-rtc/items/S1A_IW_GRDH_1SDV_20210322T120541_20210322T120606_037111_045E7A_rtc"
- type "application/geo+json"
4
- rel "license"
- href "https://sentinel.esa.int/documents/247904/690755/Sentinel_Data_Legal_Notice"
5
- rel "derived_from"
- href "https://planetarycomputer.microsoft.com/api/stac/v1/collections/sentinel-1-grd/items/S1A_IW_GRDH_1SDV_20210322T120541_20210322T120606_037111_045E7A"
- type "application/json"
- title "Sentinel 1 GRD Item"
6
- rel "preview"
- href "https://planetarycomputer.microsoft.com/api/data/v1/item/map?collection=sentinel-1-rtc&item=S1A_IW_GRDH_1SDV_20210322T120541_20210322T120606_037111_045E7A_rtc"
- type "text/html"
- title "Map of item"
assets
vh
- href "https://sentinel1euwestrtc.blob.core.windows.net/sentinel1-grd-rtc/GRD/2021/3/22/IW/DV/S1A_IW_GRDH_1SDV_20210322T120541_20210322T120606_037111_045E7A_6E29/measurement/iw-vh.rtc.tiff"
- type "image/tiff; application=geotiff; profile=cloud-optimized"
- title "VH: vertical transmit, horizontal receive"
- description "Terrain-corrected gamma naught values of signal transmitted with vertical polarization and received with horizontal polarization with radiometric terrain correction applied."
- file:size 1852849134
- file:checksum "ca05a1fb3fed07389840431dba51b3a6"
raster:bands [] 1 items
0
- nodata -32768
- data_type "float32"
- spatial_resolution 10.0
roles [] 1 items
- 0 "data"
vv
- href "https://sentinel1euwestrtc.blob.core.windows.net/sentinel1-grd-rtc/GRD/2021/3/22/IW/DV/S1A_IW_GRDH_1SDV_20210322T120541_20210322T120606_037111_045E7A_6E29/measurement/iw-vv.rtc.tiff"
- type "image/tiff; application=geotiff; profile=cloud-optimized"
- title "VV: vertical transmit, vertical receive"
- description "Terrain-corrected gamma naught values of signal transmitted with vertical polarization and received with vertical polarization with radiometric terrain correction applied."
- file:size 1861208127
- file:checksum "175e4ab087a06d83d97c22186fb340be"
raster:bands [] 1 items
0
- nodata -32768
- data_type "float32"
- spatial_resolution 10.0
roles [] 1 items
- 0 "data"
tilejson
- href "https://planetarycomputer.microsoft.com/api/data/v1/item/tilejson.json?collection=sentinel-1-rtc&item=S1A_IW_GRDH_1SDV_20210322T120541_20210322T120606_037111_045E7A_rtc&assets=vv&assets=vh&tile_format=png&expression=0.03+%2B+log+%2810e-4+-+log+%280.05+%2F+%280.02+%2B+2+%2A+vv%29%29%29%3B0.05+%2B+exp+%280.25+%2A+%28log+%280.01+%2B+2+%2A+vv%29+%2B+log+%280.02+%2B+5+%2A+vh%29%29%29%3B1+-+log+%280.05+%2F+%280.045+-+0.9+%2A+vv%29%29&asset_as_band=True&rescale=0%2C.8000&rescale=0%2C1.000&rescale=0%2C1.000&format=png"
- type "application/json"
- title "TileJSON with default rendering"
roles [] 1 items
- 0 "tiles"
rendered_preview
- href "https://planetarycomputer.microsoft.com/api/data/v1/item/preview.png?collection=sentinel-1-rtc&item=S1A_IW_GRDH_1SDV_20210322T120541_20210322T120606_037111_045E7A_rtc&assets=vv&assets=vh&tile_format=png&expression=0.03+%2B+log+%2810e-4+-+log+%280.05+%2F+%280.02+%2B+2+%2A+vv%29%29%29%3B0.05+%2B+exp+%280.25+%2A+%28log+%280.01+%2B+2+%2A+vv%29+%2B+log+%280.02+%2B+5+%2A+vh%29%29%29%3B1+-+log+%280.05+%2F+%280.045+-+0.9+%2A+vv%29%29&asset_as_band=True&rescale=0%2C.8000&rescale=0%2C1.000&rescale=0%2C1.000&format=png"
- type "image/png"
- title "Rendered preview"
- rel "preview"
roles [] 1 items
- 0 "overview"
bbox [] 4 items
- 0 88.21727397
- 1 26.75933533
- 2 90.99353338
- 3 28.68183403
stac_extensions [] 6 items
- 0 "https://stac-extensions.github.io/sar/v1.0.0/schema.json"
- 1 "https://stac-extensions.github.io/sat/v1.0.0/schema.json"
- 2 "https://stac-extensions.github.io/eo/v1.0.0/schema.json"
- 3 "https://stac-extensions.github.io/projection/v1.0.0/schema.json"
- 4 "https://stac-extensions.github.io/file/v2.0.0/schema.json"
- 5 "https://stac-extensions.github.io/raster/v1.1.0/schema.json"
- collection "sentinel-1-rtc"
123
- type "Feature"
- stac_version "1.0.0"
- id "S1A_IW_GRDH_1SDV_20210318T000307_20210318T000332_037045_045C26_rtc"
properties
- datetime "2021-03-18T00:03:19.961567Z"
- platform "SENTINEL-1A"
s1:shape [] 2 items
- 0 27532
- 1 21082
proj:bbox [] 4 items
- 0 524520.0
- 1 2980860.0
- 2 799840.0
- 3 3191680.0
- proj:epsg 32645
proj:shape [] 2 items
- 0 21082
- 1 27532
- end_datetime "2021-03-18 00:03:32.460896+00:00"
- constellation "Sentinel-1"
- s1:resolution "high"
proj:transform [] 9 items
- 0 10.0
- 1 0.0
- 2 524520.0
- 3 0.0
- 4 -10.0
- 5 3191680.0
- 6 0.0
- 7 0.0
- 8 1.0
- s1:datatake_id "285734"
- start_datetime "2021-03-18 00:03:07.462239+00:00"
- s1:orbit_source "RESORB"
- s1:slice_number "12"
- s1:total_slices "17"
- sar:looks_range 5
- sat:orbit_state "descending"
- sar:product_type "GRD"
- sar:looks_azimuth 1
sar:polarizations [] 2 items
- 0 "VV"
- 1 "VH"
- sar:frequency_band "C"
- sat:absolute_orbit 37045
- sat:relative_orbit 48
- s1:processing_level "1"
- sar:instrument_mode "IW"
- sar:center_frequency 5.405
- sar:resolution_range 20
- s1:product_timeliness "Fast-24h"
- sar:resolution_azimuth 22
- sar:pixel_spacing_range 10
- sar:observation_direction "right"
- sar:pixel_spacing_azimuth 10
- sar:looks_equivalent_number 4.4
- s1:instrument_configuration_ID "6"
- sat:platform_international_designator "2014-016A"
geometry
- type "Polygon"
coordinates [] 1 items
0 [] 16 items
0 [] 2 items
- 0 89.8055133
- 1 27.0224523
1 [] 2 items
- 0 89.7784277
- 1 26.994344
2 [] 2 items
- 0 89.7848771
- 1 26.9228951
3 [] 2 items
- 0 87.3058925
- 1 27.3306435
4 [] 2 items
- 0 87.4266091
- 1 28.1943458
5 [] 2 items
- 0 87.5598656
- 1 28.8401994
6 [] 2 items
- 0 90.0502633
- 1 28.4418525
7 [] 2 items
- 0 89.986175
- 1 28.1884123
8 [] 2 items
- 0 89.9885135
- 1 28.0011901
9 [] 2 items
- 0 89.9456054
- 1 27.9518721
10 [] 2 items
- 0 89.9320214
- 1 27.8513105
11 [] 2 items
- 0 89.953221
- 1 27.6782004
12 [] 2 items
- 0 89.9235912
- 1 27.6385956
13 [] 2 items
- 0 89.9036702
- 1 27.4282787
14 [] 2 items
- 0 89.8300045
- 1 27.2748918
15 [] 2 items
- 0 89.8055133
- 1 27.0224523
links [] 7 items
0
- rel "collection"
- href "https://planetarycomputer.microsoft.com/api/stac/v1/collections/sentinel-1-rtc"
- type "application/json"
1
- rel "parent"
- href "https://planetarycomputer.microsoft.com/api/stac/v1/collections/sentinel-1-rtc"
- type "application/json"
2
- rel "root"
- href "https://planetarycomputer.microsoft.com/api/stac/v1"
- type "application/json"
- title "Microsoft Planetary Computer STAC API"
3
- rel "self"
- href "https://planetarycomputer.microsoft.com/api/stac/v1/collections/sentinel-1-rtc/items/S1A_IW_GRDH_1SDV_20210318T000307_20210318T000332_037045_045C26_rtc"
- type "application/geo+json"
4
- rel "license"
- href "https://sentinel.esa.int/documents/247904/690755/Sentinel_Data_Legal_Notice"
5
- rel "derived_from"
- href "https://planetarycomputer.microsoft.com/api/stac/v1/collections/sentinel-1-grd/items/S1A_IW_GRDH_1SDV_20210318T000307_20210318T000332_037045_045C26"
- type "application/json"
- title "Sentinel 1 GRD Item"
6
- rel "preview"
- href "https://planetarycomputer.microsoft.com/api/data/v1/item/map?collection=sentinel-1-rtc&item=S1A_IW_GRDH_1SDV_20210318T000307_20210318T000332_037045_045C26_rtc"
- type "text/html"
- title "Map of item"
assets
vh
- href "https://sentinel1euwestrtc.blob.core.windows.net/sentinel1-grd-rtc/GRD/2021/3/18/IW/DV/S1A_IW_GRDH_1SDV_20210318T000307_20210318T000332_037045_045C26_F988/measurement/iw-vh.rtc.tiff"
- type "image/tiff; application=geotiff; profile=cloud-optimized"
- title "VH: vertical transmit, horizontal receive"
- description "Terrain-corrected gamma naught values of signal transmitted with vertical polarization and received with horizontal polarization with radiometric terrain correction applied."
- file:size 1841803775
- file:checksum "27f45b7d4cbf705675e5c969361d4d3c"
raster:bands [] 1 items
0
- nodata -32768
- data_type "float32"
- spatial_resolution 10.0
roles [] 1 items
- 0 "data"
vv
- href "https://sentinel1euwestrtc.blob.core.windows.net/sentinel1-grd-rtc/GRD/2021/3/18/IW/DV/S1A_IW_GRDH_1SDV_20210318T000307_20210318T000332_037045_045C26_F988/measurement/iw-vv.rtc.tiff"
- type "image/tiff; application=geotiff; profile=cloud-optimized"
- title "VV: vertical transmit, vertical receive"
- description "Terrain-corrected gamma naught values of signal transmitted with vertical polarization and received with vertical polarization with radiometric terrain correction applied."
- file:size 1848608152
- file:checksum "e3f20b300ed714a30f9957b92c92d24f"
raster:bands [] 1 items
0
- nodata -32768
- data_type "float32"
- spatial_resolution 10.0
roles [] 1 items
- 0 "data"
tilejson
- href "https://planetarycomputer.microsoft.com/api/data/v1/item/tilejson.json?collection=sentinel-1-rtc&item=S1A_IW_GRDH_1SDV_20210318T000307_20210318T000332_037045_045C26_rtc&assets=vv&assets=vh&tile_format=png&expression=0.03+%2B+log+%2810e-4+-+log+%280.05+%2F+%280.02+%2B+2+%2A+vv%29%29%29%3B0.05+%2B+exp+%280.25+%2A+%28log+%280.01+%2B+2+%2A+vv%29+%2B+log+%280.02+%2B+5+%2A+vh%29%29%29%3B1+-+log+%280.05+%2F+%280.045+-+0.9+%2A+vv%29%29&asset_as_band=True&rescale=0%2C.8000&rescale=0%2C1.000&rescale=0%2C1.000&format=png"
- type "application/json"
- title "TileJSON with default rendering"
roles [] 1 items
- 0 "tiles"
rendered_preview
- href "https://planetarycomputer.microsoft.com/api/data/v1/item/preview.png?collection=sentinel-1-rtc&item=S1A_IW_GRDH_1SDV_20210318T000307_20210318T000332_037045_045C26_rtc&assets=vv&assets=vh&tile_format=png&expression=0.03+%2B+log+%2810e-4+-+log+%280.05+%2F+%280.02+%2B+2+%2A+vv%29%29%29%3B0.05+%2B+exp+%280.25+%2A+%28log+%280.01+%2B+2+%2A+vv%29+%2B+log+%280.02+%2B+5+%2A+vh%29%29%29%3B1+-+log+%280.05+%2F+%280.045+-+0.9+%2A+vv%29%29&asset_as_band=True&rescale=0%2C.8000&rescale=0%2C1.000&rescale=0%2C1.000&format=png"
- type "image/png"
- title "Rendered preview"
- rel "preview"
roles [] 1 items
- 0 "overview"
bbox [] 4 items
- 0 87.30589252
- 1 26.92289511
- 2 90.05026329
- 3 28.84019936
stac_extensions [] 6 items
- 0 "https://stac-extensions.github.io/sar/v1.0.0/schema.json"
- 1 "https://stac-extensions.github.io/sat/v1.0.0/schema.json"
- 2 "https://stac-extensions.github.io/eo/v1.0.0/schema.json"
- 3 "https://stac-extensions.github.io/projection/v1.0.0/schema.json"
- 4 "https://stac-extensions.github.io/file/v2.0.0/schema.json"
- 5 "https://stac-extensions.github.io/raster/v1.1.0/schema.json"
- collection "sentinel-1-rtc"
124
- type "Feature"
- stac_version "1.0.0"
- id "S1A_IW_GRDH_1SDV_20210315T121348_20210315T121413_037009_045AE4_rtc"
properties
- datetime "2021-03-15T12:14:01.353874Z"
- platform "SENTINEL-1A"
s1:shape [] 2 items
- 0 28240
- 1 21598
proj:bbox [] 4 items
- 0 420930.0
- 1 2916200.0
- 2 703330.0
- 3 3132180.0
- proj:epsg 32645
proj:shape [] 2 items
- 0 21598
- 1 28240
- end_datetime "2021-03-15 12:14:13.852977+00:00"
- constellation "Sentinel-1"
- s1:resolution "high"
proj:transform [] 9 items
- 0 10.0
- 1 0.0
- 2 420930.0
- 3 0.0
- 4 -10.0
- 5 3132180.0
- 6 0.0
- 7 0.0
- 8 1.0
- s1:datatake_id "285412"
- start_datetime "2021-03-15 12:13:48.854771+00:00"
- s1:orbit_source "RESORB"
- s1:slice_number "6"
- s1:total_slices "20"
- sar:looks_range 5
- sat:orbit_state "ascending"
- sar:product_type "GRD"
- sar:looks_azimuth 1
sar:polarizations [] 2 items
- 0 "VV"
- 1 "VH"
- sar:frequency_band "C"
- sat:absolute_orbit 37009
- sat:relative_orbit 12
- s1:processing_level "1"
- sar:instrument_mode "IW"
- sar:center_frequency 5.405
- sar:resolution_range 20
- s1:product_timeliness "Fast-24h"
- sar:resolution_azimuth 22
- sar:pixel_spacing_range 10
- sar:observation_direction "right"
- sar:pixel_spacing_azimuth 10
- sar:looks_equivalent_number 4.4
- s1:instrument_configuration_ID "6"
- sat:platform_international_designator "2014-016A"
geometry
- type "Polygon"
coordinates [] 1 items
0 [] 16 items
0 [] 2 items
- 0 87.8607112
- 1 26.5968306
1 [] 2 items
- 0 86.4989777
- 1 26.366324
2 [] 2 items
- 0 86.355233
- 1 27.1612098
3 [] 2 items
- 0 86.3185734
- 1 27.2311839
4 [] 2 items
- 0 86.3268807
- 1 27.3776556
5 [] 2 items
- 0 86.2773702
- 1 27.4645247
6 [] 2 items
- 0 86.2706688
- 1 27.6975779
7 [] 2 items
- 0 86.2161922
- 1 27.756318
8 [] 2 items
- 0 86.2345856
- 1 27.7815165
9 [] 2 items
- 0 86.2100159
- 1 27.7825517
10 [] 2 items
- 0 86.2037628
- 1 27.8466981
11 [] 2 items
- 0 86.210874
- 1 27.8814478
12 [] 2 items
- 0 88.7380451
- 1 28.2892484
13 [] 2 items
- 0 88.9224408
- 1 27.3277712
14 [] 2 items
- 0 88.9845651
- 1 26.7767183
15 [] 2 items
- 0 87.8607112
- 1 26.5968306
links [] 7 items
0
- rel "collection"
- href "https://planetarycomputer.microsoft.com/api/stac/v1/collections/sentinel-1-rtc"
- type "application/json"
1
- rel "parent"
- href "https://planetarycomputer.microsoft.com/api/stac/v1/collections/sentinel-1-rtc"
- type "application/json"
2
- rel "root"
- href "https://planetarycomputer.microsoft.com/api/stac/v1"
- type "application/json"
- title "Microsoft Planetary Computer STAC API"
3
- rel "self"
- href "https://planetarycomputer.microsoft.com/api/stac/v1/collections/sentinel-1-rtc/items/S1A_IW_GRDH_1SDV_20210315T121348_20210315T121413_037009_045AE4_rtc"
- type "application/geo+json"
4
- rel "license"
- href "https://sentinel.esa.int/documents/247904/690755/Sentinel_Data_Legal_Notice"
5
- rel "derived_from"
- href "https://planetarycomputer.microsoft.com/api/stac/v1/collections/sentinel-1-grd/items/S1A_IW_GRDH_1SDV_20210315T121348_20210315T121413_037009_045AE4"
- type "application/json"
- title "Sentinel 1 GRD Item"
6
- rel "preview"
- href "https://planetarycomputer.microsoft.com/api/data/v1/item/map?collection=sentinel-1-rtc&item=S1A_IW_GRDH_1SDV_20210315T121348_20210315T121413_037009_045AE4_rtc"
- type "text/html"
- title "Map of item"
assets
vh
- href "https://sentinel1euwestrtc.blob.core.windows.net/sentinel1-grd-rtc/GRD/2021/3/15/IW/DV/S1A_IW_GRDH_1SDV_20210315T121348_20210315T121413_037009_045AE4_6925/measurement/iw-vh.rtc.tiff"
- type "image/tiff; application=geotiff; profile=cloud-optimized"
- title "VH: vertical transmit, horizontal receive"
- description "Terrain-corrected gamma naught values of signal transmitted with vertical polarization and received with horizontal polarization with radiometric terrain correction applied."
- file:size 1870790475
- file:checksum "6c24f0674a983da87ea443e40eb3134d"
raster:bands [] 1 items
0
- nodata -32768
- data_type "float32"
- spatial_resolution 10.0
roles [] 1 items
- 0 "data"
vv
- href "https://sentinel1euwestrtc.blob.core.windows.net/sentinel1-grd-rtc/GRD/2021/3/15/IW/DV/S1A_IW_GRDH_1SDV_20210315T121348_20210315T121413_037009_045AE4_6925/measurement/iw-vv.rtc.tiff"
- type "image/tiff; application=geotiff; profile=cloud-optimized"
- title "VV: vertical transmit, vertical receive"
- description "Terrain-corrected gamma naught values of signal transmitted with vertical polarization and received with vertical polarization with radiometric terrain correction applied."
- file:size 1878757013
- file:checksum "e8ec5d8b2b6ba85282a67b0df2c2a499"
raster:bands [] 1 items
0
- nodata -32768
- data_type "float32"
- spatial_resolution 10.0
roles [] 1 items
- 0 "data"
tilejson
- href "https://planetarycomputer.microsoft.com/api/data/v1/item/tilejson.json?collection=sentinel-1-rtc&item=S1A_IW_GRDH_1SDV_20210315T121348_20210315T121413_037009_045AE4_rtc&assets=vv&assets=vh&tile_format=png&expression=0.03+%2B+log+%2810e-4+-+log+%280.05+%2F+%280.02+%2B+2+%2A+vv%29%29%29%3B0.05+%2B+exp+%280.25+%2A+%28log+%280.01+%2B+2+%2A+vv%29+%2B+log+%280.02+%2B+5+%2A+vh%29%29%29%3B1+-+log+%280.05+%2F+%280.045+-+0.9+%2A+vv%29%29&asset_as_band=True&rescale=0%2C.8000&rescale=0%2C1.000&rescale=0%2C1.000&format=png"
- type "application/json"
- title "TileJSON with default rendering"
roles [] 1 items
- 0 "tiles"
rendered_preview
- href "https://planetarycomputer.microsoft.com/api/data/v1/item/preview.png?collection=sentinel-1-rtc&item=S1A_IW_GRDH_1SDV_20210315T121348_20210315T121413_037009_045AE4_rtc&assets=vv&assets=vh&tile_format=png&expression=0.03+%2B+log+%2810e-4+-+log+%280.05+%2F+%280.02+%2B+2+%2A+vv%29%29%29%3B0.05+%2B+exp+%280.25+%2A+%28log+%280.01+%2B+2+%2A+vv%29+%2B+log+%280.02+%2B+5+%2A+vh%29%29%29%3B1+-+log+%280.05+%2F+%280.045+-+0.9+%2A+vv%29%29&asset_as_band=True&rescale=0%2C.8000&rescale=0%2C1.000&rescale=0%2C1.000&format=png"
- type "image/png"
- title "Rendered preview"
- rel "preview"
roles [] 1 items
- 0 "overview"
bbox [] 4 items
- 0 86.20376278
- 1 26.36632403
- 2 88.98456513
- 3 28.28924842
stac_extensions [] 6 items
- 0 "https://stac-extensions.github.io/sar/v1.0.0/schema.json"
- 1 "https://stac-extensions.github.io/sat/v1.0.0/schema.json"
- 2 "https://stac-extensions.github.io/eo/v1.0.0/schema.json"
- 3 "https://stac-extensions.github.io/projection/v1.0.0/schema.json"
- 4 "https://stac-extensions.github.io/file/v2.0.0/schema.json"
- 5 "https://stac-extensions.github.io/raster/v1.1.0/schema.json"
- collection "sentinel-1-rtc"
125
- type "Feature"
- stac_version "1.0.0"
- id "S1A_IW_GRDH_1SDV_20210310T120541_20210310T120606_036936_045868_rtc"
properties
- datetime "2021-03-10T12:05:54.192429Z"
- platform "SENTINEL-1A"
s1:shape [] 2 items
- 0 28428
- 1 21971
proj:bbox [] 4 items
- 0 618170.0
- 1 2960420.0
- 2 902450.0
- 3 3180130.0
- proj:epsg 32645
proj:shape [] 2 items
- 0 21971
- 1 28428
- end_datetime "2021-03-10 12:06:06.691590+00:00"
- constellation "Sentinel-1"
- s1:resolution "high"
proj:transform [] 9 items
- 0 10.0
- 1 0.0
- 2 618170.0
- 3 0.0
- 4 -10.0
- 5 3180130.0
- 6 0.0
- 7 0.0
- 8 1.0
- s1:datatake_id "284776"
- start_datetime "2021-03-10 12:05:41.693267+00:00"
- s1:orbit_source "PREORB"
- s1:slice_number "6"
- s1:total_slices "21"
- sar:looks_range 5
- sat:orbit_state "ascending"
- sar:product_type "GRD"
- sar:looks_azimuth 1
sar:polarizations [] 2 items
- 0 "VV"
- 1 "VH"
- sar:frequency_band "C"
- sat:absolute_orbit 36936
- sat:relative_orbit 114
- s1:processing_level "1"
- sar:instrument_mode "IW"
- sar:center_frequency 5.405
- sar:resolution_range 20
- s1:product_timeliness "Fast-24h"
- sar:resolution_azimuth 22
- sar:pixel_spacing_range 10
- sar:observation_direction "right"
- sar:pixel_spacing_azimuth 10
- sar:looks_equivalent_number 4.4
- s1:instrument_configuration_ID "6"
- sat:platform_international_designator "2014-016A"
geometry
- type "Polygon"
coordinates [] 1 items
0 [] 14 items
0 [] 2 items
- 0 89.9823401
- 1 27.0124101
1 [] 2 items
- 0 90.9936309
- 1 27.1726568
2 [] 2 items
- 0 90.7247432
- 1 28.6816483
3 [] 2 items
- 0 88.2174768
- 1 28.2795838
4 [] 2 items
- 0 88.3546652
- 1 27.7232007
5 [] 2 items
- 0 88.3296526
- 1 27.5841666
6 [] 2 items
- 0 88.3761846
- 1 27.5218825
7 [] 2 items
- 0 88.3577907
- 1 27.4089609
8 [] 2 items
- 0 88.4001651
- 1 27.3363295
9 [] 2 items
- 0 88.3790283
- 1 27.3026898
10 [] 2 items
- 0 88.4159088
- 1 27.2069094
11 [] 2 items
- 0 88.4040381
- 1 27.0892289
12 [] 2 items
- 0 88.4751272
- 1 26.7593343
13 [] 2 items
- 0 89.9823401
- 1 27.0124101
links [] 7 items
0
- rel "collection"
- href "https://planetarycomputer.microsoft.com/api/stac/v1/collections/sentinel-1-rtc"
- type "application/json"
1
- rel "parent"
- href "https://planetarycomputer.microsoft.com/api/stac/v1/collections/sentinel-1-rtc"
- type "application/json"
2
- rel "root"
- href "https://planetarycomputer.microsoft.com/api/stac/v1"
- type "application/json"
- title "Microsoft Planetary Computer STAC API"
3
- rel "self"
- href "https://planetarycomputer.microsoft.com/api/stac/v1/collections/sentinel-1-rtc/items/S1A_IW_GRDH_1SDV_20210310T120541_20210310T120606_036936_045868_rtc"
- type "application/geo+json"
4
- rel "license"
- href "https://sentinel.esa.int/documents/247904/690755/Sentinel_Data_Legal_Notice"
5
- rel "derived_from"
- href "https://planetarycomputer.microsoft.com/api/stac/v1/collections/sentinel-1-grd/items/S1A_IW_GRDH_1SDV_20210310T120541_20210310T120606_036936_045868"
- type "application/json"
- title "Sentinel 1 GRD Item"
6
- rel "preview"
- href "https://planetarycomputer.microsoft.com/api/data/v1/item/map?collection=sentinel-1-rtc&item=S1A_IW_GRDH_1SDV_20210310T120541_20210310T120606_036936_045868_rtc"
- type "text/html"
- title "Map of item"
assets
vh
- href "https://sentinel1euwestrtc.blob.core.windows.net/sentinel1-grd-rtc/GRD/2021/3/10/IW/DV/S1A_IW_GRDH_1SDV_20210310T120541_20210310T120606_036936_045868_0F4A/measurement/iw-vh.rtc.tiff"
- type "image/tiff; application=geotiff; profile=cloud-optimized"
- title "VH: vertical transmit, horizontal receive"
- description "Terrain-corrected gamma naught values of signal transmitted with vertical polarization and received with horizontal polarization with radiometric terrain correction applied."
- file:size 1852351421
- file:checksum "382f8c13e2f1a9e85ef07ab3cc1489bf"
raster:bands [] 1 items
0
- nodata -32768
- data_type "float32"
- spatial_resolution 10.0
roles [] 1 items
- 0 "data"
vv
- href "https://sentinel1euwestrtc.blob.core.windows.net/sentinel1-grd-rtc/GRD/2021/3/10/IW/DV/S1A_IW_GRDH_1SDV_20210310T120541_20210310T120606_036936_045868_0F4A/measurement/iw-vv.rtc.tiff"
- type "image/tiff; application=geotiff; profile=cloud-optimized"
- title "VV: vertical transmit, vertical receive"
- description "Terrain-corrected gamma naught values of signal transmitted with vertical polarization and received with vertical polarization with radiometric terrain correction applied."
- file:size 1859984464
- file:checksum "c699f8e898fe81d8db8e2133e216d5c8"
raster:bands [] 1 items
0
- nodata -32768
- data_type "float32"
- spatial_resolution 10.0
roles [] 1 items
- 0 "data"
tilejson
- href "https://planetarycomputer.microsoft.com/api/data/v1/item/tilejson.json?collection=sentinel-1-rtc&item=S1A_IW_GRDH_1SDV_20210310T120541_20210310T120606_036936_045868_rtc&assets=vv&assets=vh&tile_format=png&expression=0.03+%2B+log+%2810e-4+-+log+%280.05+%2F+%280.02+%2B+2+%2A+vv%29%29%29%3B0.05+%2B+exp+%280.25+%2A+%28log+%280.01+%2B+2+%2A+vv%29+%2B+log+%280.02+%2B+5+%2A+vh%29%29%29%3B1+-+log+%280.05+%2F+%280.045+-+0.9+%2A+vv%29%29&asset_as_band=True&rescale=0%2C.8000&rescale=0%2C1.000&rescale=0%2C1.000&format=png"
- type "application/json"
- title "TileJSON with default rendering"
roles [] 1 items
- 0 "tiles"
rendered_preview
- href "https://planetarycomputer.microsoft.com/api/data/v1/item/preview.png?collection=sentinel-1-rtc&item=S1A_IW_GRDH_1SDV_20210310T120541_20210310T120606_036936_045868_rtc&assets=vv&assets=vh&tile_format=png&expression=0.03+%2B+log+%2810e-4+-+log+%280.05+%2F+%280.02+%2B+2+%2A+vv%29%29%29%3B0.05+%2B+exp+%280.25+%2A+%28log+%280.01+%2B+2+%2A+vv%29+%2B+log+%280.02+%2B+5+%2A+vh%29%29%29%3B1+-+log+%280.05+%2F+%280.045+-+0.9+%2A+vv%29%29&asset_as_band=True&rescale=0%2C.8000&rescale=0%2C1.000&rescale=0%2C1.000&format=png"
- type "image/png"
- title "Rendered preview"
- rel "preview"
roles [] 1 items
- 0 "overview"
bbox [] 4 items
- 0 88.21747684
- 1 26.75933429
- 2 90.99363087
- 3 28.68164825
stac_extensions [] 6 items
- 0 "https://stac-extensions.github.io/sar/v1.0.0/schema.json"
- 1 "https://stac-extensions.github.io/sat/v1.0.0/schema.json"
- 2 "https://stac-extensions.github.io/eo/v1.0.0/schema.json"
- 3 "https://stac-extensions.github.io/projection/v1.0.0/schema.json"
- 4 "https://stac-extensions.github.io/file/v2.0.0/schema.json"
- 5 "https://stac-extensions.github.io/raster/v1.1.0/schema.json"
- collection "sentinel-1-rtc"
126
- type "Feature"
- stac_version "1.0.0"
- id "S1A_IW_GRDH_1SDV_20210306T000307_20210306T000332_036870_045604_rtc"
properties
- datetime "2021-03-06T00:03:20.005012Z"
- platform "SENTINEL-1A"
s1:shape [] 2 items
- 0 27532
- 1 21082
proj:bbox [] 4 items
- 0 524530.0
- 1 2980860.0
- 2 799850.0
- 3 3191680.0
- proj:epsg 32645
proj:shape [] 2 items
- 0 21082
- 1 27532
- end_datetime "2021-03-06 00:03:32.504373+00:00"
- constellation "Sentinel-1"
- s1:resolution "high"
proj:transform [] 9 items
- 0 10.0
- 1 0.0
- 2 524530.0
- 3 0.0
- 4 -10.0
- 5 3191680.0
- 6 0.0
- 7 0.0
- 8 1.0
- s1:datatake_id "284164"
- start_datetime "2021-03-06 00:03:07.505651+00:00"
- s1:orbit_source "RESORB"
- s1:slice_number "12"
- s1:total_slices "17"
- sar:looks_range 5
- sat:orbit_state "descending"
- sar:product_type "GRD"
- sar:looks_azimuth 1
sar:polarizations [] 2 items
- 0 "VV"
- 1 "VH"
- sar:frequency_band "C"
- sat:absolute_orbit 36870
- sat:relative_orbit 48
- s1:processing_level "1"
- sar:instrument_mode "IW"
- sar:center_frequency 5.405
- sar:resolution_range 20
- s1:product_timeliness "Fast-24h"
- sar:resolution_azimuth 22
- sar:pixel_spacing_range 10
- sar:observation_direction "right"
- sar:pixel_spacing_azimuth 10
- sar:looks_equivalent_number 4.4
- s1:instrument_configuration_ID "6"
- sat:platform_international_designator "2014-016A"
geometry
- type "Polygon"
coordinates [] 1 items
0 [] 16 items
0 [] 2 items
- 0 89.8058131
- 1 27.0223561
1 [] 2 items
- 0 89.778629
- 1 26.99434
2 [] 2 items
- 0 89.7852795
- 1 26.9228872
3 [] 2 items
- 0 87.3059924
- 1 27.3301919
4 [] 2 items
- 0 87.4267113
- 1 28.1944357
5 [] 2 items
- 0 87.5597636
- 1 28.84029
6 [] 2 items
- 0 90.0502659
- 1 28.4419427
7 [] 2 items
- 0 89.9717932
- 1 28.0842701
8 [] 2 items
- 0 89.9887091
- 1 28.0009153
9 [] 2 items
- 0 89.9457044
- 1 27.9517798
10 [] 2 items
- 0 89.9321204
- 1 27.8512182
11 [] 2 items
- 0 89.9534284
- 1 27.6783764
12 [] 2 items
- 0 89.9236925
- 1 27.6385935
13 [] 2 items
- 0 89.9038676
- 1 27.4280942
14 [] 2 items
- 0 89.8305113
- 1 27.2749718
15 [] 2 items
- 0 89.8058131
- 1 27.0223561
links [] 7 items
0
- rel "collection"
- href "https://planetarycomputer.microsoft.com/api/stac/v1/collections/sentinel-1-rtc"
- type "application/json"
1
- rel "parent"
- href "https://planetarycomputer.microsoft.com/api/stac/v1/collections/sentinel-1-rtc"
- type "application/json"
2
- rel "root"
- href "https://planetarycomputer.microsoft.com/api/stac/v1"
- type "application/json"
- title "Microsoft Planetary Computer STAC API"
3
- rel "self"
- href "https://planetarycomputer.microsoft.com/api/stac/v1/collections/sentinel-1-rtc/items/S1A_IW_GRDH_1SDV_20210306T000307_20210306T000332_036870_045604_rtc"
- type "application/geo+json"
4
- rel "license"
- href "https://sentinel.esa.int/documents/247904/690755/Sentinel_Data_Legal_Notice"
5
- rel "derived_from"
- href "https://planetarycomputer.microsoft.com/api/stac/v1/collections/sentinel-1-grd/items/S1A_IW_GRDH_1SDV_20210306T000307_20210306T000332_036870_045604"
- type "application/json"
- title "Sentinel 1 GRD Item"
6
- rel "preview"
- href "https://planetarycomputer.microsoft.com/api/data/v1/item/map?collection=sentinel-1-rtc&item=S1A_IW_GRDH_1SDV_20210306T000307_20210306T000332_036870_045604_rtc"
- type "text/html"
- title "Map of item"
assets
vh
- href "https://sentinel1euwestrtc.blob.core.windows.net/sentinel1-grd-rtc/GRD/2021/3/6/IW/DV/S1A_IW_GRDH_1SDV_20210306T000307_20210306T000332_036870_045604_DDC6/measurement/iw-vh.rtc.tiff"
- type "image/tiff; application=geotiff; profile=cloud-optimized"
- title "VH: vertical transmit, horizontal receive"
- description "Terrain-corrected gamma naught values of signal transmitted with vertical polarization and received with horizontal polarization with radiometric terrain correction applied."
- file:size 1842361718
- file:checksum "5b69b97f00dd999d12b225b1ad192ede"
raster:bands [] 1 items
0
- nodata -32768
- data_type "float32"
- spatial_resolution 10.0
roles [] 1 items
- 0 "data"
vv
- href "https://sentinel1euwestrtc.blob.core.windows.net/sentinel1-grd-rtc/GRD/2021/3/6/IW/DV/S1A_IW_GRDH_1SDV_20210306T000307_20210306T000332_036870_045604_DDC6/measurement/iw-vv.rtc.tiff"
- type "image/tiff; application=geotiff; profile=cloud-optimized"
- title "VV: vertical transmit, vertical receive"
- description "Terrain-corrected gamma naught values of signal transmitted with vertical polarization and received with vertical polarization with radiometric terrain correction applied."
- file:size 1848755445
- file:checksum "fa4a06dbfa636e09222588b57ef5b640"
raster:bands [] 1 items
0
- nodata -32768
- data_type "float32"
- spatial_resolution 10.0
roles [] 1 items
- 0 "data"
tilejson
- href "https://planetarycomputer.microsoft.com/api/data/v1/item/tilejson.json?collection=sentinel-1-rtc&item=S1A_IW_GRDH_1SDV_20210306T000307_20210306T000332_036870_045604_rtc&assets=vv&assets=vh&tile_format=png&expression=0.03+%2B+log+%2810e-4+-+log+%280.05+%2F+%280.02+%2B+2+%2A+vv%29%29%29%3B0.05+%2B+exp+%280.25+%2A+%28log+%280.01+%2B+2+%2A+vv%29+%2B+log+%280.02+%2B+5+%2A+vh%29%29%29%3B1+-+log+%280.05+%2F+%280.045+-+0.9+%2A+vv%29%29&asset_as_band=True&rescale=0%2C.8000&rescale=0%2C1.000&rescale=0%2C1.000&format=png"
- type "application/json"
- title "TileJSON with default rendering"
roles [] 1 items
- 0 "tiles"
rendered_preview
- href "https://planetarycomputer.microsoft.com/api/data/v1/item/preview.png?collection=sentinel-1-rtc&item=S1A_IW_GRDH_1SDV_20210306T000307_20210306T000332_036870_045604_rtc&assets=vv&assets=vh&tile_format=png&expression=0.03+%2B+log+%2810e-4+-+log+%280.05+%2F+%280.02+%2B+2+%2A+vv%29%29%29%3B0.05+%2B+exp+%280.25+%2A+%28log+%280.01+%2B+2+%2A+vv%29+%2B+log+%280.02+%2B+5+%2A+vh%29%29%29%3B1+-+log+%280.05+%2F+%280.045+-+0.9+%2A+vv%29%29&asset_as_band=True&rescale=0%2C.8000&rescale=0%2C1.000&rescale=0%2C1.000&format=png"
- type "image/png"
- title "Rendered preview"
- rel "preview"
roles [] 1 items
- 0 "overview"
bbox [] 4 items
- 0 87.30599236
- 1 26.92288717
- 2 90.05026587
- 3 28.84029004
stac_extensions [] 6 items
- 0 "https://stac-extensions.github.io/sar/v1.0.0/schema.json"
- 1 "https://stac-extensions.github.io/sat/v1.0.0/schema.json"
- 2 "https://stac-extensions.github.io/eo/v1.0.0/schema.json"
- 3 "https://stac-extensions.github.io/projection/v1.0.0/schema.json"
- 4 "https://stac-extensions.github.io/file/v2.0.0/schema.json"
- 5 "https://stac-extensions.github.io/raster/v1.1.0/schema.json"
- collection "sentinel-1-rtc"
127
- type "Feature"
- stac_version "1.0.0"
- id "S1A_IW_GRDH_1SDV_20210303T121348_20210303T121413_036834_0454C9_rtc"
properties
- datetime "2021-03-03T12:14:01.245451Z"
- platform "SENTINEL-1A"
s1:shape [] 2 items
- 0 28241
- 1 21600
proj:bbox [] 4 items
- 0 420920.0
- 1 2916190.0
- 2 703330.0
- 3 3132190.0
- proj:epsg 32645
proj:shape [] 2 items
- 0 21600
- 1 28241
- end_datetime "2021-03-03 12:14:13.745322+00:00"
- constellation "Sentinel-1"
- s1:resolution "high"
proj:transform [] 9 items
- 0 10.0
- 1 0.0
- 2 420920.0
- 3 0.0
- 4 -10.0
- 5 3132190.0
- 6 0.0
- 7 0.0
- 8 1.0
- s1:datatake_id "283849"
- start_datetime "2021-03-03 12:13:48.745579+00:00"
- s1:orbit_source "PREORB"
- s1:slice_number "6"
- s1:total_slices "20"
- sar:looks_range 5
- sat:orbit_state "ascending"
- sar:product_type "GRD"
- sar:looks_azimuth 1
sar:polarizations [] 2 items
- 0 "VV"
- 1 "VH"
- sar:frequency_band "C"
- sat:absolute_orbit 36834
- sat:relative_orbit 12
- s1:processing_level "1"
- sar:instrument_mode "IW"
- sar:center_frequency 5.405
- sar:resolution_range 20
- s1:product_timeliness "Fast-24h"
- sar:resolution_azimuth 22
- sar:pixel_spacing_range 10
- sar:observation_direction "right"
- sar:pixel_spacing_azimuth 10
- sar:looks_equivalent_number 4.4
- s1:instrument_configuration_ID "6"
- sat:platform_international_designator "2014-016A"
geometry
- type "Polygon"
coordinates [] 1 items
0 [] 16 items
0 [] 2 items
- 0 87.8646325
- 1 26.5974388
1 [] 2 items
- 0 86.4988778
- 1 26.3662334
2 [] 2 items
- 0 86.3551326
- 1 27.1611191
3 [] 2 items
- 0 86.3183697
- 1 27.2314537
4 [] 2 items
- 0 86.3265768
- 1 27.3777444
5 [] 2 items
- 0 86.2772702
- 1 27.4643437
6 [] 2 items
- 0 86.2705686
- 1 27.6973968
7 [] 2 items
- 0 86.2160921
- 1 27.7561369
8 [] 2 items
- 0 86.2344841
- 1 27.7815159
9 [] 2 items
- 0 86.2098135
- 1 27.7824603
10 [] 2 items
- 0 86.2036606
- 1 27.8467878
11 [] 2 items
- 0 86.2106708
- 1 27.8814466
12 [] 2 items
- 0 88.7378427
- 1 28.2893412
13 [] 2 items
- 0 88.9223398
- 1 27.3277726
14 [] 2 items
- 0 88.9845651
- 1 26.7767183
15 [] 2 items
- 0 87.8646325
- 1 26.5974388
links [] 7 items
0
- rel "collection"
- href "https://planetarycomputer.microsoft.com/api/stac/v1/collections/sentinel-1-rtc"
- type "application/json"
1
- rel "parent"
- href "https://planetarycomputer.microsoft.com/api/stac/v1/collections/sentinel-1-rtc"
- type "application/json"
2
- rel "root"
- href "https://planetarycomputer.microsoft.com/api/stac/v1"
- type "application/json"
- title "Microsoft Planetary Computer STAC API"
3
- rel "self"
- href "https://planetarycomputer.microsoft.com/api/stac/v1/collections/sentinel-1-rtc/items/S1A_IW_GRDH_1SDV_20210303T121348_20210303T121413_036834_0454C9_rtc"
- type "application/geo+json"
4
- rel "license"
- href "https://sentinel.esa.int/documents/247904/690755/Sentinel_Data_Legal_Notice"
5
- rel "derived_from"
- href "https://planetarycomputer.microsoft.com/api/stac/v1/collections/sentinel-1-grd/items/S1A_IW_GRDH_1SDV_20210303T121348_20210303T121413_036834_0454C9"
- type "application/json"
- title "Sentinel 1 GRD Item"
6
- rel "preview"
- href "https://planetarycomputer.microsoft.com/api/data/v1/item/map?collection=sentinel-1-rtc&item=S1A_IW_GRDH_1SDV_20210303T121348_20210303T121413_036834_0454C9_rtc"
- type "text/html"
- title "Map of item"
assets
vh
- href "https://sentinel1euwestrtc.blob.core.windows.net/sentinel1-grd-rtc/GRD/2021/3/3/IW/DV/S1A_IW_GRDH_1SDV_20210303T121348_20210303T121413_036834_0454C9_6015/measurement/iw-vh.rtc.tiff"
- type "image/tiff; application=geotiff; profile=cloud-optimized"
- title "VH: vertical transmit, horizontal receive"
- description "Terrain-corrected gamma naught values of signal transmitted with vertical polarization and received with horizontal polarization with radiometric terrain correction applied."
- file:size 1870390775
- file:checksum "62d575a4e47d1064e8448c8ad45770e7"
raster:bands [] 1 items
0
- nodata -32768
- data_type "float32"
- spatial_resolution 10.0
roles [] 1 items
- 0 "data"
vv
- href "https://sentinel1euwestrtc.blob.core.windows.net/sentinel1-grd-rtc/GRD/2021/3/3/IW/DV/S1A_IW_GRDH_1SDV_20210303T121348_20210303T121413_036834_0454C9_6015/measurement/iw-vv.rtc.tiff"
- type "image/tiff; application=geotiff; profile=cloud-optimized"
- title "VV: vertical transmit, vertical receive"
- description "Terrain-corrected gamma naught values of signal transmitted with vertical polarization and received with vertical polarization with radiometric terrain correction applied."
- file:size 1878114076
- file:checksum "34b5b3c45c08b3ea9d65131fe9e801da"
raster:bands [] 1 items
0
- nodata -32768
- data_type "float32"
- spatial_resolution 10.0
roles [] 1 items
- 0 "data"
tilejson
- href "https://planetarycomputer.microsoft.com/api/data/v1/item/tilejson.json?collection=sentinel-1-rtc&item=S1A_IW_GRDH_1SDV_20210303T121348_20210303T121413_036834_0454C9_rtc&assets=vv&assets=vh&tile_format=png&expression=0.03+%2B+log+%2810e-4+-+log+%280.05+%2F+%280.02+%2B+2+%2A+vv%29%29%29%3B0.05+%2B+exp+%280.25+%2A+%28log+%280.01+%2B+2+%2A+vv%29+%2B+log+%280.02+%2B+5+%2A+vh%29%29%29%3B1+-+log+%280.05+%2F+%280.045+-+0.9+%2A+vv%29%29&asset_as_band=True&rescale=0%2C.8000&rescale=0%2C1.000&rescale=0%2C1.000&format=png"
- type "application/json"
- title "TileJSON with default rendering"
roles [] 1 items
- 0 "tiles"
rendered_preview
- href "https://planetarycomputer.microsoft.com/api/data/v1/item/preview.png?collection=sentinel-1-rtc&item=S1A_IW_GRDH_1SDV_20210303T121348_20210303T121413_036834_0454C9_rtc&assets=vv&assets=vh&tile_format=png&expression=0.03+%2B+log+%2810e-4+-+log+%280.05+%2F+%280.02+%2B+2+%2A+vv%29%29%29%3B0.05+%2B+exp+%280.25+%2A+%28log+%280.01+%2B+2+%2A+vv%29+%2B+log+%280.02+%2B+5+%2A+vh%29%29%29%3B1+-+log+%280.05+%2F+%280.045+-+0.9+%2A+vv%29%29&asset_as_band=True&rescale=0%2C.8000&rescale=0%2C1.000&rescale=0%2C1.000&format=png"
- type "image/png"
- title "Rendered preview"
- rel "preview"
roles [] 1 items
- 0 "overview"
bbox [] 4 items
- 0 86.20366057
- 1 26.36623339
- 2 88.98456513
- 3 28.28934124
stac_extensions [] 6 items
- 0 "https://stac-extensions.github.io/sar/v1.0.0/schema.json"
- 1 "https://stac-extensions.github.io/sat/v1.0.0/schema.json"
- 2 "https://stac-extensions.github.io/eo/v1.0.0/schema.json"
- 3 "https://stac-extensions.github.io/projection/v1.0.0/schema.json"
- 4 "https://stac-extensions.github.io/file/v2.0.0/schema.json"
- 5 "https://stac-extensions.github.io/raster/v1.1.0/schema.json"
- collection "sentinel-1-rtc"
128
- type "Feature"
- stac_version "1.0.0"
- id "S1A_IW_GRDH_1SDV_20210226T120541_20210226T120606_036761_04524C_rtc"
properties
- datetime "2021-02-26T12:05:54.153373Z"
- platform "SENTINEL-1A"
s1:shape [] 2 items
- 0 28429
- 1 21971
proj:bbox [] 4 items
- 0 618160.0
- 1 2960420.0
- 2 902450.0
- 3 3180130.0
- proj:epsg 32645
proj:shape [] 2 items
- 0 21971
- 1 28429
- end_datetime "2021-02-26 12:06:06.652546+00:00"
- constellation "Sentinel-1"
- s1:resolution "high"
proj:transform [] 9 items
- 0 10.0
- 1 0.0
- 2 618160.0
- 3 0.0
- 4 -10.0
- 5 3180130.0
- 6 0.0
- 7 0.0
- 8 1.0
- s1:datatake_id "283212"
- start_datetime "2021-02-26 12:05:41.654199+00:00"
- s1:orbit_source "PREORB"
- s1:slice_number "6"
- s1:total_slices "21"
- sar:looks_range 5
- sat:orbit_state "ascending"
- sar:product_type "GRD"
- sar:looks_azimuth 1
sar:polarizations [] 2 items
- 0 "VV"
- 1 "VH"
- sar:frequency_band "C"
- sat:absolute_orbit 36761
- sat:relative_orbit 114
- s1:processing_level "1"
- sar:instrument_mode "IW"
- sar:center_frequency 5.405
- sar:resolution_range 20
- s1:product_timeliness "Fast-24h"
- sar:resolution_azimuth 22
- sar:pixel_spacing_range 10
- sar:observation_direction "right"
- sar:pixel_spacing_azimuth 10
- sar:looks_equivalent_number 4.4
- s1:instrument_configuration_ID "6"
- sat:platform_international_designator "2014-016A"
geometry
- type "Polygon"
coordinates [] 1 items
0 [] 14 items
0 [] 2 items
- 0 89.9821388
- 1 27.0124143
1 [] 2 items
- 0 90.9935302
- 1 27.1726596
2 [] 2 items
- 0 90.724641
- 1 28.6816511
3 [] 2 items
- 0 88.2173749
- 1 28.2795847
4 [] 2 items
- 0 88.3545626
- 1 27.7231115
5 [] 2 items
- 0 88.3295524
- 1 27.5842579
6 [] 2 items
- 0 88.3760845
- 1 27.5219738
7 [] 2 items
- 0 88.3576895
- 1 27.4089619
8 [] 2 items
- 0 88.400064
- 1 27.3363305
9 [] 2 items
- 0 88.3790261
- 1 27.3025093
10 [] 2 items
- 0 88.4159065
- 1 27.2067289
11 [] 2 items
- 0 88.4039373
- 1 27.0892299
12 [] 2 items
- 0 88.4750278
- 1 26.7594256
13 [] 2 items
- 0 89.9821388
- 1 27.0124143
links [] 7 items
0
- rel "collection"
- href "https://planetarycomputer.microsoft.com/api/stac/v1/collections/sentinel-1-rtc"
- type "application/json"
1
- rel "parent"
- href "https://planetarycomputer.microsoft.com/api/stac/v1/collections/sentinel-1-rtc"
- type "application/json"
2
- rel "root"
- href "https://planetarycomputer.microsoft.com/api/stac/v1"
- type "application/json"
- title "Microsoft Planetary Computer STAC API"
3
- rel "self"
- href "https://planetarycomputer.microsoft.com/api/stac/v1/collections/sentinel-1-rtc/items/S1A_IW_GRDH_1SDV_20210226T120541_20210226T120606_036761_04524C_rtc"
- type "application/geo+json"
4
- rel "license"
- href "https://sentinel.esa.int/documents/247904/690755/Sentinel_Data_Legal_Notice"
5
- rel "derived_from"
- href "https://planetarycomputer.microsoft.com/api/stac/v1/collections/sentinel-1-grd/items/S1A_IW_GRDH_1SDV_20210226T120541_20210226T120606_036761_04524C"
- type "application/json"
- title "Sentinel 1 GRD Item"
6
- rel "preview"
- href "https://planetarycomputer.microsoft.com/api/data/v1/item/map?collection=sentinel-1-rtc&item=S1A_IW_GRDH_1SDV_20210226T120541_20210226T120606_036761_04524C_rtc"
- type "text/html"
- title "Map of item"
assets
vh
- href "https://sentinel1euwestrtc.blob.core.windows.net/sentinel1-grd-rtc/GRD/2021/2/26/IW/DV/S1A_IW_GRDH_1SDV_20210226T120541_20210226T120606_036761_04524C_A4F4/measurement/iw-vh.rtc.tiff"
- type "image/tiff; application=geotiff; profile=cloud-optimized"
- title "VH: vertical transmit, horizontal receive"
- description "Terrain-corrected gamma naught values of signal transmitted with vertical polarization and received with horizontal polarization with radiometric terrain correction applied."
- file:size 1851793184
- file:checksum "ba24fdbde57b356885fd4124a7dc101f"
raster:bands [] 1 items
0
- nodata -32768
- data_type "float32"
- spatial_resolution 10.0
roles [] 1 items
- 0 "data"
vv
- href "https://sentinel1euwestrtc.blob.core.windows.net/sentinel1-grd-rtc/GRD/2021/2/26/IW/DV/S1A_IW_GRDH_1SDV_20210226T120541_20210226T120606_036761_04524C_A4F4/measurement/iw-vv.rtc.tiff"
- type "image/tiff; application=geotiff; profile=cloud-optimized"
- title "VV: vertical transmit, vertical receive"
- description "Terrain-corrected gamma naught values of signal transmitted with vertical polarization and received with vertical polarization with radiometric terrain correction applied."
- file:size 1859249694
- file:checksum "5303891de377e4d13ae529bfa4b08174"
raster:bands [] 1 items
0
- nodata -32768
- data_type "float32"
- spatial_resolution 10.0
roles [] 1 items
- 0 "data"
tilejson
- href "https://planetarycomputer.microsoft.com/api/data/v1/item/tilejson.json?collection=sentinel-1-rtc&item=S1A_IW_GRDH_1SDV_20210226T120541_20210226T120606_036761_04524C_rtc&assets=vv&assets=vh&tile_format=png&expression=0.03+%2B+log+%2810e-4+-+log+%280.05+%2F+%280.02+%2B+2+%2A+vv%29%29%29%3B0.05+%2B+exp+%280.25+%2A+%28log+%280.01+%2B+2+%2A+vv%29+%2B+log+%280.02+%2B+5+%2A+vh%29%29%29%3B1+-+log+%280.05+%2F+%280.045+-+0.9+%2A+vv%29%29&asset_as_band=True&rescale=0%2C.8000&rescale=0%2C1.000&rescale=0%2C1.000&format=png"
- type "application/json"
- title "TileJSON with default rendering"
roles [] 1 items
- 0 "tiles"
rendered_preview
- href "https://planetarycomputer.microsoft.com/api/data/v1/item/preview.png?collection=sentinel-1-rtc&item=S1A_IW_GRDH_1SDV_20210226T120541_20210226T120606_036761_04524C_rtc&assets=vv&assets=vh&tile_format=png&expression=0.03+%2B+log+%2810e-4+-+log+%280.05+%2F+%280.02+%2B+2+%2A+vv%29%29%29%3B0.05+%2B+exp+%280.25+%2A+%28log+%280.01+%2B+2+%2A+vv%29+%2B+log+%280.02+%2B+5+%2A+vh%29%29%29%3B1+-+log+%280.05+%2F+%280.045+-+0.9+%2A+vv%29%29&asset_as_band=True&rescale=0%2C.8000&rescale=0%2C1.000&rescale=0%2C1.000&format=png"
- type "image/png"
- title "Rendered preview"
- rel "preview"
roles [] 1 items
- 0 "overview"
bbox [] 4 items
- 0 88.21737489
- 1 26.75942559
- 2 90.99353017
- 3 28.68165107
stac_extensions [] 6 items
- 0 "https://stac-extensions.github.io/sar/v1.0.0/schema.json"
- 1 "https://stac-extensions.github.io/sat/v1.0.0/schema.json"
- 2 "https://stac-extensions.github.io/eo/v1.0.0/schema.json"
- 3 "https://stac-extensions.github.io/projection/v1.0.0/schema.json"
- 4 "https://stac-extensions.github.io/file/v2.0.0/schema.json"
- 5 "https://stac-extensions.github.io/raster/v1.1.0/schema.json"
- collection "sentinel-1-rtc"
129
- type "Feature"
- stac_version "1.0.0"
- id "S1A_IW_GRDH_1SDV_20210222T000307_20210222T000332_036695_044FF8_rtc"
properties
- datetime "2021-02-22T00:03:20.101142Z"
- platform "SENTINEL-1A"
s1:shape [] 2 items
- 0 27534
- 1 21083
proj:bbox [] 4 items
- 0 524500.0
- 1 2980860.0
- 2 799840.0
- 3 3191690.0
- proj:epsg 32645
proj:shape [] 2 items
- 0 21083
- 1 27534
- end_datetime "2021-02-22 00:03:32.600569+00:00"
- constellation "Sentinel-1"
- s1:resolution "high"
proj:transform [] 9 items
- 0 10.0
- 1 0.0
- 2 524500.0
- 3 0.0
- 4 -10.0
- 5 3191690.0
- 6 0.0
- 7 0.0
- 8 1.0
- s1:datatake_id "282616"
- start_datetime "2021-02-22 00:03:07.601714+00:00"
- s1:orbit_source "RESORB"
- s1:slice_number "12"
- s1:total_slices "17"
- sar:looks_range 5
- sat:orbit_state "descending"
- sar:product_type "GRD"
- sar:looks_azimuth 1
sar:polarizations [] 2 items
- 0 "VV"
- 1 "VH"
- sar:frequency_band "C"
- sat:absolute_orbit 36695
- sat:relative_orbit 48
- s1:processing_level "1"
- sar:instrument_mode "IW"
- sar:center_frequency 5.405
- sar:resolution_range 20
- s1:product_timeliness "Fast-24h"
- sar:resolution_azimuth 22
- sar:pixel_spacing_range 10
- sar:observation_direction "right"
- sar:pixel_spacing_azimuth 10
- sar:looks_equivalent_number 4.4
- s1:instrument_configuration_ID "6"
- sat:platform_international_designator "2014-016A"
geometry
- type "Polygon"
coordinates [] 1 items
0 [] 16 items
0 [] 2 items
- 0 89.8055133
- 1 27.0224523
1 [] 2 items
- 0 89.7784277
- 1 26.994344
2 [] 2 items
- 0 89.7851789
- 1 26.9228892
3 [] 2 items
- 0 87.3056881
- 1 27.3298314
4 [] 2 items
- 0 87.4265075
- 1 28.1944364
5 [] 2 items
- 0 87.5596611
- 1 28.8402905
6 [] 2 items
- 0 90.0501639
- 1 28.441945
7 [] 2 items
- 0 89.9861725
- 1 28.1883222
8 [] 2 items
- 0 89.988511
- 1 28.0011
9 [] 2 items
- 0 89.9456054
- 1 27.9518721
10 [] 2 items
- 0 89.9320214
- 1 27.8513105
11 [] 2 items
- 0 89.953221
- 1 27.6782004
12 [] 2 items
- 0 89.9235912
- 1 27.6385956
13 [] 2 items
- 0 89.9036702
- 1 27.4282787
14 [] 2 items
- 0 89.8300045
- 1 27.2748918
15 [] 2 items
- 0 89.8055133
- 1 27.0224523
links [] 7 items
0
- rel "collection"
- href "https://planetarycomputer.microsoft.com/api/stac/v1/collections/sentinel-1-rtc"
- type "application/json"
1
- rel "parent"
- href "https://planetarycomputer.microsoft.com/api/stac/v1/collections/sentinel-1-rtc"
- type "application/json"
2
- rel "root"
- href "https://planetarycomputer.microsoft.com/api/stac/v1"
- type "application/json"
- title "Microsoft Planetary Computer STAC API"
3
- rel "self"
- href "https://planetarycomputer.microsoft.com/api/stac/v1/collections/sentinel-1-rtc/items/S1A_IW_GRDH_1SDV_20210222T000307_20210222T000332_036695_044FF8_rtc"
- type "application/geo+json"
4
- rel "license"
- href "https://sentinel.esa.int/documents/247904/690755/Sentinel_Data_Legal_Notice"
5
- rel "derived_from"
- href "https://planetarycomputer.microsoft.com/api/stac/v1/collections/sentinel-1-grd/items/S1A_IW_GRDH_1SDV_20210222T000307_20210222T000332_036695_044FF8"
- type "application/json"
- title "Sentinel 1 GRD Item"
6
- rel "preview"
- href "https://planetarycomputer.microsoft.com/api/data/v1/item/map?collection=sentinel-1-rtc&item=S1A_IW_GRDH_1SDV_20210222T000307_20210222T000332_036695_044FF8_rtc"
- type "text/html"
- title "Map of item"
assets
vh
- href "https://sentinel1euwestrtc.blob.core.windows.net/sentinel1-grd-rtc/GRD/2021/2/22/IW/DV/S1A_IW_GRDH_1SDV_20210222T000307_20210222T000332_036695_044FF8_44FA/measurement/iw-vh.rtc.tiff"
- type "image/tiff; application=geotiff; profile=cloud-optimized"
- title "VH: vertical transmit, horizontal receive"
- description "Terrain-corrected gamma naught values of signal transmitted with vertical polarization and received with horizontal polarization with radiometric terrain correction applied."
- file:size 1841809107
- file:checksum "6becf06aa23c3060b501c5bd02f05444"
raster:bands [] 1 items
0
- nodata -32768
- data_type "float32"
- spatial_resolution 10.0
roles [] 1 items
- 0 "data"
vv
- href "https://sentinel1euwestrtc.blob.core.windows.net/sentinel1-grd-rtc/GRD/2021/2/22/IW/DV/S1A_IW_GRDH_1SDV_20210222T000307_20210222T000332_036695_044FF8_44FA/measurement/iw-vv.rtc.tiff"
- type "image/tiff; application=geotiff; profile=cloud-optimized"
- title "VV: vertical transmit, vertical receive"
- description "Terrain-corrected gamma naught values of signal transmitted with vertical polarization and received with vertical polarization with radiometric terrain correction applied."
- file:size 1847744667
- file:checksum "7e67d8c1145027fea562d551f72a2aa8"
raster:bands [] 1 items
0
- nodata -32768
- data_type "float32"
- spatial_resolution 10.0
roles [] 1 items
- 0 "data"
tilejson
- href "https://planetarycomputer.microsoft.com/api/data/v1/item/tilejson.json?collection=sentinel-1-rtc&item=S1A_IW_GRDH_1SDV_20210222T000307_20210222T000332_036695_044FF8_rtc&assets=vv&assets=vh&tile_format=png&expression=0.03+%2B+log+%2810e-4+-+log+%280.05+%2F+%280.02+%2B+2+%2A+vv%29%29%29%3B0.05+%2B+exp+%280.25+%2A+%28log+%280.01+%2B+2+%2A+vv%29+%2B+log+%280.02+%2B+5+%2A+vh%29%29%29%3B1+-+log+%280.05+%2F+%280.045+-+0.9+%2A+vv%29%29&asset_as_band=True&rescale=0%2C.8000&rescale=0%2C1.000&rescale=0%2C1.000&format=png"
- type "application/json"
- title "TileJSON with default rendering"
roles [] 1 items
- 0 "tiles"
rendered_preview
- href "https://planetarycomputer.microsoft.com/api/data/v1/item/preview.png?collection=sentinel-1-rtc&item=S1A_IW_GRDH_1SDV_20210222T000307_20210222T000332_036695_044FF8_rtc&assets=vv&assets=vh&tile_format=png&expression=0.03+%2B+log+%2810e-4+-+log+%280.05+%2F+%280.02+%2B+2+%2A+vv%29%29%29%3B0.05+%2B+exp+%280.25+%2A+%28log+%280.01+%2B+2+%2A+vv%29+%2B+log+%280.02+%2B+5+%2A+vh%29%29%29%3B1+-+log+%280.05+%2F+%280.045+-+0.9+%2A+vv%29%29&asset_as_band=True&rescale=0%2C.8000&rescale=0%2C1.000&rescale=0%2C1.000&format=png"
- type "image/png"
- title "Rendered preview"
- rel "preview"
roles [] 1 items
- 0 "overview"
bbox [] 4 items
- 0 87.30568811
- 1 26.92288915
- 2 90.05016389
- 3 28.84029046
stac_extensions [] 6 items
- 0 "https://stac-extensions.github.io/sar/v1.0.0/schema.json"
- 1 "https://stac-extensions.github.io/sat/v1.0.0/schema.json"
- 2 "https://stac-extensions.github.io/eo/v1.0.0/schema.json"
- 3 "https://stac-extensions.github.io/projection/v1.0.0/schema.json"
- 4 "https://stac-extensions.github.io/file/v2.0.0/schema.json"
- 5 "https://stac-extensions.github.io/raster/v1.1.0/schema.json"
- collection "sentinel-1-rtc"
130
- type "Feature"
- stac_version "1.0.0"
- id "S1A_IW_GRDH_1SDV_20210219T121348_20210219T121413_036659_044EBC_rtc"
properties
- datetime "2021-02-19T12:14:01.373591Z"
- platform "SENTINEL-1A"
s1:shape [] 2 items
- 0 28242
- 1 21600
proj:bbox [] 4 items
- 0 420920.0
- 1 2916200.0
- 2 703340.0
- 3 3132200.0
- proj:epsg 32645
proj:shape [] 2 items
- 0 21600
- 1 28242
- end_datetime "2021-02-19 12:14:13.873464+00:00"
- constellation "Sentinel-1"
- s1:resolution "high"
proj:transform [] 9 items
- 0 10.0
- 1 0.0
- 2 420920.0
- 3 0.0
- 4 -10.0
- 5 3132200.0
- 6 0.0
- 7 0.0
- 8 1.0
- s1:datatake_id "282300"
- start_datetime "2021-02-19 12:13:48.873719+00:00"
- s1:orbit_source "RESORB"
- s1:slice_number "6"
- s1:total_slices "20"
- sar:looks_range 5
- sat:orbit_state "ascending"
- sar:product_type "GRD"
- sar:looks_azimuth 1
sar:polarizations [] 2 items
- 0 "VV"
- 1 "VH"
- sar:frequency_band "C"
- sat:absolute_orbit 36659
- sat:relative_orbit 12
- s1:processing_level "1"
- sar:instrument_mode "IW"
- sar:center_frequency 5.405
- sar:resolution_range 20
- s1:product_timeliness "Fast-24h"
- sar:resolution_azimuth 22
- sar:pixel_spacing_range 10
- sar:observation_direction "right"
- sar:pixel_spacing_azimuth 10
- sar:looks_equivalent_number 4.4
- s1:instrument_configuration_ID "6"
- sat:platform_international_designator "2014-016A"
geometry
- type "Polygon"
coordinates [] 1 items
0 [] 16 items
0 [] 2 items
- 0 87.864834
- 1 26.5975279
1 [] 2 items
- 0 86.4988775
- 1 26.3663237
2 [] 2 items
- 0 86.3550311
- 1 27.1612089
3 [] 2 items
- 0 86.3183708
- 1 27.2312732
4 [] 2 items
- 0 86.3264762
- 1 27.3776537
5 [] 2 items
- 0 86.2772708
- 1 27.4642534
6 [] 2 items
- 0 86.2704665
- 1 27.6974866
7 [] 2 items
- 0 86.2160927
- 1 27.7560466
8 [] 2 items
- 0 86.234486
- 1 27.7812451
9 [] 2 items
- 0 86.2098148
- 1 27.7822798
10 [] 2 items
- 0 86.2036599
- 1 27.8468781
11 [] 2 items
- 0 86.2108733
- 1 27.881538
12 [] 2 items
- 0 88.7377408
- 1 28.2893425
13 [] 2 items
- 0 88.9222387
- 1 27.327774
14 [] 2 items
- 0 88.9844646
- 1 26.7767197
15 [] 2 items
- 0 87.864834
- 1 26.5975279
links [] 7 items
0
- rel "collection"
- href "https://planetarycomputer.microsoft.com/api/stac/v1/collections/sentinel-1-rtc"
- type "application/json"
1
- rel "parent"
- href "https://planetarycomputer.microsoft.com/api/stac/v1/collections/sentinel-1-rtc"
- type "application/json"
2
- rel "root"
- href "https://planetarycomputer.microsoft.com/api/stac/v1"
- type "application/json"
- title "Microsoft Planetary Computer STAC API"
3
- rel "self"
- href "https://planetarycomputer.microsoft.com/api/stac/v1/collections/sentinel-1-rtc/items/S1A_IW_GRDH_1SDV_20210219T121348_20210219T121413_036659_044EBC_rtc"
- type "application/geo+json"
4
- rel "license"
- href "https://sentinel.esa.int/documents/247904/690755/Sentinel_Data_Legal_Notice"
5
- rel "derived_from"
- href "https://planetarycomputer.microsoft.com/api/stac/v1/collections/sentinel-1-grd/items/S1A_IW_GRDH_1SDV_20210219T121348_20210219T121413_036659_044EBC"
- type "application/json"
- title "Sentinel 1 GRD Item"
6
- rel "preview"
- href "https://planetarycomputer.microsoft.com/api/data/v1/item/map?collection=sentinel-1-rtc&item=S1A_IW_GRDH_1SDV_20210219T121348_20210219T121413_036659_044EBC_rtc"
- type "text/html"
- title "Map of item"
assets
vh
- href "https://sentinel1euwestrtc.blob.core.windows.net/sentinel1-grd-rtc/GRD/2021/2/19/IW/DV/S1A_IW_GRDH_1SDV_20210219T121348_20210219T121413_036659_044EBC_98A2/measurement/iw-vh.rtc.tiff"
- type "image/tiff; application=geotiff; profile=cloud-optimized"
- title "VH: vertical transmit, horizontal receive"
- description "Terrain-corrected gamma naught values of signal transmitted with vertical polarization and received with horizontal polarization with radiometric terrain correction applied."
- file:size 1872136979
- file:checksum "c1845dd70ec33aeec81c443b2ac3fdaf"
raster:bands [] 1 items
0
- nodata -32768
- data_type "float32"
- spatial_resolution 10.0
roles [] 1 items
- 0 "data"
vv
- href "https://sentinel1euwestrtc.blob.core.windows.net/sentinel1-grd-rtc/GRD/2021/2/19/IW/DV/S1A_IW_GRDH_1SDV_20210219T121348_20210219T121413_036659_044EBC_98A2/measurement/iw-vv.rtc.tiff"
- type "image/tiff; application=geotiff; profile=cloud-optimized"
- title "VV: vertical transmit, vertical receive"
- description "Terrain-corrected gamma naught values of signal transmitted with vertical polarization and received with vertical polarization with radiometric terrain correction applied."
- file:size 1879319111
- file:checksum "5078477a0bee6c9c57407abee8a21861"
raster:bands [] 1 items
0
- nodata -32768
- data_type "float32"
- spatial_resolution 10.0
roles [] 1 items
- 0 "data"
tilejson
- href "https://planetarycomputer.microsoft.com/api/data/v1/item/tilejson.json?collection=sentinel-1-rtc&item=S1A_IW_GRDH_1SDV_20210219T121348_20210219T121413_036659_044EBC_rtc&assets=vv&assets=vh&tile_format=png&expression=0.03+%2B+log+%2810e-4+-+log+%280.05+%2F+%280.02+%2B+2+%2A+vv%29%29%29%3B0.05+%2B+exp+%280.25+%2A+%28log+%280.01+%2B+2+%2A+vv%29+%2B+log+%280.02+%2B+5+%2A+vh%29%29%29%3B1+-+log+%280.05+%2F+%280.045+-+0.9+%2A+vv%29%29&asset_as_band=True&rescale=0%2C.8000&rescale=0%2C1.000&rescale=0%2C1.000&format=png"
- type "application/json"
- title "TileJSON with default rendering"
roles [] 1 items
- 0 "tiles"
rendered_preview
- href "https://planetarycomputer.microsoft.com/api/data/v1/item/preview.png?collection=sentinel-1-rtc&item=S1A_IW_GRDH_1SDV_20210219T121348_20210219T121413_036659_044EBC_rtc&assets=vv&assets=vh&tile_format=png&expression=0.03+%2B+log+%2810e-4+-+log+%280.05+%2F+%280.02+%2B+2+%2A+vv%29%29%29%3B0.05+%2B+exp+%280.25+%2A+%28log+%280.01+%2B+2+%2A+vv%29+%2B+log+%280.02+%2B+5+%2A+vh%29%29%29%3B1+-+log+%280.05+%2F+%280.045+-+0.9+%2A+vv%29%29&asset_as_band=True&rescale=0%2C.8000&rescale=0%2C1.000&rescale=0%2C1.000&format=png"
- type "image/png"
- title "Rendered preview"
- rel "preview"
roles [] 1 items
- 0 "overview"
bbox [] 4 items
- 0 86.20365991
- 1 26.36632368
- 2 88.9844646
- 3 28.28934254
stac_extensions [] 6 items
- 0 "https://stac-extensions.github.io/sar/v1.0.0/schema.json"
- 1 "https://stac-extensions.github.io/sat/v1.0.0/schema.json"
- 2 "https://stac-extensions.github.io/eo/v1.0.0/schema.json"
- 3 "https://stac-extensions.github.io/projection/v1.0.0/schema.json"
- 4 "https://stac-extensions.github.io/file/v2.0.0/schema.json"
- 5 "https://stac-extensions.github.io/raster/v1.1.0/schema.json"
- collection "sentinel-1-rtc"
131
- type "Feature"
- stac_version "1.0.0"
- id "S1A_IW_GRDH_1SDV_20210214T120541_20210214T120606_036586_044C38_rtc"
properties
- datetime "2021-02-14T12:05:54.310324Z"
- platform "SENTINEL-1A"
s1:shape [] 2 items
- 0 28431
- 1 21971
proj:bbox [] 4 items
- 0 618120.0
- 1 2960430.0
- 2 902430.0
- 3 3180140.0
- proj:epsg 32645
proj:shape [] 2 items
- 0 21971
- 1 28431
- end_datetime "2021-02-14 12:06:06.809495+00:00"
- constellation "Sentinel-1"
- s1:resolution "high"
proj:transform [] 9 items
- 0 10.0
- 1 0.0
- 2 618120.0
- 3 0.0
- 4 -10.0
- 5 3180140.0
- 6 0.0
- 7 0.0
- 8 1.0
- s1:datatake_id "281656"
- start_datetime "2021-02-14 12:05:41.811154+00:00"
- s1:orbit_source "RESORB"
- s1:slice_number "6"
- s1:total_slices "21"
- sar:looks_range 5
- sat:orbit_state "ascending"
- sar:product_type "GRD"
- sar:looks_azimuth 1
sar:polarizations [] 2 items
- 0 "VV"
- 1 "VH"
- sar:frequency_band "C"
- sat:absolute_orbit 36586
- sat:relative_orbit 114
- s1:processing_level "1"
- sar:instrument_mode "IW"
- sar:center_frequency 5.405
- sar:resolution_range 20
- s1:product_timeliness "Fast-24h"
- sar:resolution_azimuth 22
- sar:pixel_spacing_range 10
- sar:observation_direction "right"
- sar:pixel_spacing_azimuth 10
- sar:looks_equivalent_number 4.4
- s1:instrument_configuration_ID "6"
- sat:platform_international_designator "2014-016A"
geometry
- type "Polygon"
coordinates [] 1 items
0 [] 14 items
0 [] 2 items
- 0 89.9819398
- 1 27.0125088
1 [] 2 items
- 0 90.9932313
- 1 27.1727583
2 [] 2 items
- 0 90.7243378
- 1 28.6817496
3 [] 2 items
- 0 88.2169681
- 1 28.2796786
4 [] 2 items
- 0 88.3540544
- 1 27.7230262
5 [] 2 items
- 0 88.3292464
- 1 27.5840803
6 [] 2 items
- 0 88.3756796
- 1 27.5219778
7 [] 2 items
- 0 88.3572861
- 1 27.4090561
8 [] 2 items
- 0 88.3996609
- 1 27.3364248
9 [] 2 items
- 0 88.3787308
- 1 27.3031441
10 [] 2 items
- 0 88.4157058
- 1 27.2068211
11 [] 2 items
- 0 88.4035373
- 1 27.0895047
12 [] 2 items
- 0 88.4746256
- 1 26.7594298
13 [] 2 items
- 0 89.9819398
- 1 27.0125088
links [] 7 items
0
- rel "collection"
- href "https://planetarycomputer.microsoft.com/api/stac/v1/collections/sentinel-1-rtc"
- type "application/json"
1
- rel "parent"
- href "https://planetarycomputer.microsoft.com/api/stac/v1/collections/sentinel-1-rtc"
- type "application/json"
2
- rel "root"
- href "https://planetarycomputer.microsoft.com/api/stac/v1"
- type "application/json"
- title "Microsoft Planetary Computer STAC API"
3
- rel "self"
- href "https://planetarycomputer.microsoft.com/api/stac/v1/collections/sentinel-1-rtc/items/S1A_IW_GRDH_1SDV_20210214T120541_20210214T120606_036586_044C38_rtc"
- type "application/geo+json"
4
- rel "license"
- href "https://sentinel.esa.int/documents/247904/690755/Sentinel_Data_Legal_Notice"
5
- rel "derived_from"
- href "https://planetarycomputer.microsoft.com/api/stac/v1/collections/sentinel-1-grd/items/S1A_IW_GRDH_1SDV_20210214T120541_20210214T120606_036586_044C38"
- type "application/json"
- title "Sentinel 1 GRD Item"
6
- rel "preview"
- href "https://planetarycomputer.microsoft.com/api/data/v1/item/map?collection=sentinel-1-rtc&item=S1A_IW_GRDH_1SDV_20210214T120541_20210214T120606_036586_044C38_rtc"
- type "text/html"
- title "Map of item"
assets
vh
- href "https://sentinel1euwestrtc.blob.core.windows.net/sentinel1-grd-rtc/GRD/2021/2/14/IW/DV/S1A_IW_GRDH_1SDV_20210214T120541_20210214T120606_036586_044C38_EBB8/measurement/iw-vh.rtc.tiff"
- type "image/tiff; application=geotiff; profile=cloud-optimized"
- title "VH: vertical transmit, horizontal receive"
- description "Terrain-corrected gamma naught values of signal transmitted with vertical polarization and received with horizontal polarization with radiometric terrain correction applied."
- file:size 1852176053
- file:checksum "20d7dab0fbd254502835ecc5782aa843"
raster:bands [] 1 items
0
- nodata -32768
- data_type "float32"
- spatial_resolution 10.0
roles [] 1 items
- 0 "data"
vv
- href "https://sentinel1euwestrtc.blob.core.windows.net/sentinel1-grd-rtc/GRD/2021/2/14/IW/DV/S1A_IW_GRDH_1SDV_20210214T120541_20210214T120606_036586_044C38_EBB8/measurement/iw-vv.rtc.tiff"
- type "image/tiff; application=geotiff; profile=cloud-optimized"
- title "VV: vertical transmit, vertical receive"
- description "Terrain-corrected gamma naught values of signal transmitted with vertical polarization and received with vertical polarization with radiometric terrain correction applied."
- file:size 1859100582
- file:checksum "a36a4150b4d55c4d58ebe32242db8417"
raster:bands [] 1 items
0
- nodata -32768
- data_type "float32"
- spatial_resolution 10.0
roles [] 1 items
- 0 "data"
tilejson
- href "https://planetarycomputer.microsoft.com/api/data/v1/item/tilejson.json?collection=sentinel-1-rtc&item=S1A_IW_GRDH_1SDV_20210214T120541_20210214T120606_036586_044C38_rtc&assets=vv&assets=vh&tile_format=png&expression=0.03+%2B+log+%2810e-4+-+log+%280.05+%2F+%280.02+%2B+2+%2A+vv%29%29%29%3B0.05+%2B+exp+%280.25+%2A+%28log+%280.01+%2B+2+%2A+vv%29+%2B+log+%280.02+%2B+5+%2A+vh%29%29%29%3B1+-+log+%280.05+%2F+%280.045+-+0.9+%2A+vv%29%29&asset_as_band=True&rescale=0%2C.8000&rescale=0%2C1.000&rescale=0%2C1.000&format=png"
- type "application/json"
- title "TileJSON with default rendering"
roles [] 1 items
- 0 "tiles"
rendered_preview
- href "https://planetarycomputer.microsoft.com/api/data/v1/item/preview.png?collection=sentinel-1-rtc&item=S1A_IW_GRDH_1SDV_20210214T120541_20210214T120606_036586_044C38_rtc&assets=vv&assets=vh&tile_format=png&expression=0.03+%2B+log+%2810e-4+-+log+%280.05+%2F+%280.02+%2B+2+%2A+vv%29%29%29%3B0.05+%2B+exp+%280.25+%2A+%28log+%280.01+%2B+2+%2A+vv%29+%2B+log+%280.02+%2B+5+%2A+vh%29%29%29%3B1+-+log+%280.05+%2F+%280.045+-+0.9+%2A+vv%29%29&asset_as_band=True&rescale=0%2C.8000&rescale=0%2C1.000&rescale=0%2C1.000&format=png"
- type "image/png"
- title "Rendered preview"
- rel "preview"
roles [] 1 items
- 0 "overview"
bbox [] 4 items
- 0 88.21696813
- 1 26.75942978
- 2 90.99323128
- 3 28.68174958
stac_extensions [] 6 items
- 0 "https://stac-extensions.github.io/sar/v1.0.0/schema.json"
- 1 "https://stac-extensions.github.io/sat/v1.0.0/schema.json"
- 2 "https://stac-extensions.github.io/eo/v1.0.0/schema.json"
- 3 "https://stac-extensions.github.io/projection/v1.0.0/schema.json"
- 4 "https://stac-extensions.github.io/file/v2.0.0/schema.json"
- 5 "https://stac-extensions.github.io/raster/v1.1.0/schema.json"
- collection "sentinel-1-rtc"
132
- type "Feature"
- stac_version "1.0.0"
- id "S1A_IW_GRDH_1SDV_20210210T000307_20210210T000332_036520_0449D9_rtc"
properties
- datetime "2021-02-10T00:03:20.428394Z"
- platform "SENTINEL-1A"
s1:shape [] 2 items
- 0 27541
- 1 21084
proj:bbox [] 4 items
- 0 524360.0
- 1 2980860.0
- 2 799770.0
- 3 3191700.0
- proj:epsg 32645
proj:shape [] 2 items
- 0 21084
- 1 27541
- end_datetime "2021-02-10 00:03:32.927869+00:00"
- constellation "Sentinel-1"
- s1:resolution "high"
proj:transform [] 9 items
- 0 10.0
- 1 0.0
- 2 524360.0
- 3 0.0
- 4 -10.0
- 5 3191700.0
- 6 0.0
- 7 0.0
- 8 1.0
- s1:datatake_id "281049"
- start_datetime "2021-02-10 00:03:07.928920+00:00"
- s1:orbit_source "RESORB"
- s1:slice_number "12"
- s1:total_slices "17"
- sar:looks_range 5
- sat:orbit_state "descending"
- sar:product_type "GRD"
- sar:looks_azimuth 1
sar:polarizations [] 2 items
- 0 "VV"
- 1 "VH"
- sar:frequency_band "C"
- sat:absolute_orbit 36520
- sat:relative_orbit 48
- s1:processing_level "1"
- sar:instrument_mode "IW"
- sar:center_frequency 5.405
- sar:resolution_range 20
- s1:product_timeliness "Fast-24h"
- sar:resolution_azimuth 22
- sar:pixel_spacing_range 10
- sar:observation_direction "right"
- sar:pixel_spacing_azimuth 10
- sar:looks_equivalent_number 4.4
- s1:instrument_configuration_ID "6"
- sat:platform_international_designator "2014-016A"
geometry
- type "Polygon"
coordinates [] 1 items
0 [] 18 items
0 [] 2 items
- 0 89.8052744
- 1 27.0654928
1 [] 2 items
- 0 89.7847743
- 1 26.9228069
2 [] 2 items
- 0 87.3044726
- 1 27.3289313
3 [] 2 items
- 0 87.4254862
- 1 28.1938077
4 [] 2 items
- 0 87.5577139
- 1 28.8403888
5 [] 2 items
- 0 90.0495494
- 1 28.4418685
6 [] 2 items
- 0 90.0259247
- 1 28.2909979
7 [] 2 items
- 0 89.9730329
- 1 28.1917655
8 [] 2 items
- 0 89.9975753
- 1 28.1482035
9 [] 2 items
- 0 89.9710842
- 1 28.0843757
10 [] 2 items
- 0 89.9873345
- 1 28.002659
11 [] 2 items
- 0 89.9440409
- 1 27.9503721
12 [] 2 items
- 0 89.9282273
- 1 27.8234266
13 [] 2 items
- 0 89.9523144
- 1 27.6784002
14 [] 2 items
- 0 89.9213939
- 1 27.6321468
15 [] 2 items
- 0 89.9021384
- 1 27.4315583
16 [] 2 items
- 0 89.8289816
- 1 27.2743712
17 [] 2 items
- 0 89.8052744
- 1 27.0654928
links [] 7 items
0
- rel "collection"
- href "https://planetarycomputer.microsoft.com/api/stac/v1/collections/sentinel-1-rtc"
- type "application/json"
1
- rel "parent"
- href "https://planetarycomputer.microsoft.com/api/stac/v1/collections/sentinel-1-rtc"
- type "application/json"
2
- rel "root"
- href "https://planetarycomputer.microsoft.com/api/stac/v1"
- type "application/json"
- title "Microsoft Planetary Computer STAC API"
3
- rel "self"
- href "https://planetarycomputer.microsoft.com/api/stac/v1/collections/sentinel-1-rtc/items/S1A_IW_GRDH_1SDV_20210210T000307_20210210T000332_036520_0449D9_rtc"
- type "application/geo+json"
4
- rel "license"
- href "https://sentinel.esa.int/documents/247904/690755/Sentinel_Data_Legal_Notice"
5
- rel "derived_from"
- href "https://planetarycomputer.microsoft.com/api/stac/v1/collections/sentinel-1-grd/items/S1A_IW_GRDH_1SDV_20210210T000307_20210210T000332_036520_0449D9"
- type "application/json"
- title "Sentinel 1 GRD Item"
6
- rel "preview"
- href "https://planetarycomputer.microsoft.com/api/data/v1/item/map?collection=sentinel-1-rtc&item=S1A_IW_GRDH_1SDV_20210210T000307_20210210T000332_036520_0449D9_rtc"
- type "text/html"
- title "Map of item"
assets
vh
- href "https://sentinel1euwestrtc.blob.core.windows.net/sentinel1-grd-rtc/GRD/2021/2/10/IW/DV/S1A_IW_GRDH_1SDV_20210210T000307_20210210T000332_036520_0449D9_45E6/measurement/iw-vh.rtc.tiff"
- type "image/tiff; application=geotiff; profile=cloud-optimized"
- title "VH: vertical transmit, horizontal receive"
- description "Terrain-corrected gamma naught values of signal transmitted with vertical polarization and received with horizontal polarization with radiometric terrain correction applied."
- file:size 1841853646
- file:checksum "15c868b1e130b2a515dff3b476ce6f9c"
raster:bands [] 1 items
0
- nodata -32768
- data_type "float32"
- spatial_resolution 10.0
roles [] 1 items
- 0 "data"
vv
- href "https://sentinel1euwestrtc.blob.core.windows.net/sentinel1-grd-rtc/GRD/2021/2/10/IW/DV/S1A_IW_GRDH_1SDV_20210210T000307_20210210T000332_036520_0449D9_45E6/measurement/iw-vv.rtc.tiff"
- type "image/tiff; application=geotiff; profile=cloud-optimized"
- title "VV: vertical transmit, vertical receive"
- description "Terrain-corrected gamma naught values of signal transmitted with vertical polarization and received with vertical polarization with radiometric terrain correction applied."
- file:size 1847695512
- file:checksum "1db79b216dff9a299c061a6fac824977"
raster:bands [] 1 items
0
- nodata -32768
- data_type "float32"
- spatial_resolution 10.0
roles [] 1 items
- 0 "data"
tilejson
- href "https://planetarycomputer.microsoft.com/api/data/v1/item/tilejson.json?collection=sentinel-1-rtc&item=S1A_IW_GRDH_1SDV_20210210T000307_20210210T000332_036520_0449D9_rtc&assets=vv&assets=vh&tile_format=png&expression=0.03+%2B+log+%2810e-4+-+log+%280.05+%2F+%280.02+%2B+2+%2A+vv%29%29%29%3B0.05+%2B+exp+%280.25+%2A+%28log+%280.01+%2B+2+%2A+vv%29+%2B+log+%280.02+%2B+5+%2A+vh%29%29%29%3B1+-+log+%280.05+%2F+%280.045+-+0.9+%2A+vv%29%29&asset_as_band=True&rescale=0%2C.8000&rescale=0%2C1.000&rescale=0%2C1.000&format=png"
- type "application/json"
- title "TileJSON with default rendering"
roles [] 1 items
- 0 "tiles"
rendered_preview
- href "https://planetarycomputer.microsoft.com/api/data/v1/item/preview.png?collection=sentinel-1-rtc&item=S1A_IW_GRDH_1SDV_20210210T000307_20210210T000332_036520_0449D9_rtc&assets=vv&assets=vh&tile_format=png&expression=0.03+%2B+log+%2810e-4+-+log+%280.05+%2F+%280.02+%2B+2+%2A+vv%29%29%29%3B0.05+%2B+exp+%280.25+%2A+%28log+%280.01+%2B+2+%2A+vv%29+%2B+log+%280.02+%2B+5+%2A+vh%29%29%29%3B1+-+log+%280.05+%2F+%280.045+-+0.9+%2A+vv%29%29&asset_as_band=True&rescale=0%2C.8000&rescale=0%2C1.000&rescale=0%2C1.000&format=png"
- type "image/png"
- title "Rendered preview"
- rel "preview"
roles [] 1 items
- 0 "overview"
bbox [] 4 items
- 0 87.30447261
- 1 26.92280692
- 2 90.04954942
- 3 28.84038879
stac_extensions [] 6 items
- 0 "https://stac-extensions.github.io/sar/v1.0.0/schema.json"
- 1 "https://stac-extensions.github.io/sat/v1.0.0/schema.json"
- 2 "https://stac-extensions.github.io/eo/v1.0.0/schema.json"
- 3 "https://stac-extensions.github.io/projection/v1.0.0/schema.json"
- 4 "https://stac-extensions.github.io/file/v2.0.0/schema.json"
- 5 "https://stac-extensions.github.io/raster/v1.1.0/schema.json"
- collection "sentinel-1-rtc"
133
- type "Feature"
- stac_version "1.0.0"
- id "S1A_IW_GRDH_1SDV_20210207T121349_20210207T121414_036484_04489D_rtc"
properties
- datetime "2021-02-07T12:14:01.793585Z"
- platform "SENTINEL-1A"
s1:shape [] 2 items
- 0 28242
- 1 21600
proj:bbox [] 4 items
- 0 420920.0
- 1 2916200.0
- 2 703340.0
- 3 3132200.0
- proj:epsg 32645
proj:shape [] 2 items
- 0 21600
- 1 28242
- end_datetime "2021-02-07 12:14:14.293448+00:00"
- constellation "Sentinel-1"
- s1:resolution "high"
proj:transform [] 9 items
- 0 10.0
- 1 0.0
- 2 420920.0
- 3 0.0
- 4 -10.0
- 5 3132200.0
- 6 0.0
- 7 0.0
- 8 1.0
- s1:datatake_id "280733"
- start_datetime "2021-02-07 12:13:49.293723+00:00"
- s1:orbit_source "RESORB"
- s1:slice_number "6"
- s1:total_slices "20"
- sar:looks_range 5
- sat:orbit_state "ascending"
- sar:product_type "GRD"
- sar:looks_azimuth 1
sar:polarizations [] 2 items
- 0 "VV"
- 1 "VH"
- sar:frequency_band "C"
- sat:absolute_orbit 36484
- sat:relative_orbit 12
- s1:processing_level "1"
- sar:instrument_mode "IW"
- sar:center_frequency 5.405
- sar:resolution_range 20
- s1:product_timeliness "Fast-24h"
- sar:resolution_azimuth 22
- sar:pixel_spacing_range 10
- sar:observation_direction "right"
- sar:pixel_spacing_azimuth 10
- sar:looks_equivalent_number 4.4
- s1:instrument_configuration_ID "6"
- sat:platform_international_designator "2014-016A"
geometry
- type "Polygon"
coordinates [] 1 items
0 [] 16 items
0 [] 2 items
- 0 87.864834
- 1 26.5975279
1 [] 2 items
- 0 86.4989777
- 1 26.366324
2 [] 2 items
- 0 86.3551315
- 1 27.1612996
3 [] 2 items
- 0 86.3184713
- 1 27.2313639
4 [] 2 items
- 0 86.3267796
- 1 27.3776551
5 [] 2 items
- 0 86.2773714
- 1 27.4643442
6 [] 2 items
- 0 86.2705674
- 1 27.6975774
7 [] 2 items
- 0 86.2161935
- 1 27.7561375
8 [] 2 items
- 0 86.2344834
- 1 27.7816062
9 [] 2 items
- 0 86.2099144
- 1 27.7825512
10 [] 2 items
- 0 86.2037615
- 1 27.8468787
11 [] 2 items
- 0 86.2106702
- 1 27.8815369
12 [] 2 items
- 0 88.7380481
- 1 28.2894289
13 [] 2 items
- 0 88.9223382
- 1 27.3276824
14 [] 2 items
- 0 88.9845651
- 1 26.7767183
15 [] 2 items
- 0 87.864834
- 1 26.5975279
links [] 7 items
0
- rel "collection"
- href "https://planetarycomputer.microsoft.com/api/stac/v1/collections/sentinel-1-rtc"
- type "application/json"
1
- rel "parent"
- href "https://planetarycomputer.microsoft.com/api/stac/v1/collections/sentinel-1-rtc"
- type "application/json"
2
- rel "root"
- href "https://planetarycomputer.microsoft.com/api/stac/v1"
- type "application/json"
- title "Microsoft Planetary Computer STAC API"
3
- rel "self"
- href "https://planetarycomputer.microsoft.com/api/stac/v1/collections/sentinel-1-rtc/items/S1A_IW_GRDH_1SDV_20210207T121349_20210207T121414_036484_04489D_rtc"
- type "application/geo+json"
4
- rel "license"
- href "https://sentinel.esa.int/documents/247904/690755/Sentinel_Data_Legal_Notice"
5
- rel "derived_from"
- href "https://planetarycomputer.microsoft.com/api/stac/v1/collections/sentinel-1-grd/items/S1A_IW_GRDH_1SDV_20210207T121349_20210207T121414_036484_04489D"
- type "application/json"
- title "Sentinel 1 GRD Item"
6
- rel "preview"
- href "https://planetarycomputer.microsoft.com/api/data/v1/item/map?collection=sentinel-1-rtc&item=S1A_IW_GRDH_1SDV_20210207T121349_20210207T121414_036484_04489D_rtc"
- type "text/html"
- title "Map of item"
assets
vh
- href "https://sentinel1euwestrtc.blob.core.windows.net/sentinel1-grd-rtc/GRD/2021/2/7/IW/DV/S1A_IW_GRDH_1SDV_20210207T121349_20210207T121414_036484_04489D_60B2/measurement/iw-vh.rtc.tiff"
- type "image/tiff; application=geotiff; profile=cloud-optimized"
- title "VH: vertical transmit, horizontal receive"
- description "Terrain-corrected gamma naught values of signal transmitted with vertical polarization and received with horizontal polarization with radiometric terrain correction applied."
- file:size 1872843598
- file:checksum "a449765d7bcfe68879a8fd8f753fb9cc"
raster:bands [] 1 items
0
- nodata -32768
- data_type "float32"
- spatial_resolution 10.0
roles [] 1 items
- 0 "data"
vv
- href "https://sentinel1euwestrtc.blob.core.windows.net/sentinel1-grd-rtc/GRD/2021/2/7/IW/DV/S1A_IW_GRDH_1SDV_20210207T121349_20210207T121414_036484_04489D_60B2/measurement/iw-vv.rtc.tiff"
- type "image/tiff; application=geotiff; profile=cloud-optimized"
- title "VV: vertical transmit, vertical receive"
- description "Terrain-corrected gamma naught values of signal transmitted with vertical polarization and received with vertical polarization with radiometric terrain correction applied."
- file:size 1879673984
- file:checksum "58d4b4861bb49acc5e80d076ff195487"
raster:bands [] 1 items
0
- nodata -32768
- data_type "float32"
- spatial_resolution 10.0
roles [] 1 items
- 0 "data"
tilejson
- href "https://planetarycomputer.microsoft.com/api/data/v1/item/tilejson.json?collection=sentinel-1-rtc&item=S1A_IW_GRDH_1SDV_20210207T121349_20210207T121414_036484_04489D_rtc&assets=vv&assets=vh&tile_format=png&expression=0.03+%2B+log+%2810e-4+-+log+%280.05+%2F+%280.02+%2B+2+%2A+vv%29%29%29%3B0.05+%2B+exp+%280.25+%2A+%28log+%280.01+%2B+2+%2A+vv%29+%2B+log+%280.02+%2B+5+%2A+vh%29%29%29%3B1+-+log+%280.05+%2F+%280.045+-+0.9+%2A+vv%29%29&asset_as_band=True&rescale=0%2C.8000&rescale=0%2C1.000&rescale=0%2C1.000&format=png"
- type "application/json"
- title "TileJSON with default rendering"
roles [] 1 items
- 0 "tiles"
rendered_preview
- href "https://planetarycomputer.microsoft.com/api/data/v1/item/preview.png?collection=sentinel-1-rtc&item=S1A_IW_GRDH_1SDV_20210207T121349_20210207T121414_036484_04489D_rtc&assets=vv&assets=vh&tile_format=png&expression=0.03+%2B+log+%2810e-4+-+log+%280.05+%2F+%280.02+%2B+2+%2A+vv%29%29%29%3B0.05+%2B+exp+%280.25+%2A+%28log+%280.01+%2B+2+%2A+vv%29+%2B+log+%280.02+%2B+5+%2A+vh%29%29%29%3B1+-+log+%280.05+%2F+%280.045+-+0.9+%2A+vv%29%29&asset_as_band=True&rescale=0%2C.8000&rescale=0%2C1.000&rescale=0%2C1.000&format=png"
- type "image/png"
- title "Rendered preview"
- rel "preview"
roles [] 1 items
- 0 "overview"
bbox [] 4 items
- 0 86.20376146
- 1 26.36632403
- 2 88.98456513
- 3 28.28942888
stac_extensions [] 6 items
- 0 "https://stac-extensions.github.io/sar/v1.0.0/schema.json"
- 1 "https://stac-extensions.github.io/sat/v1.0.0/schema.json"
- 2 "https://stac-extensions.github.io/eo/v1.0.0/schema.json"
- 3 "https://stac-extensions.github.io/projection/v1.0.0/schema.json"
- 4 "https://stac-extensions.github.io/file/v2.0.0/schema.json"
- 5 "https://stac-extensions.github.io/raster/v1.1.0/schema.json"
- collection "sentinel-1-rtc"
134
- type "Feature"
- stac_version "1.0.0"
- id "S1A_IW_GRDH_1SDV_20210202T120542_20210202T120607_036411_044618_rtc"
properties
- datetime "2021-02-02T12:05:54.664862Z"
- platform "SENTINEL-1A"
s1:shape [] 2 items
- 0 28431
- 1 21971
proj:bbox [] 4 items
- 0 618100.0
- 1 2960430.0
- 2 902410.0
- 3 3180140.0
- proj:epsg 32645
proj:shape [] 2 items
- 0 21971
- 1 28431
- end_datetime "2021-02-02 12:06:07.164051+00:00"
- constellation "Sentinel-1"
- s1:resolution "high"
proj:transform [] 9 items
- 0 10.0
- 1 0.0
- 2 618100.0
- 3 0.0
- 4 -10.0
- 5 3180140.0
- 6 0.0
- 7 0.0
- 8 1.0
- s1:datatake_id "280088"
- start_datetime "2021-02-02 12:05:42.165674+00:00"
- s1:orbit_source "RESORB"
- s1:slice_number "6"
- s1:total_slices "21"
- sar:looks_range 5
- sat:orbit_state "ascending"
- sar:product_type "GRD"
- sar:looks_azimuth 1
sar:polarizations [] 2 items
- 0 "VV"
- 1 "VH"
- sar:frequency_band "C"
- sat:absolute_orbit 36411
- sat:relative_orbit 114
- s1:processing_level "1"
- sar:instrument_mode "IW"
- sar:center_frequency 5.405
- sar:resolution_range 20
- s1:product_timeliness "Fast-24h"
- sar:resolution_azimuth 22
- sar:pixel_spacing_range 10
- sar:observation_direction "right"
- sar:pixel_spacing_azimuth 10
- sar:looks_equivalent_number 4.4
- s1:instrument_configuration_ID "6"
- sat:platform_international_designator "2014-016A"
geometry
- type "Polygon"
coordinates [] 1 items
0 [] 14 items
0 [] 2 items
- 0 89.9814365
- 1 27.0125194
1 [] 2 items
- 0 90.9930331
- 1 27.1728541
2 [] 2 items
- 0 90.7241367
- 1 28.6818453
3 [] 2 items
- 0 88.2167642
- 1 28.2796804
4 [] 2 items
- 0 88.3537524
- 1 27.7232097
5 [] 2 items
- 0 88.3290449
- 1 27.5841725
6 [] 2 items
- 0 88.3755761
- 1 27.5217983
7 [] 2 items
- 0 88.3570839
- 1 27.4090581
8 [] 2 items
- 0 88.3995564
- 1 27.3361551
9 [] 2 items
- 0 88.3786297
- 1 27.303145
10 [] 2 items
- 0 88.4157012
- 1 27.2064601
11 [] 2 items
- 0 88.4033356
- 1 27.0895067
12 [] 2 items
- 0 88.4744257
- 1 26.7595221
13 [] 2 items
- 0 89.9814365
- 1 27.0125194
links [] 7 items
0
- rel "collection"
- href "https://planetarycomputer.microsoft.com/api/stac/v1/collections/sentinel-1-rtc"
- type "application/json"
1
- rel "parent"
- href "https://planetarycomputer.microsoft.com/api/stac/v1/collections/sentinel-1-rtc"
- type "application/json"
2
- rel "root"
- href "https://planetarycomputer.microsoft.com/api/stac/v1"
- type "application/json"
- title "Microsoft Planetary Computer STAC API"
3
- rel "self"
- href "https://planetarycomputer.microsoft.com/api/stac/v1/collections/sentinel-1-rtc/items/S1A_IW_GRDH_1SDV_20210202T120542_20210202T120607_036411_044618_rtc"
- type "application/geo+json"
4
- rel "license"
- href "https://sentinel.esa.int/documents/247904/690755/Sentinel_Data_Legal_Notice"
5
- rel "derived_from"
- href "https://planetarycomputer.microsoft.com/api/stac/v1/collections/sentinel-1-grd/items/S1A_IW_GRDH_1SDV_20210202T120542_20210202T120607_036411_044618"
- type "application/json"
- title "Sentinel 1 GRD Item"
6
- rel "preview"
- href "https://planetarycomputer.microsoft.com/api/data/v1/item/map?collection=sentinel-1-rtc&item=S1A_IW_GRDH_1SDV_20210202T120542_20210202T120607_036411_044618_rtc"
- type "text/html"
- title "Map of item"
assets
vh
- href "https://sentinel1euwestrtc.blob.core.windows.net/sentinel1-grd-rtc/GRD/2021/2/2/IW/DV/S1A_IW_GRDH_1SDV_20210202T120542_20210202T120607_036411_044618_FA49/measurement/iw-vh.rtc.tiff"
- type "image/tiff; application=geotiff; profile=cloud-optimized"
- title "VH: vertical transmit, horizontal receive"
- description "Terrain-corrected gamma naught values of signal transmitted with vertical polarization and received with horizontal polarization with radiometric terrain correction applied."
- file:size 1852343464
- file:checksum "3d9b85b4578c08f70cf65978a3842518"
raster:bands [] 1 items
0
- nodata -32768
- data_type "float32"
- spatial_resolution 10.0
roles [] 1 items
- 0 "data"
vv
- href "https://sentinel1euwestrtc.blob.core.windows.net/sentinel1-grd-rtc/GRD/2021/2/2/IW/DV/S1A_IW_GRDH_1SDV_20210202T120542_20210202T120607_036411_044618_FA49/measurement/iw-vv.rtc.tiff"
- type "image/tiff; application=geotiff; profile=cloud-optimized"
- title "VV: vertical transmit, vertical receive"
- description "Terrain-corrected gamma naught values of signal transmitted with vertical polarization and received with vertical polarization with radiometric terrain correction applied."
- file:size 1859133861
- file:checksum "95efe91ab80e01479ee73b022c81d42c"
raster:bands [] 1 items
0
- nodata -32768
- data_type "float32"
- spatial_resolution 10.0
roles [] 1 items
- 0 "data"
tilejson
- href "https://planetarycomputer.microsoft.com/api/data/v1/item/tilejson.json?collection=sentinel-1-rtc&item=S1A_IW_GRDH_1SDV_20210202T120542_20210202T120607_036411_044618_rtc&assets=vv&assets=vh&tile_format=png&expression=0.03+%2B+log+%2810e-4+-+log+%280.05+%2F+%280.02+%2B+2+%2A+vv%29%29%29%3B0.05+%2B+exp+%280.25+%2A+%28log+%280.01+%2B+2+%2A+vv%29+%2B+log+%280.02+%2B+5+%2A+vh%29%29%29%3B1+-+log+%280.05+%2F+%280.045+-+0.9+%2A+vv%29%29&asset_as_band=True&rescale=0%2C.8000&rescale=0%2C1.000&rescale=0%2C1.000&format=png"
- type "application/json"
- title "TileJSON with default rendering"
roles [] 1 items
- 0 "tiles"
rendered_preview
- href "https://planetarycomputer.microsoft.com/api/data/v1/item/preview.png?collection=sentinel-1-rtc&item=S1A_IW_GRDH_1SDV_20210202T120542_20210202T120607_036411_044618_rtc&assets=vv&assets=vh&tile_format=png&expression=0.03+%2B+log+%2810e-4+-+log+%280.05+%2F+%280.02+%2B+2+%2A+vv%29%29%29%3B0.05+%2B+exp+%280.25+%2A+%28log+%280.01+%2B+2+%2A+vv%29+%2B+log+%280.02+%2B+5+%2A+vh%29%29%29%3B1+-+log+%280.05+%2F+%280.045+-+0.9+%2A+vv%29%29&asset_as_band=True&rescale=0%2C.8000&rescale=0%2C1.000&rescale=0%2C1.000&format=png"
- type "image/png"
- title "Rendered preview"
- rel "preview"
roles [] 1 items
- 0 "overview"
bbox [] 4 items
- 0 88.21676423
- 1 26.75952213
- 2 90.99303309
- 3 28.68184528
stac_extensions [] 6 items
- 0 "https://stac-extensions.github.io/sar/v1.0.0/schema.json"
- 1 "https://stac-extensions.github.io/sat/v1.0.0/schema.json"
- 2 "https://stac-extensions.github.io/eo/v1.0.0/schema.json"
- 3 "https://stac-extensions.github.io/projection/v1.0.0/schema.json"
- 4 "https://stac-extensions.github.io/file/v2.0.0/schema.json"
- 5 "https://stac-extensions.github.io/raster/v1.1.0/schema.json"
- collection "sentinel-1-rtc"
135
- type "Feature"
- stac_version "1.0.0"
- id "S1A_IW_GRDH_1SDV_20210129T000308_20210129T000333_036345_0443C6_rtc"
properties
- datetime "2021-01-29T00:03:20.796758Z"
- platform "SENTINEL-1A"
s1:shape [] 2 items
- 0 27543
- 1 21085
proj:bbox [] 4 items
- 0 524340.0
- 1 2980850.0
- 2 799770.0
- 3 3191700.0
- proj:epsg 32645
proj:shape [] 2 items
- 0 21085
- 1 27543
- end_datetime "2021-01-29 00:03:33.296249+00:00"
- constellation "Sentinel-1"
- s1:resolution "high"
proj:transform [] 9 items
- 0 10.0
- 1 0.0
- 2 524340.0
- 3 0.0
- 4 -10.0
- 5 3191700.0
- 6 0.0
- 7 0.0
- 8 1.0
- s1:datatake_id "279494"
- start_datetime "2021-01-29 00:03:08.297266+00:00"
- s1:orbit_source "RESORB"
- s1:slice_number "12"
- s1:total_slices "17"
- sar:looks_range 5
- sat:orbit_state "descending"
- sar:product_type "GRD"
- sar:looks_azimuth 1
sar:polarizations [] 2 items
- 0 "VV"
- 1 "VH"
- sar:frequency_band "C"
- sat:absolute_orbit 36345
- sat:relative_orbit 48
- s1:processing_level "1"
- sar:instrument_mode "IW"
- sar:center_frequency 5.405
- sar:resolution_range 20
- s1:product_timeliness "Fast-24h"
- sar:resolution_azimuth 22
- sar:pixel_spacing_range 10
- sar:observation_direction "right"
- sar:pixel_spacing_azimuth 10
- sar:looks_equivalent_number 4.4
- s1:instrument_configuration_ID "6"
- sat:platform_international_designator "2014-016A"
geometry
- type "Polygon"
coordinates [] 1 items
0 [] 18 items
0 [] 2 items
- 0 89.8051737
- 1 27.0654948
1 [] 2 items
- 0 89.7842713
- 1 26.9228168
2 [] 2 items
- 0 87.3044738
- 1 27.3293827
3 [] 2 items
- 0 87.4254876
- 1 28.1941687
4 [] 2 items
- 0 87.5578159
- 1 28.8402981
5 [] 2 items
- 0 90.0495468
- 1 28.4417784
6 [] 2 items
- 0 90.0259298
- 1 28.2911782
7 [] 2 items
- 0 89.9729262
- 1 28.1915874
8 [] 2 items
- 0 89.9974761
- 1 28.1482959
9 [] 2 items
- 0 89.9710842
- 1 28.0843757
10 [] 2 items
- 0 89.9873419
- 1 28.0029295
11 [] 2 items
- 0 89.9439344
- 1 27.950194
12 [] 2 items
- 0 89.9282273
- 1 27.8234266
13 [] 2 items
- 0 89.9522131
- 1 27.6784023
14 [] 2 items
- 0 89.9213987
- 1 27.6323271
15 [] 2 items
- 0 89.9018423
- 1 27.4318351
16 [] 2 items
- 0 89.8289862
- 1 27.2745515
17 [] 2 items
- 0 89.8051737
- 1 27.0654948
links [] 7 items
0
- rel "collection"
- href "https://planetarycomputer.microsoft.com/api/stac/v1/collections/sentinel-1-rtc"
- type "application/json"
1
- rel "parent"
- href "https://planetarycomputer.microsoft.com/api/stac/v1/collections/sentinel-1-rtc"
- type "application/json"
2
- rel "root"
- href "https://planetarycomputer.microsoft.com/api/stac/v1"
- type "application/json"
- title "Microsoft Planetary Computer STAC API"
3
- rel "self"
- href "https://planetarycomputer.microsoft.com/api/stac/v1/collections/sentinel-1-rtc/items/S1A_IW_GRDH_1SDV_20210129T000308_20210129T000333_036345_0443C6_rtc"
- type "application/geo+json"
4
- rel "license"
- href "https://sentinel.esa.int/documents/247904/690755/Sentinel_Data_Legal_Notice"
5
- rel "derived_from"
- href "https://planetarycomputer.microsoft.com/api/stac/v1/collections/sentinel-1-grd/items/S1A_IW_GRDH_1SDV_20210129T000308_20210129T000333_036345_0443C6"
- type "application/json"
- title "Sentinel 1 GRD Item"
6
- rel "preview"
- href "https://planetarycomputer.microsoft.com/api/data/v1/item/map?collection=sentinel-1-rtc&item=S1A_IW_GRDH_1SDV_20210129T000308_20210129T000333_036345_0443C6_rtc"
- type "text/html"
- title "Map of item"
assets
vh
- href "https://sentinel1euwestrtc.blob.core.windows.net/sentinel1-grd-rtc/GRD/2021/1/29/IW/DV/S1A_IW_GRDH_1SDV_20210129T000308_20210129T000333_036345_0443C6_E01A/measurement/iw-vh.rtc.tiff"
- type "image/tiff; application=geotiff; profile=cloud-optimized"
- title "VH: vertical transmit, horizontal receive"
- description "Terrain-corrected gamma naught values of signal transmitted with vertical polarization and received with horizontal polarization with radiometric terrain correction applied."
- file:size 1841294015
- file:checksum "dd31c2f252d6d235fae3434fd52bf337"
raster:bands [] 1 items
0
- nodata -32768
- data_type "float32"
- spatial_resolution 10.0
roles [] 1 items
- 0 "data"
vv
- href "https://sentinel1euwestrtc.blob.core.windows.net/sentinel1-grd-rtc/GRD/2021/1/29/IW/DV/S1A_IW_GRDH_1SDV_20210129T000308_20210129T000333_036345_0443C6_E01A/measurement/iw-vv.rtc.tiff"
- type "image/tiff; application=geotiff; profile=cloud-optimized"
- title "VV: vertical transmit, vertical receive"
- description "Terrain-corrected gamma naught values of signal transmitted with vertical polarization and received with vertical polarization with radiometric terrain correction applied."
- file:size 1846880291
- file:checksum "bb053aaa773133336e184201b8078cf2"
raster:bands [] 1 items
0
- nodata -32768
- data_type "float32"
- spatial_resolution 10.0
roles [] 1 items
- 0 "data"
tilejson
- href "https://planetarycomputer.microsoft.com/api/data/v1/item/tilejson.json?collection=sentinel-1-rtc&item=S1A_IW_GRDH_1SDV_20210129T000308_20210129T000333_036345_0443C6_rtc&assets=vv&assets=vh&tile_format=png&expression=0.03+%2B+log+%2810e-4+-+log+%280.05+%2F+%280.02+%2B+2+%2A+vv%29%29%29%3B0.05+%2B+exp+%280.25+%2A+%28log+%280.01+%2B+2+%2A+vv%29+%2B+log+%280.02+%2B+5+%2A+vh%29%29%29%3B1+-+log+%280.05+%2F+%280.045+-+0.9+%2A+vv%29%29&asset_as_band=True&rescale=0%2C.8000&rescale=0%2C1.000&rescale=0%2C1.000&format=png"
- type "application/json"
- title "TileJSON with default rendering"
roles [] 1 items
- 0 "tiles"
rendered_preview
- href "https://planetarycomputer.microsoft.com/api/data/v1/item/preview.png?collection=sentinel-1-rtc&item=S1A_IW_GRDH_1SDV_20210129T000308_20210129T000333_036345_0443C6_rtc&assets=vv&assets=vh&tile_format=png&expression=0.03+%2B+log+%2810e-4+-+log+%280.05+%2F+%280.02+%2B+2+%2A+vv%29%29%29%3B0.05+%2B+exp+%280.25+%2A+%28log+%280.01+%2B+2+%2A+vv%29+%2B+log+%280.02+%2B+5+%2A+vh%29%29%29%3B1+-+log+%280.05+%2F+%280.045+-+0.9+%2A+vv%29%29&asset_as_band=True&rescale=0%2C.8000&rescale=0%2C1.000&rescale=0%2C1.000&format=png"
- type "image/png"
- title "Rendered preview"
- rel "preview"
roles [] 1 items
- 0 "overview"
bbox [] 4 items
- 0 87.30447385
- 1 26.92281685
- 2 90.04954684
- 3 28.84029811
stac_extensions [] 6 items
- 0 "https://stac-extensions.github.io/sar/v1.0.0/schema.json"
- 1 "https://stac-extensions.github.io/sat/v1.0.0/schema.json"
- 2 "https://stac-extensions.github.io/eo/v1.0.0/schema.json"
- 3 "https://stac-extensions.github.io/projection/v1.0.0/schema.json"
- 4 "https://stac-extensions.github.io/file/v2.0.0/schema.json"
- 5 "https://stac-extensions.github.io/raster/v1.1.0/schema.json"
- collection "sentinel-1-rtc"
136
- type "Feature"
- stac_version "1.0.0"
- id "S1A_IW_GRDH_1SDV_20210126T121349_20210126T121414_036309_04428F_rtc"
properties
- datetime "2021-01-26T12:14:02.170790Z"
- platform "SENTINEL-1A"
s1:shape [] 2 items
- 0 28244
- 1 21600
proj:bbox [] 4 items
- 0 420940.0
- 1 2916200.0
- 2 703380.0
- 3 3132200.0
- proj:epsg 32645
proj:shape [] 2 items
- 0 21600
- 1 28244
- end_datetime "2021-01-26 12:14:14.670649+00:00"
- constellation "Sentinel-1"
- s1:resolution "high"
proj:transform [] 9 items
- 0 10.0
- 1 0.0
- 2 420940.0
- 3 0.0
- 4 -10.0
- 5 3132200.0
- 6 0.0
- 7 0.0
- 8 1.0
- s1:datatake_id "279183"
- start_datetime "2021-01-26 12:13:49.670932+00:00"
- s1:orbit_source "RESORB"
- s1:slice_number "6"
- s1:total_slices "20"
- sar:looks_range 5
- sat:orbit_state "ascending"
- sar:product_type "GRD"
- sar:looks_azimuth 1
sar:polarizations [] 2 items
- 0 "VV"
- 1 "VH"
- sar:frequency_band "C"
- sat:absolute_orbit 36309
- sat:relative_orbit 12
- s1:processing_level "1"
- sar:instrument_mode "IW"
- sar:center_frequency 5.405
- sar:resolution_range 20
- s1:product_timeliness "Fast-24h"
- sar:resolution_azimuth 22
- sar:pixel_spacing_range 10
- sar:observation_direction "right"
- sar:pixel_spacing_azimuth 10
- sar:looks_equivalent_number 4.4
- s1:instrument_configuration_ID "6"
- sat:platform_international_designator "2014-016A"
geometry
- type "Polygon"
coordinates [] 1 items
0 [] 16 items
0 [] 2 items
- 0 87.8651353
- 1 26.597526
1 [] 2 items
- 0 86.4992784
- 1 26.3663251
2 [] 2 items
- 0 86.3555368
- 1 27.1610306
3 [] 2 items
- 0 86.3188758
- 1 27.2312756
4 [] 2 items
- 0 86.3275919
- 1 27.3771174
5 [] 2 items
- 0 86.277775
- 1 27.4645268
6 [] 2 items
- 0 86.2711759
- 1 27.6975806
7 [] 2 items
- 0 86.2164966
- 1 27.7563197
8 [] 2 items
- 0 86.2347885
- 1 27.7815176
9 [] 2 items
- 0 86.2101128
- 1 27.7831842
10 [] 2 items
- 0 86.2040661
- 1 27.8468804
11 [] 2 items
- 0 86.2109749
- 1 27.8815386
12 [] 2 items
- 0 88.7384558
- 1 28.2894237
13 [] 2 items
- 0 88.9225465
- 1 27.3280405
14 [] 2 items
- 0 88.9849673
- 1 26.7767126
15 [] 2 items
- 0 87.8651353
- 1 26.597526
links [] 7 items
0
- rel "collection"
- href "https://planetarycomputer.microsoft.com/api/stac/v1/collections/sentinel-1-rtc"
- type "application/json"
1
- rel "parent"
- href "https://planetarycomputer.microsoft.com/api/stac/v1/collections/sentinel-1-rtc"
- type "application/json"
2
- rel "root"
- href "https://planetarycomputer.microsoft.com/api/stac/v1"
- type "application/json"
- title "Microsoft Planetary Computer STAC API"
3
- rel "self"
- href "https://planetarycomputer.microsoft.com/api/stac/v1/collections/sentinel-1-rtc/items/S1A_IW_GRDH_1SDV_20210126T121349_20210126T121414_036309_04428F_rtc"
- type "application/geo+json"
4
- rel "license"
- href "https://sentinel.esa.int/documents/247904/690755/Sentinel_Data_Legal_Notice"
5
- rel "derived_from"
- href "https://planetarycomputer.microsoft.com/api/stac/v1/collections/sentinel-1-grd/items/S1A_IW_GRDH_1SDV_20210126T121349_20210126T121414_036309_04428F"
- type "application/json"
- title "Sentinel 1 GRD Item"
6
- rel "preview"
- href "https://planetarycomputer.microsoft.com/api/data/v1/item/map?collection=sentinel-1-rtc&item=S1A_IW_GRDH_1SDV_20210126T121349_20210126T121414_036309_04428F_rtc"
- type "text/html"
- title "Map of item"
assets
vh
- href "https://sentinel1euwestrtc.blob.core.windows.net/sentinel1-grd-rtc/GRD/2021/1/26/IW/DV/S1A_IW_GRDH_1SDV_20210126T121349_20210126T121414_036309_04428F_059D/measurement/iw-vh.rtc.tiff"
- type "image/tiff; application=geotiff; profile=cloud-optimized"
- title "VH: vertical transmit, horizontal receive"
- description "Terrain-corrected gamma naught values of signal transmitted with vertical polarization and received with horizontal polarization with radiometric terrain correction applied."
- file:size 1873636693
- file:checksum "f111755410354282ec44a5a476e5164b"
raster:bands [] 1 items
0
- nodata -32768
- data_type "float32"
- spatial_resolution 10.0
roles [] 1 items
- 0 "data"
vv
- href "https://sentinel1euwestrtc.blob.core.windows.net/sentinel1-grd-rtc/GRD/2021/1/26/IW/DV/S1A_IW_GRDH_1SDV_20210126T121349_20210126T121414_036309_04428F_059D/measurement/iw-vv.rtc.tiff"
- type "image/tiff; application=geotiff; profile=cloud-optimized"
- title "VV: vertical transmit, vertical receive"
- description "Terrain-corrected gamma naught values of signal transmitted with vertical polarization and received with vertical polarization with radiometric terrain correction applied."
- file:size 1880219969
- file:checksum "d2503452e8f718f8ad78cc7e327a7e50"
raster:bands [] 1 items
0
- nodata -32768
- data_type "float32"
- spatial_resolution 10.0
roles [] 1 items
- 0 "data"
tilejson
- href "https://planetarycomputer.microsoft.com/api/data/v1/item/tilejson.json?collection=sentinel-1-rtc&item=S1A_IW_GRDH_1SDV_20210126T121349_20210126T121414_036309_04428F_rtc&assets=vv&assets=vh&tile_format=png&expression=0.03+%2B+log+%2810e-4+-+log+%280.05+%2F+%280.02+%2B+2+%2A+vv%29%29%29%3B0.05+%2B+exp+%280.25+%2A+%28log+%280.01+%2B+2+%2A+vv%29+%2B+log+%280.02+%2B+5+%2A+vh%29%29%29%3B1+-+log+%280.05+%2F+%280.045+-+0.9+%2A+vv%29%29&asset_as_band=True&rescale=0%2C.8000&rescale=0%2C1.000&rescale=0%2C1.000&format=png"
- type "application/json"
- title "TileJSON with default rendering"
roles [] 1 items
- 0 "tiles"
rendered_preview
- href "https://planetarycomputer.microsoft.com/api/data/v1/item/preview.png?collection=sentinel-1-rtc&item=S1A_IW_GRDH_1SDV_20210126T121349_20210126T121414_036309_04428F_rtc&assets=vv&assets=vh&tile_format=png&expression=0.03+%2B+log+%2810e-4+-+log+%280.05+%2F+%280.02+%2B+2+%2A+vv%29%29%29%3B0.05+%2B+exp+%280.25+%2A+%28log+%280.01+%2B+2+%2A+vv%29+%2B+log+%280.02+%2B+5+%2A+vh%29%29%29%3B1+-+log+%280.05+%2F+%280.045+-+0.9+%2A+vv%29%29&asset_as_band=True&rescale=0%2C.8000&rescale=0%2C1.000&rescale=0%2C1.000&format=png"
- type "image/png"
- title "Rendered preview"
- rel "preview"
roles [] 1 items
- 0 "overview"
bbox [] 4 items
- 0 86.20406612
- 1 26.36632508
- 2 88.98496726
- 3 28.28942369
stac_extensions [] 6 items
- 0 "https://stac-extensions.github.io/sar/v1.0.0/schema.json"
- 1 "https://stac-extensions.github.io/sat/v1.0.0/schema.json"
- 2 "https://stac-extensions.github.io/eo/v1.0.0/schema.json"
- 3 "https://stac-extensions.github.io/projection/v1.0.0/schema.json"
- 4 "https://stac-extensions.github.io/file/v2.0.0/schema.json"
- 5 "https://stac-extensions.github.io/raster/v1.1.0/schema.json"
- collection "sentinel-1-rtc"
137
- type "Feature"
- stac_version "1.0.0"
- id "S1A_IW_GRDH_1SDV_20210121T120542_20210121T120607_036236_044009_rtc"
properties
- datetime "2021-01-21T12:05:54.958063Z"
- platform "SENTINEL-1A"
s1:shape [] 2 items
- 0 28427
- 1 21971
proj:bbox [] 4 items
- 0 618220.0
- 1 2960440.0
- 2 902490.0
- 3 3180150.0
- proj:epsg 32645
proj:shape [] 2 items
- 0 21971
- 1 28427
- end_datetime "2021-01-21 12:06:07.457235+00:00"
- constellation "Sentinel-1"
- s1:resolution "high"
proj:transform [] 9 items
- 0 10.0
- 1 0.0
- 2 618220.0
- 3 0.0
- 4 -10.0
- 5 3180150.0
- 6 0.0
- 7 0.0
- 8 1.0
- s1:datatake_id "278537"
- start_datetime "2021-01-21 12:05:42.458891+00:00"
- s1:orbit_source "RESORB"
- s1:slice_number "6"
- s1:total_slices "21"
- sar:looks_range 5
- sat:orbit_state "ascending"
- sar:product_type "GRD"
- sar:looks_azimuth 1
sar:polarizations [] 2 items
- 0 "VV"
- 1 "VH"
- sar:frequency_band "C"
- sat:absolute_orbit 36236
- sat:relative_orbit 114
- s1:processing_level "1"
- sar:instrument_mode "IW"
- sar:center_frequency 5.405
- sar:resolution_range 20
- s1:product_timeliness "Fast-24h"
- sar:resolution_azimuth 22
- sar:pixel_spacing_range 10
- sar:observation_direction "right"
- sar:pixel_spacing_azimuth 10
- sar:looks_equivalent_number 4.4
- s1:instrument_configuration_ID "6"
- sat:platform_international_designator "2014-016A"
geometry
- type "Polygon"
coordinates [] 1 items
0 [] 14 items
0 [] 2 items
- 0 89.9829489
- 1 27.0125776
1 [] 2 items
- 0 90.9939394
- 1 27.1728283
2 [] 2 items
- 0 90.7251581
- 1 28.6818171
3 [] 2 items
- 0 88.2179876
- 1 28.2796695
4 [] 2 items
- 0 88.3557808
- 1 27.7231898
5 [] 2 items
- 0 88.3301646
- 1 27.5846131
6 [] 2 items
- 0 88.3768978
- 1 27.5222365
7 [] 2 items
- 0 88.3585997
- 1 27.4089531
8 [] 2 items
- 0 88.4008748
- 1 27.3365029
9 [] 2 items
- 0 88.379529
- 1 27.3023238
10 [] 2 items
- 0 88.416308
- 1 27.2065443
11 [] 2 items
- 0 88.4046476
- 1 27.0895839
12 [] 2 items
- 0 88.4757328
- 1 26.7595085
13 [] 2 items
- 0 89.9829489
- 1 27.0125776
links [] 7 items
0
- rel "collection"
- href "https://planetarycomputer.microsoft.com/api/stac/v1/collections/sentinel-1-rtc"
- type "application/json"
1
- rel "parent"
- href "https://planetarycomputer.microsoft.com/api/stac/v1/collections/sentinel-1-rtc"
- type "application/json"
2
- rel "root"
- href "https://planetarycomputer.microsoft.com/api/stac/v1"
- type "application/json"
- title "Microsoft Planetary Computer STAC API"
3
- rel "self"
- href "https://planetarycomputer.microsoft.com/api/stac/v1/collections/sentinel-1-rtc/items/S1A_IW_GRDH_1SDV_20210121T120542_20210121T120607_036236_044009_rtc"
- type "application/geo+json"
4
- rel "license"
- href "https://sentinel.esa.int/documents/247904/690755/Sentinel_Data_Legal_Notice"
5
- rel "derived_from"
- href "https://planetarycomputer.microsoft.com/api/stac/v1/collections/sentinel-1-grd/items/S1A_IW_GRDH_1SDV_20210121T120542_20210121T120607_036236_044009"
- type "application/json"
- title "Sentinel 1 GRD Item"
6
- rel "preview"
- href "https://planetarycomputer.microsoft.com/api/data/v1/item/map?collection=sentinel-1-rtc&item=S1A_IW_GRDH_1SDV_20210121T120542_20210121T120607_036236_044009_rtc"
- type "text/html"
- title "Map of item"
assets
vh
- href "https://sentinel1euwestrtc.blob.core.windows.net/sentinel1-grd-rtc/GRD/2021/1/21/IW/DV/S1A_IW_GRDH_1SDV_20210121T120542_20210121T120607_036236_044009_0293/measurement/iw-vh.rtc.tiff"
- type "image/tiff; application=geotiff; profile=cloud-optimized"
- title "VH: vertical transmit, horizontal receive"
- description "Terrain-corrected gamma naught values of signal transmitted with vertical polarization and received with horizontal polarization with radiometric terrain correction applied."
- file:size 1853063864
- file:checksum "a3514f28bf368648c33dd64c5ce06a37"
raster:bands [] 1 items
0
- nodata -32768
- data_type "float32"
- spatial_resolution 10.0
roles [] 1 items
- 0 "data"
vv
- href "https://sentinel1euwestrtc.blob.core.windows.net/sentinel1-grd-rtc/GRD/2021/1/21/IW/DV/S1A_IW_GRDH_1SDV_20210121T120542_20210121T120607_036236_044009_0293/measurement/iw-vv.rtc.tiff"
- type "image/tiff; application=geotiff; profile=cloud-optimized"
- title "VV: vertical transmit, vertical receive"
- description "Terrain-corrected gamma naught values of signal transmitted with vertical polarization and received with vertical polarization with radiometric terrain correction applied."
- file:size 1859593009
- file:checksum "e89fbe72349604cfbee0422d8bd00370"
raster:bands [] 1 items
0
- nodata -32768
- data_type "float32"
- spatial_resolution 10.0
roles [] 1 items
- 0 "data"
tilejson
- href "https://planetarycomputer.microsoft.com/api/data/v1/item/tilejson.json?collection=sentinel-1-rtc&item=S1A_IW_GRDH_1SDV_20210121T120542_20210121T120607_036236_044009_rtc&assets=vv&assets=vh&tile_format=png&expression=0.03+%2B+log+%2810e-4+-+log+%280.05+%2F+%280.02+%2B+2+%2A+vv%29%29%29%3B0.05+%2B+exp+%280.25+%2A+%28log+%280.01+%2B+2+%2A+vv%29+%2B+log+%280.02+%2B+5+%2A+vh%29%29%29%3B1+-+log+%280.05+%2F+%280.045+-+0.9+%2A+vv%29%29&asset_as_band=True&rescale=0%2C.8000&rescale=0%2C1.000&rescale=0%2C1.000&format=png"
- type "application/json"
- title "TileJSON with default rendering"
roles [] 1 items
- 0 "tiles"
rendered_preview
- href "https://planetarycomputer.microsoft.com/api/data/v1/item/preview.png?collection=sentinel-1-rtc&item=S1A_IW_GRDH_1SDV_20210121T120542_20210121T120607_036236_044009_rtc&assets=vv&assets=vh&tile_format=png&expression=0.03+%2B+log+%2810e-4+-+log+%280.05+%2F+%280.02+%2B+2+%2A+vv%29%29%29%3B0.05+%2B+exp+%280.25+%2A+%28log+%280.01+%2B+2+%2A+vv%29+%2B+log+%280.02+%2B+5+%2A+vh%29%29%29%3B1+-+log+%280.05+%2F+%280.045+-+0.9+%2A+vv%29%29&asset_as_band=True&rescale=0%2C.8000&rescale=0%2C1.000&rescale=0%2C1.000&format=png"
- type "image/png"
- title "Rendered preview"
- rel "preview"
roles [] 1 items
- 0 "overview"
bbox [] 4 items
- 0 88.2179876
- 1 26.75950853
- 2 90.99393939
- 3 28.68181714
stac_extensions [] 6 items
- 0 "https://stac-extensions.github.io/sar/v1.0.0/schema.json"
- 1 "https://stac-extensions.github.io/sat/v1.0.0/schema.json"
- 2 "https://stac-extensions.github.io/eo/v1.0.0/schema.json"
- 3 "https://stac-extensions.github.io/projection/v1.0.0/schema.json"
- 4 "https://stac-extensions.github.io/file/v2.0.0/schema.json"
- 5 "https://stac-extensions.github.io/raster/v1.1.0/schema.json"
- collection "sentinel-1-rtc"
138
- type "Feature"
- stac_version "1.0.0"
- id "S1A_IW_GRDH_1SDV_20210117T000308_20210117T000333_036170_043DAD_rtc"
properties
- datetime "2021-01-17T00:03:21.123774Z"
- platform "SENTINEL-1A"
s1:shape [] 2 items
- 0 27537
- 1 21083
proj:bbox [] 4 items
- 0 524440.0
- 1 2980860.0
- 2 799810.0
- 3 3191690.0
- proj:epsg 32645
proj:shape [] 2 items
- 0 21083
- 1 27537
- end_datetime "2021-01-17 00:03:33.623271+00:00"
- constellation "Sentinel-1"
- s1:resolution "high"
proj:transform [] 9 items
- 0 10.0
- 1 0.0
- 2 524440.0
- 3 0.0
- 4 -10.0
- 5 3191690.0
- 6 0.0
- 7 0.0
- 8 1.0
- s1:datatake_id "277933"
- start_datetime "2021-01-17 00:03:08.624276+00:00"
- s1:orbit_source "RESORB"
- s1:slice_number "12"
- s1:total_slices "17"
- sar:looks_range 5
- sat:orbit_state "descending"
- sar:product_type "GRD"
- sar:looks_azimuth 1
sar:polarizations [] 2 items
- 0 "VV"
- 1 "VH"
- sar:frequency_band "C"
- sat:absolute_orbit 36170
- sat:relative_orbit 48
- s1:processing_level "1"
- sar:instrument_mode "IW"
- sar:center_frequency 5.405
- sar:resolution_range 20
- s1:product_timeliness "Fast-24h"
- sar:resolution_azimuth 22
- sar:pixel_spacing_range 10
- sar:observation_direction "right"
- sar:pixel_spacing_azimuth 10
- sar:looks_equivalent_number 4.4
- s1:instrument_configuration_ID "6"
- sat:platform_international_designator "2014-016A"
geometry
- type "Polygon"
coordinates [] 1 items
0 [] 19 items
0 [] 2 items
- 0 89.8049204
- 1 27.0229153
1 [] 2 items
- 0 89.7779354
- 1 26.9948048
2 [] 2 items
- 0 89.7846759
- 1 26.9228991
3 [] 2 items
- 0 87.3051819
- 1 27.3295617
4 [] 2 items
- 0 87.4260975
- 1 28.1938058
5 [] 2 items
- 0 87.5591485
- 1 28.8402926
6 [] 2 items
- 0 90.0500593
- 1 28.4418571
7 [] 2 items
- 0 90.0268463
- 1 28.2911579
8 [] 2 items
- 0 89.9736459
- 1 28.1918424
9 [] 2 items
- 0 89.9982898
- 1 28.1482781
10 [] 2 items
- 0 89.9714908
- 1 28.0843669
11 [] 2 items
- 0 89.9881221
- 1 28.0017399
12 [] 2 items
- 0 89.9452959
- 1 27.9516983
13 [] 2 items
- 0 89.9297848
- 1 27.8247467
14 [] 2 items
- 0 89.9530306
- 1 27.6786555
15 [] 2 items
- 0 89.9233863
- 1 27.6385097
16 [] 2 items
- 0 89.9031673
- 1 27.4283794
17 [] 2 items
- 0 89.8295985
- 1 27.2748098
18 [] 2 items
- 0 89.8049204
- 1 27.0229153
links [] 7 items
0
- rel "collection"
- href "https://planetarycomputer.microsoft.com/api/stac/v1/collections/sentinel-1-rtc"
- type "application/json"
1
- rel "parent"
- href "https://planetarycomputer.microsoft.com/api/stac/v1/collections/sentinel-1-rtc"
- type "application/json"
2
- rel "root"
- href "https://planetarycomputer.microsoft.com/api/stac/v1"
- type "application/json"
- title "Microsoft Planetary Computer STAC API"
3
- rel "self"
- href "https://planetarycomputer.microsoft.com/api/stac/v1/collections/sentinel-1-rtc/items/S1A_IW_GRDH_1SDV_20210117T000308_20210117T000333_036170_043DAD_rtc"
- type "application/geo+json"
4
- rel "license"
- href "https://sentinel.esa.int/documents/247904/690755/Sentinel_Data_Legal_Notice"
5
- rel "derived_from"
- href "https://planetarycomputer.microsoft.com/api/stac/v1/collections/sentinel-1-grd/items/S1A_IW_GRDH_1SDV_20210117T000308_20210117T000333_036170_043DAD"
- type "application/json"
- title "Sentinel 1 GRD Item"
6
- rel "preview"
- href "https://planetarycomputer.microsoft.com/api/data/v1/item/map?collection=sentinel-1-rtc&item=S1A_IW_GRDH_1SDV_20210117T000308_20210117T000333_036170_043DAD_rtc"
- type "text/html"
- title "Map of item"
assets
vh
- href "https://sentinel1euwestrtc.blob.core.windows.net/sentinel1-grd-rtc/GRD/2021/1/17/IW/DV/S1A_IW_GRDH_1SDV_20210117T000308_20210117T000333_036170_043DAD_1E9C/measurement/iw-vh.rtc.tiff"
- type "image/tiff; application=geotiff; profile=cloud-optimized"
- title "VH: vertical transmit, horizontal receive"
- description "Terrain-corrected gamma naught values of signal transmitted with vertical polarization and received with horizontal polarization with radiometric terrain correction applied."
- file:size 1841582787
- file:checksum "bd74f0f4a16dfc3b66832b7180c36b3e"
raster:bands [] 1 items
0
- nodata -32768
- data_type "float32"
- spatial_resolution 10.0
roles [] 1 items
- 0 "data"
vv
- href "https://sentinel1euwestrtc.blob.core.windows.net/sentinel1-grd-rtc/GRD/2021/1/17/IW/DV/S1A_IW_GRDH_1SDV_20210117T000308_20210117T000333_036170_043DAD_1E9C/measurement/iw-vv.rtc.tiff"
- type "image/tiff; application=geotiff; profile=cloud-optimized"
- title "VV: vertical transmit, vertical receive"
- description "Terrain-corrected gamma naught values of signal transmitted with vertical polarization and received with vertical polarization with radiometric terrain correction applied."
- file:size 1847287214
- file:checksum "75fdd4c00cff66d3063388f668fa5992"
raster:bands [] 1 items
0
- nodata -32768
- data_type "float32"
- spatial_resolution 10.0
roles [] 1 items
- 0 "data"
tilejson
- href "https://planetarycomputer.microsoft.com/api/data/v1/item/tilejson.json?collection=sentinel-1-rtc&item=S1A_IW_GRDH_1SDV_20210117T000308_20210117T000333_036170_043DAD_rtc&assets=vv&assets=vh&tile_format=png&expression=0.03+%2B+log+%2810e-4+-+log+%280.05+%2F+%280.02+%2B+2+%2A+vv%29%29%29%3B0.05+%2B+exp+%280.25+%2A+%28log+%280.01+%2B+2+%2A+vv%29+%2B+log+%280.02+%2B+5+%2A+vh%29%29%29%3B1+-+log+%280.05+%2F+%280.045+-+0.9+%2A+vv%29%29&asset_as_band=True&rescale=0%2C.8000&rescale=0%2C1.000&rescale=0%2C1.000&format=png"
- type "application/json"
- title "TileJSON with default rendering"
roles [] 1 items
- 0 "tiles"
rendered_preview
- href "https://planetarycomputer.microsoft.com/api/data/v1/item/preview.png?collection=sentinel-1-rtc&item=S1A_IW_GRDH_1SDV_20210117T000308_20210117T000333_036170_043DAD_rtc&assets=vv&assets=vh&tile_format=png&expression=0.03+%2B+log+%2810e-4+-+log+%280.05+%2F+%280.02+%2B+2+%2A+vv%29%29%29%3B0.05+%2B+exp+%280.25+%2A+%28log+%280.01+%2B+2+%2A+vv%29+%2B+log+%280.02+%2B+5+%2A+vh%29%29%29%3B1+-+log+%280.05+%2F+%280.045+-+0.9+%2A+vv%29%29&asset_as_band=True&rescale=0%2C.8000&rescale=0%2C1.000&rescale=0%2C1.000&format=png"
- type "image/png"
- title "Rendered preview"
- rel "preview"
roles [] 1 items
- 0 "overview"
bbox [] 4 items
- 0 87.30518194
- 1 26.92289908
- 2 90.05005933
- 3 28.84029259
stac_extensions [] 6 items
- 0 "https://stac-extensions.github.io/sar/v1.0.0/schema.json"
- 1 "https://stac-extensions.github.io/sat/v1.0.0/schema.json"
- 2 "https://stac-extensions.github.io/eo/v1.0.0/schema.json"
- 3 "https://stac-extensions.github.io/projection/v1.0.0/schema.json"
- 4 "https://stac-extensions.github.io/file/v2.0.0/schema.json"
- 5 "https://stac-extensions.github.io/raster/v1.1.0/schema.json"
- collection "sentinel-1-rtc"
139
- type "Feature"
- stac_version "1.0.0"
- id "S1A_IW_GRDH_1SDV_20210114T121350_20210114T121415_036134_043C7E_rtc"
properties
- datetime "2021-01-14T12:14:02.556282Z"
- platform "SENTINEL-1A"
s1:shape [] 2 items
- 0 28242
- 1 21600
proj:bbox [] 4 items
- 0 420930.0
- 1 2916200.0
- 2 703350.0
- 3 3132200.0
- proj:epsg 32645
proj:shape [] 2 items
- 0 21600
- 1 28242
- end_datetime "2021-01-14 12:14:15.056154+00:00"
- constellation "Sentinel-1"
- s1:resolution "high"
proj:transform [] 9 items
- 0 10.0
- 1 0.0
- 2 420930.0
- 3 0.0
- 4 -10.0
- 5 3132200.0
- 6 0.0
- 7 0.0
- 8 1.0
- s1:datatake_id "277630"
- start_datetime "2021-01-14 12:13:50.056410+00:00"
- s1:orbit_source "RESORB"
- s1:slice_number "6"
- s1:total_slices "20"
- sar:looks_range 5
- sat:orbit_state "ascending"
- sar:product_type "GRD"
- sar:looks_azimuth 1
sar:polarizations [] 2 items
- 0 "VV"
- 1 "VH"
- sar:frequency_band "C"
- sat:absolute_orbit 36134
- sat:relative_orbit 12
- s1:processing_level "1"
- sar:instrument_mode "IW"
- sar:center_frequency 5.405
- sar:resolution_range 20
- s1:product_timeliness "Fast-24h"
- sar:resolution_azimuth 22
- sar:pixel_spacing_range 10
- sar:observation_direction "right"
- sar:pixel_spacing_azimuth 10
- sar:looks_equivalent_number 4.4
- s1:instrument_configuration_ID "6"
- sat:platform_international_designator "2014-016A"
geometry
- type "Polygon"
coordinates [] 1 items
0 [] 16 items
0 [] 2 items
- 0 87.8647336
- 1 26.5975285
1 [] 2 items
- 0 86.4989773
- 1 26.3664143
2 [] 2 items
- 0 86.355233
- 1 27.1612098
3 [] 2 items
- 0 86.3185728
- 1 27.2312742
4 [] 2 items
- 0 86.3268807
- 1 27.3776556
5 [] 2 items
- 0 86.277472
- 1 27.464435
6 [] 2 items
- 0 86.2707714
- 1 27.6973979
7 [] 2 items
- 0 86.2161922
- 1 27.756318
8 [] 2 items
- 0 86.2345856
- 1 27.7815165
9 [] 2 items
- 0 86.2100152
- 1 27.782642
10 [] 2 items
- 0 86.203863
- 1 27.8468793
11 [] 2 items
- 0 86.2109743
- 1 27.8816289
12 [] 2 items
- 0 88.73815
- 1 28.2894276
13 [] 2 items
- 0 88.9224423
- 1 27.3278615
14 [] 2 items
- 0 88.9846672
- 1 26.7768071
15 [] 2 items
- 0 87.8647336
- 1 26.5975285
links [] 7 items
0
- rel "collection"
- href "https://planetarycomputer.microsoft.com/api/stac/v1/collections/sentinel-1-rtc"
- type "application/json"
1
- rel "parent"
- href "https://planetarycomputer.microsoft.com/api/stac/v1/collections/sentinel-1-rtc"
- type "application/json"
2
- rel "root"
- href "https://planetarycomputer.microsoft.com/api/stac/v1"
- type "application/json"
- title "Microsoft Planetary Computer STAC API"
3
- rel "self"
- href "https://planetarycomputer.microsoft.com/api/stac/v1/collections/sentinel-1-rtc/items/S1A_IW_GRDH_1SDV_20210114T121350_20210114T121415_036134_043C7E_rtc"
- type "application/geo+json"
4
- rel "license"
- href "https://sentinel.esa.int/documents/247904/690755/Sentinel_Data_Legal_Notice"
5
- rel "derived_from"
- href "https://planetarycomputer.microsoft.com/api/stac/v1/collections/sentinel-1-grd/items/S1A_IW_GRDH_1SDV_20210114T121350_20210114T121415_036134_043C7E"
- type "application/json"
- title "Sentinel 1 GRD Item"
6
- rel "preview"
- href "https://planetarycomputer.microsoft.com/api/data/v1/item/map?collection=sentinel-1-rtc&item=S1A_IW_GRDH_1SDV_20210114T121350_20210114T121415_036134_043C7E_rtc"
- type "text/html"
- title "Map of item"
assets
vh
- href "https://sentinel1euwestrtc.blob.core.windows.net/sentinel1-grd-rtc/GRD/2021/1/14/IW/DV/S1A_IW_GRDH_1SDV_20210114T121350_20210114T121415_036134_043C7E_4E4A/measurement/iw-vh.rtc.tiff"
- type "image/tiff; application=geotiff; profile=cloud-optimized"
- title "VH: vertical transmit, horizontal receive"
- description "Terrain-corrected gamma naught values of signal transmitted with vertical polarization and received with horizontal polarization with radiometric terrain correction applied."
- file:size 1873433928
- file:checksum "4c74052dac83dd5a992624cb09c6df0d"
raster:bands [] 1 items
0
- nodata -32768
- data_type "float32"
- spatial_resolution 10.0
roles [] 1 items
- 0 "data"
vv
- href "https://sentinel1euwestrtc.blob.core.windows.net/sentinel1-grd-rtc/GRD/2021/1/14/IW/DV/S1A_IW_GRDH_1SDV_20210114T121350_20210114T121415_036134_043C7E_4E4A/measurement/iw-vv.rtc.tiff"
- type "image/tiff; application=geotiff; profile=cloud-optimized"
- title "VV: vertical transmit, vertical receive"
- description "Terrain-corrected gamma naught values of signal transmitted with vertical polarization and received with vertical polarization with radiometric terrain correction applied."
- file:size 1880196912
- file:checksum "a0f375318ec89a0ea5bba3a6a9c1e5ba"
raster:bands [] 1 items
0
- nodata -32768
- data_type "float32"
- spatial_resolution 10.0
roles [] 1 items
- 0 "data"
tilejson
- href "https://planetarycomputer.microsoft.com/api/data/v1/item/tilejson.json?collection=sentinel-1-rtc&item=S1A_IW_GRDH_1SDV_20210114T121350_20210114T121415_036134_043C7E_rtc&assets=vv&assets=vh&tile_format=png&expression=0.03+%2B+log+%2810e-4+-+log+%280.05+%2F+%280.02+%2B+2+%2A+vv%29%29%29%3B0.05+%2B+exp+%280.25+%2A+%28log+%280.01+%2B+2+%2A+vv%29+%2B+log+%280.02+%2B+5+%2A+vh%29%29%29%3B1+-+log+%280.05+%2F+%280.045+-+0.9+%2A+vv%29%29&asset_as_band=True&rescale=0%2C.8000&rescale=0%2C1.000&rescale=0%2C1.000&format=png"
- type "application/json"
- title "TileJSON with default rendering"
roles [] 1 items
- 0 "tiles"
rendered_preview
- href "https://planetarycomputer.microsoft.com/api/data/v1/item/preview.png?collection=sentinel-1-rtc&item=S1A_IW_GRDH_1SDV_20210114T121350_20210114T121415_036134_043C7E_rtc&assets=vv&assets=vh&tile_format=png&expression=0.03+%2B+log+%2810e-4+-+log+%280.05+%2F+%280.02+%2B+2+%2A+vv%29%29%29%3B0.05+%2B+exp+%280.25+%2A+%28log+%280.01+%2B+2+%2A+vv%29+%2B+log+%280.02+%2B+5+%2A+vh%29%29%29%3B1+-+log+%280.05+%2F+%280.045+-+0.9+%2A+vv%29%29&asset_as_band=True&rescale=0%2C.8000&rescale=0%2C1.000&rescale=0%2C1.000&format=png"
- type "image/png"
- title "Rendered preview"
- rel "preview"
roles [] 1 items
- 0 "overview"
bbox [] 4 items
- 0 86.20386301
- 1 26.36641432
- 2 88.98466723
- 3 28.28942758
stac_extensions [] 6 items
- 0 "https://stac-extensions.github.io/sar/v1.0.0/schema.json"
- 1 "https://stac-extensions.github.io/sat/v1.0.0/schema.json"
- 2 "https://stac-extensions.github.io/eo/v1.0.0/schema.json"
- 3 "https://stac-extensions.github.io/projection/v1.0.0/schema.json"
- 4 "https://stac-extensions.github.io/file/v2.0.0/schema.json"
- 5 "https://stac-extensions.github.io/raster/v1.1.0/schema.json"
- collection "sentinel-1-rtc"
140
- type "Feature"
- stac_version "1.0.0"
- id "S1A_IW_GRDH_1SDV_20210109T120543_20210109T120608_036061_0439EE_rtc"
properties
- datetime "2021-01-09T12:05:55.523867Z"
- platform "SENTINEL-1A"
s1:shape [] 2 items
- 0 28428
- 1 21971
proj:bbox [] 4 items
- 0 618220.0
- 1 2960440.0
- 2 902500.0
- 3 3180150.0
- proj:epsg 32645
proj:shape [] 2 items
- 0 21971
- 1 28428
- end_datetime "2021-01-09 12:06:08.023063+00:00"
- constellation "Sentinel-1"
- s1:resolution "high"
proj:transform [] 9 items
- 0 10.0
- 1 0.0
- 2 618220.0
- 3 0.0
- 4 -10.0
- 5 3180150.0
- 6 0.0
- 7 0.0
- 8 1.0
- s1:datatake_id "276974"
- start_datetime "2021-01-09 12:05:43.024671+00:00"
- s1:orbit_source "RESORB"
- s1:slice_number "6"
- s1:total_slices "21"
- sar:looks_range 5
- sat:orbit_state "ascending"
- sar:product_type "GRD"
- sar:looks_azimuth 1
sar:polarizations [] 2 items
- 0 "VV"
- 1 "VH"
- sar:frequency_band "C"
- sat:absolute_orbit 36061
- sat:relative_orbit 114
- s1:processing_level "1"
- sar:instrument_mode "IW"
- sar:center_frequency 5.405
- sar:resolution_range 20
- s1:product_timeliness "Fast-24h"
- sar:resolution_azimuth 22
- sar:pixel_spacing_range 10
- sar:observation_direction "right"
- sar:pixel_spacing_azimuth 10
- sar:looks_equivalent_number 4.4
- s1:instrument_configuration_ID "6"
- sat:platform_international_designator "2014-016A"
geometry
- type "Polygon"
coordinates [] 1 items
0 [] 14 items
0 [] 2 items
- 0 89.9829489
- 1 27.0125776
1 [] 2 items
- 0 90.9939394
- 1 27.1728283
2 [] 2 items
- 0 90.7251581
- 1 28.6818171
3 [] 2 items
- 0 88.2179876
- 1 28.2796695
4 [] 2 items
- 0 88.3556794
- 1 27.7231908
5 [] 2 items
- 0 88.3301613
- 1 27.5843423
6 [] 2 items
- 0 88.3767976
- 1 27.5223278
7 [] 2 items
- 0 88.3584997
- 1 27.4090443
8 [] 2 items
- 0 88.4007771
- 1 27.3367747
9 [] 2 items
- 0 88.3794302
- 1 27.3025053
10 [] 2 items
- 0 88.4163057
- 1 27.2063637
11 [] 2 items
- 0 88.4045468
- 1 27.0895849
12 [] 2 items
- 0 88.4756323
- 1 26.7595096
13 [] 2 items
- 0 89.9829489
- 1 27.0125776
links [] 7 items
0
- rel "collection"
- href "https://planetarycomputer.microsoft.com/api/stac/v1/collections/sentinel-1-rtc"
- type "application/json"
1
- rel "parent"
- href "https://planetarycomputer.microsoft.com/api/stac/v1/collections/sentinel-1-rtc"
- type "application/json"
2
- rel "root"
- href "https://planetarycomputer.microsoft.com/api/stac/v1"
- type "application/json"
- title "Microsoft Planetary Computer STAC API"
3
- rel "self"
- href "https://planetarycomputer.microsoft.com/api/stac/v1/collections/sentinel-1-rtc/items/S1A_IW_GRDH_1SDV_20210109T120543_20210109T120608_036061_0439EE_rtc"
- type "application/geo+json"
4
- rel "license"
- href "https://sentinel.esa.int/documents/247904/690755/Sentinel_Data_Legal_Notice"
5
- rel "derived_from"
- href "https://planetarycomputer.microsoft.com/api/stac/v1/collections/sentinel-1-grd/items/S1A_IW_GRDH_1SDV_20210109T120543_20210109T120608_036061_0439EE"
- type "application/json"
- title "Sentinel 1 GRD Item"
6
- rel "preview"
- href "https://planetarycomputer.microsoft.com/api/data/v1/item/map?collection=sentinel-1-rtc&item=S1A_IW_GRDH_1SDV_20210109T120543_20210109T120608_036061_0439EE_rtc"
- type "text/html"
- title "Map of item"
assets
vh
- href "https://sentinel1euwestrtc.blob.core.windows.net/sentinel1-grd-rtc/GRD/2021/1/9/IW/DV/S1A_IW_GRDH_1SDV_20210109T120543_20210109T120608_036061_0439EE_8C80/measurement/iw-vh.rtc.tiff"
- type "image/tiff; application=geotiff; profile=cloud-optimized"
- title "VH: vertical transmit, horizontal receive"
- description "Terrain-corrected gamma naught values of signal transmitted with vertical polarization and received with horizontal polarization with radiometric terrain correction applied."
- file:size 1854512239
- file:checksum "0d4b042a710815abaa9e3dc3d20fe704"
raster:bands [] 1 items
0
- nodata -32768
- data_type "float32"
- spatial_resolution 10.0
roles [] 1 items
- 0 "data"
vv
- href "https://sentinel1euwestrtc.blob.core.windows.net/sentinel1-grd-rtc/GRD/2021/1/9/IW/DV/S1A_IW_GRDH_1SDV_20210109T120543_20210109T120608_036061_0439EE_8C80/measurement/iw-vv.rtc.tiff"
- type "image/tiff; application=geotiff; profile=cloud-optimized"
- title "VV: vertical transmit, vertical receive"
- description "Terrain-corrected gamma naught values of signal transmitted with vertical polarization and received with vertical polarization with radiometric terrain correction applied."
- file:size 1860784863
- file:checksum "75cc2269109b910806dbb3ac101fb752"
raster:bands [] 1 items
0
- nodata -32768
- data_type "float32"
- spatial_resolution 10.0
roles [] 1 items
- 0 "data"
tilejson
- href "https://planetarycomputer.microsoft.com/api/data/v1/item/tilejson.json?collection=sentinel-1-rtc&item=S1A_IW_GRDH_1SDV_20210109T120543_20210109T120608_036061_0439EE_rtc&assets=vv&assets=vh&tile_format=png&expression=0.03+%2B+log+%2810e-4+-+log+%280.05+%2F+%280.02+%2B+2+%2A+vv%29%29%29%3B0.05+%2B+exp+%280.25+%2A+%28log+%280.01+%2B+2+%2A+vv%29+%2B+log+%280.02+%2B+5+%2A+vh%29%29%29%3B1+-+log+%280.05+%2F+%280.045+-+0.9+%2A+vv%29%29&asset_as_band=True&rescale=0%2C.8000&rescale=0%2C1.000&rescale=0%2C1.000&format=png"
- type "application/json"
- title "TileJSON with default rendering"
roles [] 1 items
- 0 "tiles"
rendered_preview
- href "https://planetarycomputer.microsoft.com/api/data/v1/item/preview.png?collection=sentinel-1-rtc&item=S1A_IW_GRDH_1SDV_20210109T120543_20210109T120608_036061_0439EE_rtc&assets=vv&assets=vh&tile_format=png&expression=0.03+%2B+log+%2810e-4+-+log+%280.05+%2F+%280.02+%2B+2+%2A+vv%29%29%29%3B0.05+%2B+exp+%280.25+%2A+%28log+%280.01+%2B+2+%2A+vv%29+%2B+log+%280.02+%2B+5+%2A+vh%29%29%29%3B1+-+log+%280.05+%2F+%280.045+-+0.9+%2A+vv%29%29&asset_as_band=True&rescale=0%2C.8000&rescale=0%2C1.000&rescale=0%2C1.000&format=png"
- type "image/png"
- title "Rendered preview"
- rel "preview"
roles [] 1 items
- 0 "overview"
bbox [] 4 items
- 0 88.2179876
- 1 26.75950957
- 2 90.99393939
- 3 28.68181714
stac_extensions [] 6 items
- 0 "https://stac-extensions.github.io/sar/v1.0.0/schema.json"
- 1 "https://stac-extensions.github.io/sat/v1.0.0/schema.json"
- 2 "https://stac-extensions.github.io/eo/v1.0.0/schema.json"
- 3 "https://stac-extensions.github.io/projection/v1.0.0/schema.json"
- 4 "https://stac-extensions.github.io/file/v2.0.0/schema.json"
- 5 "https://stac-extensions.github.io/raster/v1.1.0/schema.json"
- collection "sentinel-1-rtc"
141
- type "Feature"
- stac_version "1.0.0"
- id "S1A_IW_GRDH_1SDV_20210105T000309_20210105T000334_035995_043787_rtc"
properties
- datetime "2021-01-05T00:03:21.634308Z"
- platform "SENTINEL-1A"
s1:shape [] 2 items
- 0 27535
- 1 21083
proj:bbox [] 4 items
- 0 524490.0
- 1 2980860.0
- 2 799840.0
- 3 3191690.0
- proj:epsg 32645
proj:shape [] 2 items
- 0 21083
- 1 27535
- end_datetime "2021-01-05 00:03:34.133805+00:00"
- constellation "Sentinel-1"
- s1:resolution "high"
proj:transform [] 9 items
- 0 10.0
- 1 0.0
- 2 524490.0
- 3 0.0
- 4 -10.0
- 5 3191690.0
- 6 0.0
- 7 0.0
- 8 1.0
- s1:datatake_id "276359"
- start_datetime "2021-01-05 00:03:09.134812+00:00"
- s1:orbit_source "RESORB"
- s1:slice_number "12"
- s1:total_slices "17"
- sar:looks_range 5
- sat:orbit_state "descending"
- sar:product_type "GRD"
- sar:looks_azimuth 1
sar:polarizations [] 2 items
- 0 "VV"
- 1 "VH"
- sar:frequency_band "C"
- sat:absolute_orbit 35995
- sat:relative_orbit 48
- s1:processing_level "1"
- sar:instrument_mode "IW"
- sar:center_frequency 5.405
- sar:resolution_range 20
- s1:product_timeliness "Fast-24h"
- sar:resolution_azimuth 22
- sar:pixel_spacing_range 10
- sar:observation_direction "right"
- sar:pixel_spacing_azimuth 10
- sar:looks_equivalent_number 4.4
- s1:instrument_configuration_ID "6"
- sat:platform_international_designator "2014-016A"
geometry
- type "Polygon"
coordinates [] 1 items
0 [] 16 items
0 [] 2 items
- 0 89.805614
- 1 27.0224503
1 [] 2 items
- 0 89.7785305
- 1 26.9944322
2 [] 2 items
- 0 89.7849777
- 1 26.9228931
3 [] 2 items
- 0 87.305586
- 1 27.3294705
4 [] 2 items
- 0 87.4265079
- 1 28.1945266
5 [] 2 items
- 0 87.5594561
- 1 28.8402913
6 [] 2 items
- 0 90.0502633
- 1 28.4418525
7 [] 2 items
- 0 89.9716916
- 1 28.0842723
8 [] 2 items
- 0 89.988506
- 1 28.0009197
9 [] 2 items
- 0 89.9456029
- 1 27.951782
10 [] 2 items
- 0 89.932019
- 1 27.8512204
11 [] 2 items
- 0 89.9533247
- 1 27.6782884
12 [] 2 items
- 0 89.9235864
- 1 27.6384153
13 [] 2 items
- 0 89.9036655
- 1 27.4280984
14 [] 2 items
- 0 89.8299976
- 1 27.2746213
15 [] 2 items
- 0 89.805614
- 1 27.0224503
links [] 7 items
0
- rel "collection"
- href "https://planetarycomputer.microsoft.com/api/stac/v1/collections/sentinel-1-rtc"
- type "application/json"
1
- rel "parent"
- href "https://planetarycomputer.microsoft.com/api/stac/v1/collections/sentinel-1-rtc"
- type "application/json"
2
- rel "root"
- href "https://planetarycomputer.microsoft.com/api/stac/v1"
- type "application/json"
- title "Microsoft Planetary Computer STAC API"
3
- rel "self"
- href "https://planetarycomputer.microsoft.com/api/stac/v1/collections/sentinel-1-rtc/items/S1A_IW_GRDH_1SDV_20210105T000309_20210105T000334_035995_043787_rtc"
- type "application/geo+json"
4
- rel "license"
- href "https://sentinel.esa.int/documents/247904/690755/Sentinel_Data_Legal_Notice"
5
- rel "derived_from"
- href "https://planetarycomputer.microsoft.com/api/stac/v1/collections/sentinel-1-grd/items/S1A_IW_GRDH_1SDV_20210105T000309_20210105T000334_035995_043787"
- type "application/json"
- title "Sentinel 1 GRD Item"
6
- rel "preview"
- href "https://planetarycomputer.microsoft.com/api/data/v1/item/map?collection=sentinel-1-rtc&item=S1A_IW_GRDH_1SDV_20210105T000309_20210105T000334_035995_043787_rtc"
- type "text/html"
- title "Map of item"
assets
vh
- href "https://sentinel1euwestrtc.blob.core.windows.net/sentinel1-grd-rtc/GRD/2021/1/5/IW/DV/S1A_IW_GRDH_1SDV_20210105T000309_20210105T000334_035995_043787_A787/measurement/iw-vh.rtc.tiff"
- type "image/tiff; application=geotiff; profile=cloud-optimized"
- title "VH: vertical transmit, horizontal receive"
- description "Terrain-corrected gamma naught values of signal transmitted with vertical polarization and received with horizontal polarization with radiometric terrain correction applied."
- file:size 1840810614
- file:checksum "6561f26dc6f7b814c6c684e04caf7b30"
raster:bands [] 1 items
0
- nodata -32768
- data_type "float32"
- spatial_resolution 10.0
roles [] 1 items
- 0 "data"
vv
- href "https://sentinel1euwestrtc.blob.core.windows.net/sentinel1-grd-rtc/GRD/2021/1/5/IW/DV/S1A_IW_GRDH_1SDV_20210105T000309_20210105T000334_035995_043787_A787/measurement/iw-vv.rtc.tiff"
- type "image/tiff; application=geotiff; profile=cloud-optimized"
- title "VV: vertical transmit, vertical receive"
- description "Terrain-corrected gamma naught values of signal transmitted with vertical polarization and received with vertical polarization with radiometric terrain correction applied."
- file:size 1846825213
- file:checksum "b8735c3650f43378b765259397be4583"
raster:bands [] 1 items
0
- nodata -32768
- data_type "float32"
- spatial_resolution 10.0
roles [] 1 items
- 0 "data"
tilejson
- href "https://planetarycomputer.microsoft.com/api/data/v1/item/tilejson.json?collection=sentinel-1-rtc&item=S1A_IW_GRDH_1SDV_20210105T000309_20210105T000334_035995_043787_rtc&assets=vv&assets=vh&tile_format=png&expression=0.03+%2B+log+%2810e-4+-+log+%280.05+%2F+%280.02+%2B+2+%2A+vv%29%29%29%3B0.05+%2B+exp+%280.25+%2A+%28log+%280.01+%2B+2+%2A+vv%29+%2B+log+%280.02+%2B+5+%2A+vh%29%29%29%3B1+-+log+%280.05+%2F+%280.045+-+0.9+%2A+vv%29%29&asset_as_band=True&rescale=0%2C.8000&rescale=0%2C1.000&rescale=0%2C1.000&format=png"
- type "application/json"
- title "TileJSON with default rendering"
roles [] 1 items
- 0 "tiles"
rendered_preview
- href "https://planetarycomputer.microsoft.com/api/data/v1/item/preview.png?collection=sentinel-1-rtc&item=S1A_IW_GRDH_1SDV_20210105T000309_20210105T000334_035995_043787_rtc&assets=vv&assets=vh&tile_format=png&expression=0.03+%2B+log+%2810e-4+-+log+%280.05+%2F+%280.02+%2B+2+%2A+vv%29%29%29%3B0.05+%2B+exp+%280.25+%2A+%28log+%280.01+%2B+2+%2A+vv%29+%2B+log+%280.02+%2B+5+%2A+vh%29%29%29%3B1+-+log+%280.05+%2F+%280.045+-+0.9+%2A+vv%29%29&asset_as_band=True&rescale=0%2C.8000&rescale=0%2C1.000&rescale=0%2C1.000&format=png"
- type "image/png"
- title "Rendered preview"
- rel "preview"
roles [] 1 items
- 0 "overview"
bbox [] 4 items
- 0 87.30558604
- 1 26.92289313
- 2 90.05026329
- 3 28.84029131
stac_extensions [] 6 items
- 0 "https://stac-extensions.github.io/sar/v1.0.0/schema.json"
- 1 "https://stac-extensions.github.io/sat/v1.0.0/schema.json"
- 2 "https://stac-extensions.github.io/eo/v1.0.0/schema.json"
- 3 "https://stac-extensions.github.io/projection/v1.0.0/schema.json"
- 4 "https://stac-extensions.github.io/file/v2.0.0/schema.json"
- 5 "https://stac-extensions.github.io/raster/v1.1.0/schema.json"
- collection "sentinel-1-rtc"
142
- type "Feature"
- stac_version "1.0.0"
- id "S1A_IW_GRDH_1SDV_20210102T121350_20210102T121415_035959_043653_rtc"
properties
- datetime "2021-01-02T12:14:03.114206Z"
- platform "SENTINEL-1A"
s1:shape [] 2 items
- 0 28174
- 1 21599
proj:bbox [] 4 items
- 0 421570.0
- 1 2916210.0
- 2 703310.0
- 3 3132200.0
- proj:epsg 32645
proj:shape [] 2 items
- 0 21599
- 1 28174
- end_datetime "2021-01-02 12:14:15.613351+00:00"
- constellation "Sentinel-1"
- s1:resolution "high"
proj:transform [] 9 items
- 0 10.0
- 1 0.0
- 2 421570.0
- 3 0.0
- 4 -10.0
- 5 3132200.0
- 6 0.0
- 7 0.0
- 8 1.0
- s1:datatake_id "276051"
- start_datetime "2021-01-02 12:13:50.615060+00:00"
- s1:orbit_source "RESORB"
- s1:slice_number "6"
- s1:total_slices "20"
- sar:looks_range 5
- sat:orbit_state "ascending"
- sar:product_type "GRD"
- sar:looks_azimuth 1
sar:polarizations [] 2 items
- 0 "VV"
- 1 "VH"
- sar:frequency_band "C"
- sat:absolute_orbit 35959
- sat:relative_orbit 12
- s1:processing_level "1"
- sar:instrument_mode "IW"
- sar:center_frequency 5.405
- sar:resolution_range 20
- s1:product_timeliness "Fast-24h"
- sar:resolution_azimuth 22
- sar:pixel_spacing_range 10
- sar:observation_direction "right"
- sar:pixel_spacing_azimuth 10
- sar:looks_equivalent_number 4.4
- s1:instrument_configuration_ID "6"
- sat:platform_international_designator "2014-016A"
geometry
- type "Polygon"
coordinates [] 1 items
0 [] 15 items
0 [] 2 items
- 0 86.2034598
- 1 27.8464707
1 [] 2 items
- 0 86.2103654
- 1 27.8815351
2 [] 2 items
- 0 88.7375369
- 1 28.2893451
3 [] 2 items
- 0 88.9221377
- 1 27.3277754
4 [] 2 items
- 0 88.9841646
- 1 26.7768141
5 [] 2 items
- 0 86.4985764
- 1 26.3664129
6 [] 2 items
- 0 86.3548293
- 1 27.161208
7 [] 2 items
- 0 86.3180645
- 1 27.2318134
8 [] 2 items
- 0 86.3264834
- 1 27.3764801
9 [] 2 items
- 0 86.2769677
- 1 27.4641615
10 [] 2 items
- 0 86.2702655
- 1 27.6972147
11 [] 2 items
- 0 86.2158904
- 1 27.7559552
12 [] 2 items
- 0 86.2342811
- 1 27.7815148
13 [] 2 items
- 0 86.2095103
- 1 27.782278
14 [] 2 items
- 0 86.2034598
- 1 27.8464707
links [] 7 items
0
- rel "collection"
- href "https://planetarycomputer.microsoft.com/api/stac/v1/collections/sentinel-1-rtc"
- type "application/json"
1
- rel "parent"
- href "https://planetarycomputer.microsoft.com/api/stac/v1/collections/sentinel-1-rtc"
- type "application/json"
2
- rel "root"
- href "https://planetarycomputer.microsoft.com/api/stac/v1"
- type "application/json"
- title "Microsoft Planetary Computer STAC API"
3
- rel "self"
- href "https://planetarycomputer.microsoft.com/api/stac/v1/collections/sentinel-1-rtc/items/S1A_IW_GRDH_1SDV_20210102T121350_20210102T121415_035959_043653_rtc"
- type "application/geo+json"
4
- rel "license"
- href "https://sentinel.esa.int/documents/247904/690755/Sentinel_Data_Legal_Notice"
5
- rel "derived_from"
- href "https://planetarycomputer.microsoft.com/api/stac/v1/collections/sentinel-1-grd/items/S1A_IW_GRDH_1SDV_20210102T121350_20210102T121415_035959_043653"
- type "application/json"
- title "Sentinel 1 GRD Item"
6
- rel "preview"
- href "https://planetarycomputer.microsoft.com/api/data/v1/item/map?collection=sentinel-1-rtc&item=S1A_IW_GRDH_1SDV_20210102T121350_20210102T121415_035959_043653_rtc"
- type "text/html"
- title "Map of item"
assets
vh
- href "https://sentinel1euwestrtc.blob.core.windows.net/sentinel1-grd-rtc/GRD/2021/1/2/IW/DV/S1A_IW_GRDH_1SDV_20210102T121350_20210102T121415_035959_043653_741C/measurement/iw-vh.rtc.tiff"
- type "image/tiff; application=geotiff; profile=cloud-optimized"
- title "VH: vertical transmit, horizontal receive"
- description "Terrain-corrected gamma naught values of signal transmitted with vertical polarization and received with horizontal polarization with radiometric terrain correction applied."
- file:size 1872053692
- file:checksum "a12d3e78f17a3e1cfc3b0b150f087911"
raster:bands [] 1 items
0
- nodata -32768
- data_type "float32"
- spatial_resolution 10.0
roles [] 1 items
- 0 "data"
vv
- href "https://sentinel1euwestrtc.blob.core.windows.net/sentinel1-grd-rtc/GRD/2021/1/2/IW/DV/S1A_IW_GRDH_1SDV_20210102T121350_20210102T121415_035959_043653_741C/measurement/iw-vv.rtc.tiff"
- type "image/tiff; application=geotiff; profile=cloud-optimized"
- title "VV: vertical transmit, vertical receive"
- description "Terrain-corrected gamma naught values of signal transmitted with vertical polarization and received with vertical polarization with radiometric terrain correction applied."
- file:size 1878845599
- file:checksum "387e82f795d6aa8f99a5e3bbadefaf0f"
raster:bands [] 1 items
0
- nodata -32768
- data_type "float32"
- spatial_resolution 10.0
roles [] 1 items
- 0 "data"
tilejson
- href "https://planetarycomputer.microsoft.com/api/data/v1/item/tilejson.json?collection=sentinel-1-rtc&item=S1A_IW_GRDH_1SDV_20210102T121350_20210102T121415_035959_043653_rtc&assets=vv&assets=vh&tile_format=png&expression=0.03+%2B+log+%2810e-4+-+log+%280.05+%2F+%280.02+%2B+2+%2A+vv%29%29%29%3B0.05+%2B+exp+%280.25+%2A+%28log+%280.01+%2B+2+%2A+vv%29+%2B+log+%280.02+%2B+5+%2A+vh%29%29%29%3B1+-+log+%280.05+%2F+%280.045+-+0.9+%2A+vv%29%29&asset_as_band=True&rescale=0%2C.8000&rescale=0%2C1.000&rescale=0%2C1.000&format=png"
- type "application/json"
- title "TileJSON with default rendering"
roles [] 1 items
- 0 "tiles"
rendered_preview
- href "https://planetarycomputer.microsoft.com/api/data/v1/item/preview.png?collection=sentinel-1-rtc&item=S1A_IW_GRDH_1SDV_20210102T121350_20210102T121415_035959_043653_rtc&assets=vv&assets=vh&tile_format=png&expression=0.03+%2B+log+%2810e-4+-+log+%280.05+%2F+%280.02+%2B+2+%2A+vv%29%29%29%3B0.05+%2B+exp+%280.25+%2A+%28log+%280.01+%2B+2+%2A+vv%29+%2B+log+%280.02+%2B+5+%2A+vh%29%29%29%3B1+-+log+%280.05+%2F+%280.045+-+0.9+%2A+vv%29%29&asset_as_band=True&rescale=0%2C.8000&rescale=0%2C1.000&rescale=0%2C1.000&format=png"
- type "image/png"
- title "Rendered preview"
- rel "preview"
roles [] 1 items
- 0 "overview"
bbox [] 4 items
- 0 86.20345977
- 1 26.36641292
- 2 88.98416457
- 3 28.28934514
stac_extensions [] 6 items
- 0 "https://stac-extensions.github.io/sar/v1.0.0/schema.json"
- 1 "https://stac-extensions.github.io/sat/v1.0.0/schema.json"
- 2 "https://stac-extensions.github.io/eo/v1.0.0/schema.json"
- 3 "https://stac-extensions.github.io/projection/v1.0.0/schema.json"
- 4 "https://stac-extensions.github.io/file/v2.0.0/schema.json"
- 5 "https://stac-extensions.github.io/raster/v1.1.0/schema.json"
- collection "sentinel-1-rtc"
To make it easier to work with, we can convert the items object to a dictionary, and from there, convert it to a geopandas.GeoDataFrame. You can see that the metadata from within each item of the ItemCollection object is present in the GeoDataFrame but its easier to scan and organize this way.
df = gpd.GeoDataFrame.from_features(items.to_dict(), crs='epsg:4326')
df.head(5)
| geometry | datetime | platform | s1:shape | proj:bbox | proj:epsg | proj:shape | end_datetime | constellation | s1:resolution | ... | sar:center_frequency | sar:resolution_range | s1:product_timeliness | sar:resolution_azimuth | sar:pixel_spacing_range | sar:observation_direction | sar:pixel_spacing_azimuth | sar:looks_equivalent_number | s1:instrument_configuration_ID | sat:platform_international_designator | |
|---|---|---|---|---|---|---|---|---|---|---|---|---|---|---|---|---|---|---|---|---|---|
| 0 | POLYGON ((86.20612 27.84414, 86.21011 27.78327... | 2022-08-01T12:14:14.610123Z | SENTINEL-1A | [28151, 21598] | [421830.0, 2916240.0, 703340.0, 3132220.0] | 32645 | [21598, 28151] | 2022-08-01 12:14:27.109058+00:00 | Sentinel-1 | high | ... | 5.405 | 20 | Fast-24h | 22 | 10 | right | 10 | 4.4 | 7 | 2014-016A |
| 1 | POLYGON ((89.98012 27.01219, 90.99394 27.17292... | 2022-07-27T12:06:06.953202Z | SENTINEL-1A | [28423, 21970] | [618250.0, 2960450.0, 902480.0, 3180150.0] | 32645 | [21970, 28423] | 2022-07-27 12:06:19.452211+00:00 | Sentinel-1 | high | ... | 5.405 | 20 | Fast-24h | 22 | 10 | right | 10 | 4.4 | 7 | 2014-016A |
| 2 | POLYGON ((89.80442 27.02311, 89.82929 27.27473... | 2022-07-23T00:03:32.650978Z | SENTINEL-1A | [27531, 21084] | [524490.0, 2980820.0, 799800.0, 3191660.0] | 32645 | [21084, 27531] | 2022-07-23 00:03:45.150333+00:00 | Sentinel-1 | high | ... | 5.405 | 20 | Fast-24h | 22 | 10 | right | 10 | 4.4 | 7 | 2014-016A |
| 3 | POLYGON ((86.20591 27.84405, 86.21002 27.78237... | 2022-07-20T12:14:13.801000Z | SENTINEL-1A | [28149, 21598] | [421810.0, 2916230.0, 703300.0, 3132210.0] | 32645 | [21598, 28149] | 2022-07-20 12:14:26.299940+00:00 | Sentinel-1 | high | ... | 5.405 | 20 | Fast-24h | 22 | 10 | right | 10 | 4.4 | 7 | 2014-016A |
| 4 | POLYGON ((89.98022 27.01218, 90.99394 27.17283... | 2022-07-15T12:06:06.242032Z | SENTINEL-1A | [28422, 21971] | [618260.0, 2960440.0, 902480.0, 3180150.0] | 32645 | [21971, 28422] | 2022-07-15 12:06:18.741751+00:00 | Sentinel-1 | high | ... | 5.405 | 20 | Fast-24h | 22 | 10 | right | 10 | 4.4 | 7 | 2014-016A |
5 rows × 36 columns
df.columns
Index(['geometry', 'datetime', 'platform', 's1:shape', 'proj:bbox',
'proj:epsg', 'proj:shape', 'end_datetime', 'constellation',
's1:resolution', 'proj:transform', 's1:datatake_id', 'start_datetime',
's1:orbit_source', 's1:slice_number', 's1:total_slices',
'sar:looks_range', 'sat:orbit_state', 'sar:product_type',
'sar:looks_azimuth', 'sar:polarizations', 'sar:frequency_band',
'sat:absolute_orbit', 'sat:relative_orbit', 's1:processing_level',
'sar:instrument_mode', 'sar:center_frequency', 'sar:resolution_range',
's1:product_timeliness', 'sar:resolution_azimuth',
'sar:pixel_spacing_range', 'sar:observation_direction',
'sar:pixel_spacing_azimuth', 'sar:looks_equivalent_number',
's1:instrument_configuration_ID',
'sat:platform_international_designator'],
dtype='object')
Now we want to check out a rendered preview of an individual item from the ItemCollection object. We do this by calling the assets accessor, and supplying the HREF of the rendered preview key.
Image(url=items[0].assets["rendered_preview"].href)
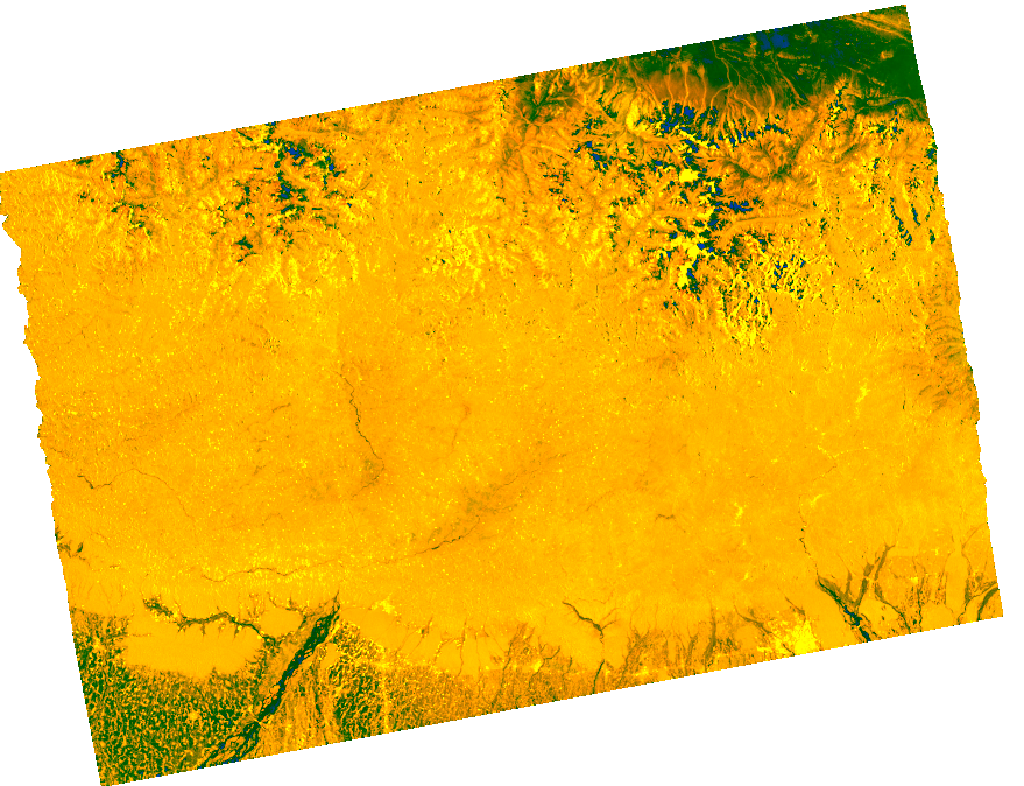
We can construct a table with metadata for a single scene (ie. a single element of the list items)
table = rich.table.Table('key','value')
for k,v in sorted(items[0].properties.items()):
table.add_row(k, str(v))
table
┏━━━━━━━━━━━━━━━━━━━━━━━━━━━━━━━━━━━━━━━┳━━━━━━━━━━━━━━━━━━━━━━━━━━━━━━━━━━━━━━━━━━━━━━━━━━━━━━━━━━━━━┓ ┃ key ┃ value ┃ ┡━━━━━━━━━━━━━━━━━━━━━━━━━━━━━━━━━━━━━━━╇━━━━━━━━━━━━━━━━━━━━━━━━━━━━━━━━━━━━━━━━━━━━━━━━━━━━━━━━━━━━━┩ │ constellation │ Sentinel-1 │ │ datetime │ 2022-08-01T12:14:14.610123Z │ │ end_datetime │ 2022-08-01 12:14:27.109058+00:00 │ │ platform │ SENTINEL-1A │ │ proj:bbox │ [421830.0, 2916240.0, 703340.0, 3132220.0] │ │ proj:epsg │ 32645 │ │ proj:shape │ [21598, 28151] │ │ proj:transform │ [10.0, 0.0, 421830.0, 0.0, -10.0, 3132220.0, 0.0, 0.0, 1.0] │ │ s1:datatake_id │ 346937 │ │ s1:instrument_configuration_ID │ 7 │ │ s1:orbit_source │ RESORB │ │ s1:processing_level │ 1 │ │ s1:product_timeliness │ Fast-24h │ │ s1:resolution │ high │ │ s1:shape │ [28151, 21598] │ │ s1:slice_number │ 6 │ │ s1:total_slices │ 20 │ │ sar:center_frequency │ 5.405 │ │ sar:frequency_band │ C │ │ sar:instrument_mode │ IW │ │ sar:looks_azimuth │ 1 │ │ sar:looks_equivalent_number │ 4.4 │ │ sar:looks_range │ 5 │ │ sar:observation_direction │ right │ │ sar:pixel_spacing_azimuth │ 10 │ │ sar:pixel_spacing_range │ 10 │ │ sar:polarizations │ ['VV', 'VH'] │ │ sar:product_type │ GRD │ │ sar:resolution_azimuth │ 22 │ │ sar:resolution_range │ 20 │ │ sat:absolute_orbit │ 44359 │ │ sat:orbit_state │ ascending │ │ sat:platform_international_designator │ 2014-016A │ │ sat:relative_orbit │ 12 │ │ start_datetime │ 2022-08-01 12:14:02.111187+00:00 │ └───────────────────────────────────────┴─────────────────────────────────────────────────────────────┘
We can also explore the object metadata outside of the table. Try typing .assets, .links, .STAC_extensions and .properties onto the term below.
You can query the object programmatically for the same metadata stored in the table using dictionary syntax on the properties accessor.
items[0]
#items[0].assets
#items[0].links
- type "Feature"
- stac_version "1.0.0"
- id "S1A_IW_GRDH_1SDV_20220801T121402_20220801T121427_044359_054B39_rtc"
properties
- datetime "2022-08-01T12:14:14.610123Z"
- platform "SENTINEL-1A"
s1:shape [] 2 items
- 0 28151
- 1 21598
proj:bbox [] 4 items
- 0 421830.0
- 1 2916240.0
- 2 703340.0
- 3 3132220.0
- proj:epsg 32645
proj:shape [] 2 items
- 0 21598
- 1 28151
- end_datetime "2022-08-01 12:14:27.109058+00:00"
- constellation "Sentinel-1"
- s1:resolution "high"
proj:transform [] 9 items
- 0 10.0
- 1 0.0
- 2 421830.0
- 3 0.0
- 4 -10.0
- 5 3132220.0
- 6 0.0
- 7 0.0
- 8 1.0
- s1:datatake_id "346937"
- start_datetime "2022-08-01 12:14:02.111187+00:00"
- s1:orbit_source "RESORB"
- s1:slice_number "6"
- s1:total_slices "20"
- sar:looks_range 5
- sat:orbit_state "ascending"
- sar:product_type "GRD"
- sar:looks_azimuth 1
sar:polarizations [] 2 items
- 0 "VV"
- 1 "VH"
- sar:frequency_band "C"
- sat:absolute_orbit 44359
- sat:relative_orbit 12
- s1:processing_level "1"
- sar:instrument_mode "IW"
- sar:center_frequency 5.405
- sar:resolution_range 20
- s1:product_timeliness "Fast-24h"
- sar:resolution_azimuth 22
- sar:pixel_spacing_range 10
- sar:observation_direction "right"
- sar:pixel_spacing_azimuth 10
- sar:looks_equivalent_number 4.4
- s1:instrument_configuration_ID "7"
- sat:platform_international_designator "2014-016A"
geometry
- type "Polygon"
coordinates [] 1 items
0 [] 15 items
0 [] 2 items
- 0 86.2061172
- 1 27.844139
1 [] 2 items
- 0 86.2101121
- 1 27.7832745
2 [] 2 items
- 0 86.2347885
- 1 27.7815176
3 [] 2 items
- 0 86.2165994
- 1 27.7561398
4 [] 2 items
- 0 86.2711759
- 1 27.6975806
5 [] 2 items
- 0 86.277775
- 1 27.4645268
6 [] 2 items
- 0 86.3275919
- 1 27.3771174
7 [] 2 items
- 0 86.3188758
- 1 27.2312756
8 [] 2 items
- 0 86.3555363
- 1 27.1611209
9 [] 2 items
- 0 86.4991766
- 1 26.3666859
10 [] 2 items
- 0 88.9846704
- 1 26.7769876
11 [] 2 items
- 0 88.9224408
- 1 27.3277712
12 [] 2 items
- 0 88.7383568
- 1 28.2896054
13 [] 2 items
- 0 86.2107705
- 1 27.881718
14 [] 2 items
- 0 86.2061172
- 1 27.844139
links [] 7 items
0
- rel "collection"
- href "https://planetarycomputer.microsoft.com/api/stac/v1/collections/sentinel-1-rtc"
- type "application/json"
1
- rel "parent"
- href "https://planetarycomputer.microsoft.com/api/stac/v1/collections/sentinel-1-rtc"
- type "application/json"
2
- rel "root"
- href "https://planetarycomputer.microsoft.com/api/stac/v1"
- type "application/json"
- title "Microsoft Planetary Computer STAC API"
3
- rel "self"
- href "https://planetarycomputer.microsoft.com/api/stac/v1/collections/sentinel-1-rtc/items/S1A_IW_GRDH_1SDV_20220801T121402_20220801T121427_044359_054B39_rtc"
- type "application/geo+json"
4
- rel "license"
- href "https://sentinel.esa.int/documents/247904/690755/Sentinel_Data_Legal_Notice"
5
- rel "derived_from"
- href "https://planetarycomputer.microsoft.com/api/stac/v1/collections/sentinel-1-grd/items/S1A_IW_GRDH_1SDV_20220801T121402_20220801T121427_044359_054B39"
- type "application/json"
- title "Sentinel 1 GRD Item"
6
- rel "preview"
- href "https://planetarycomputer.microsoft.com/api/data/v1/item/map?collection=sentinel-1-rtc&item=S1A_IW_GRDH_1SDV_20220801T121402_20220801T121427_044359_054B39_rtc"
- type "text/html"
- title "Map of item"
assets
vh
- href "https://sentinel1euwestrtc.blob.core.windows.net/sentinel1-grd-rtc/GRD/2022/8/1/IW/DV/S1A_IW_GRDH_1SDV_20220801T121402_20220801T121427_044359_054B39_E902/measurement/iw-vh.rtc.tiff"
- type "image/tiff; application=geotiff; profile=cloud-optimized"
- title "VH: vertical transmit, horizontal receive"
- description "Terrain-corrected gamma naught values of signal transmitted with vertical polarization and received with horizontal polarization with radiometric terrain correction applied."
- file:size 1864400774
- file:checksum "60989fa489c1ebf4ea27de1d3c560450"
raster:bands [] 1 items
0
- nodata -32768
- data_type "float32"
- spatial_resolution 10.0
roles [] 1 items
- 0 "data"
vv
- href "https://sentinel1euwestrtc.blob.core.windows.net/sentinel1-grd-rtc/GRD/2022/8/1/IW/DV/S1A_IW_GRDH_1SDV_20220801T121402_20220801T121427_044359_054B39_E902/measurement/iw-vv.rtc.tiff"
- type "image/tiff; application=geotiff; profile=cloud-optimized"
- title "VV: vertical transmit, vertical receive"
- description "Terrain-corrected gamma naught values of signal transmitted with vertical polarization and received with vertical polarization with radiometric terrain correction applied."
- file:size 1874779451
- file:checksum "8f4244723d81c5cacb5045f13aba68c7"
raster:bands [] 1 items
0
- nodata -32768
- data_type "float32"
- spatial_resolution 10.0
roles [] 1 items
- 0 "data"
tilejson
- href "https://planetarycomputer.microsoft.com/api/data/v1/item/tilejson.json?collection=sentinel-1-rtc&item=S1A_IW_GRDH_1SDV_20220801T121402_20220801T121427_044359_054B39_rtc&assets=vv&assets=vh&tile_format=png&expression=0.03+%2B+log+%2810e-4+-+log+%280.05+%2F+%280.02+%2B+2+%2A+vv%29%29%29%3B0.05+%2B+exp+%280.25+%2A+%28log+%280.01+%2B+2+%2A+vv%29+%2B+log+%280.02+%2B+5+%2A+vh%29%29%29%3B1+-+log+%280.05+%2F+%280.045+-+0.9+%2A+vv%29%29&asset_as_band=True&rescale=0%2C.8000&rescale=0%2C1.000&rescale=0%2C1.000&format=png"
- type "application/json"
- title "TileJSON with default rendering"
roles [] 1 items
- 0 "tiles"
rendered_preview
- href "https://planetarycomputer.microsoft.com/api/data/v1/item/preview.png?collection=sentinel-1-rtc&item=S1A_IW_GRDH_1SDV_20220801T121402_20220801T121427_044359_054B39_rtc&assets=vv&assets=vh&tile_format=png&expression=0.03+%2B+log+%2810e-4+-+log+%280.05+%2F+%280.02+%2B+2+%2A+vv%29%29%29%3B0.05+%2B+exp+%280.25+%2A+%28log+%280.01+%2B+2+%2A+vv%29+%2B+log+%280.02+%2B+5+%2A+vh%29%29%29%3B1+-+log+%280.05+%2F+%280.045+-+0.9+%2A+vv%29%29&asset_as_band=True&rescale=0%2C.8000&rescale=0%2C1.000&rescale=0%2C1.000&format=png"
- type "image/png"
- title "Rendered preview"
- rel "preview"
roles [] 1 items
- 0 "overview"
bbox [] 4 items
- 0 86.20611723
- 1 26.36668589
- 2 88.98467037
- 3 28.28960544
stac_extensions [] 6 items
- 0 "https://stac-extensions.github.io/sar/v1.0.0/schema.json"
- 1 "https://stac-extensions.github.io/sat/v1.0.0/schema.json"
- 2 "https://stac-extensions.github.io/eo/v1.0.0/schema.json"
- 3 "https://stac-extensions.github.io/projection/v1.0.0/schema.json"
- 4 "https://stac-extensions.github.io/file/v2.0.0/schema.json"
- 5 "https://stac-extensions.github.io/raster/v1.1.0/schema.json"
- collection "sentinel-1-rtc"
items[0].properties
{'datetime': '2022-08-01T12:14:14.610123Z',
'platform': 'SENTINEL-1A',
's1:shape': [28151, 21598],
'proj:bbox': [421830.0, 2916240.0, 703340.0, 3132220.0],
'proj:epsg': 32645,
'proj:shape': [21598, 28151],
'end_datetime': '2022-08-01 12:14:27.109058+00:00',
'constellation': 'Sentinel-1',
's1:resolution': 'high',
'proj:transform': [10.0, 0.0, 421830.0, 0.0, -10.0, 3132220.0, 0.0, 0.0, 1.0],
's1:datatake_id': '346937',
'start_datetime': '2022-08-01 12:14:02.111187+00:00',
's1:orbit_source': 'RESORB',
's1:slice_number': '6',
's1:total_slices': '20',
'sar:looks_range': 5,
'sat:orbit_state': 'ascending',
'sar:product_type': 'GRD',
'sar:looks_azimuth': 1,
'sar:polarizations': ['VV', 'VH'],
'sar:frequency_band': 'C',
'sat:absolute_orbit': 44359,
'sat:relative_orbit': 12,
's1:processing_level': '1',
'sar:instrument_mode': 'IW',
'sar:center_frequency': 5.405,
'sar:resolution_range': 20,
's1:product_timeliness': 'Fast-24h',
'sar:resolution_azimuth': 22,
'sar:pixel_spacing_range': 10,
'sar:observation_direction': 'right',
'sar:pixel_spacing_azimuth': 10,
'sar:looks_equivalent_number': 4.4,
's1:instrument_configuration_ID': '7',
'sat:platform_international_designator': '2014-016A'}
Now that we’e explored the items that fit our query of the dataset and seen the metadata, let’s read the data in using xarray.
We will now use dask.distributed to manage our tasks. Confusingly, we will use the dask.distributed class Client to interact with the cluster.
Reading data using xarray#
from dask.distributed import Client
client = Client(processes=False)
print(client.dashboard_link)
http://192.168.86.35:8787/status
The client.dashboard_link points to a dask dashboard for the client we’ve just instantiated.
Now that we have queried the data that is available from Microsoft Planetary Computer and inspected the metadata using pystac, we will use stackstac to read the data into our notebook as an xarray object. Calling stackstac.stack() produces a lazy xarray.DataArray with dask integration out of a STAC collection object.
type(items)
pystac.item_collection.ItemCollection
In the code cell below, you can see that we pass the object items, a pystac.ItemCollection to the stackstac.stack() method. The wrapper planetary_computer.sign() uses Planetary Computer subscription key credentials to access the data. stackstac passes the metadata from the STAC collection into the xarray object as coordinates allowing you to further organize and manipulate the object to fit your purposes. stackstac can also read the data in according to parameters passed during the stack() call. In the code cell below we pass parameters for bounding box and coordinate reference system. To specify the resolution as something other than the resolution at which its stored, pass a resolution = argument.
import stackstac
import os
da = stackstac.stack(
planetary_computer.sign(items), bounds_latlon=bbox, epsg=32645
)
/home/emmamarshall/miniconda3/envs/s1rtc/lib/python3.10/site-packages/stackstac/prepare.py:408: UserWarning: The argument 'infer_datetime_format' is deprecated and will be removed in a future version. A strict version of it is now the default, see https://pandas.pydata.org/pdeps/0004-consistent-to-datetime-parsing.html. You can safely remove this argument.
times = pd.to_datetime(
da
<xarray.DataArray 'stackstac-01228b676fa509c76ad69808ca72985e' (time: 143,
band: 2,
y: 1188, x: 869)>
dask.array<fetch_raster_window, shape=(143, 2, 1188, 869), dtype=float64, chunksize=(1, 1, 1024, 869), chunktype=numpy.ndarray>
Coordinates: (12/39)
* time (time) datetime64[ns] 2021-01-02T1...
id (time) <U66 'S1A_IW_GRDH_1SDV_2021...
* band (band) <U2 'vh' 'vv'
* x (x) float64 6.194e+05 ... 6.281e+05
* y (y) float64 3.102e+06 ... 3.09e+06
sar:product_type <U3 'GRD'
... ...
sat:platform_international_designator <U9 '2014-016A'
s1:product_timeliness <U8 'Fast-24h'
title (band) <U41 'VH: vertical transmit...
raster:bands object {'nodata': -32768, 'data_ty...
description (band) <U173 'Terrain-corrected ga...
epsg int64 32645
Attributes:
spec: RasterSpec(epsg=32645, bounds=(619420.0, 3089780.0, 628110.0...
crs: epsg:32645
transform: | 10.00, 0.00, 619420.00|\n| 0.00,-10.00, 3101660.00|\n| 0.0...
resolution: 10.0Retrieve source granule ID#
It will be useful to have the granule ID for the original SAR acquisition and GRD file used to generate the RTC image. The following code demonstrates retrieving the source granule ID from the STAC metadata and adding it as a coordinate variable to the xarray object containing the RTC imagery.
stac_item = pystac.read_file('https://planetarycomputer.microsoft.com/api/stac/v1/collections/sentinel-1-rtc/items/S1A_IW_GRDH_1SDV_20210602T120544_20210602T120609_038161_0480FD_rtc')
def extract_source_granule_pc(rtc_id):
base_url = 'https://planetarycomputer.microsoft.com/api/stac/v1/collections/sentinel-1-rtc/items/'
full_url = base_url + str(rtc_id)
stac_item = pystac.read_file(full_url)
source_granule = stac_item.links[5].target[-62:]
return source_granule
granule_ls = [extract_source_granule_pc(da.isel(time=t).id.values) for t in range(len(da.time))]
def make_granule_coord_pc(granule_ls):
'''this fn takes a list of granule IDs, extracts acq date for each granule, organizes this as an array that can be assigned as a coord to an xr obj'''
acq_date = [pd.to_datetime(granule[17:25]) for granule in granule_ls]
granule_da = xr.DataArray(data = granule_ls,
dims = ['time'],
coords = {'time':acq_date},
attrs = {'description': 'source granule ID S1 GRD files used to process PC RTC images, extracted from STAC metadata'},
name='granule_id')
return granule_da
granule_coord = make_granule_coord_pc(granule_ls)
granule_coord
<xarray.DataArray 'granule_id' (time: 143)>
array(['S1A_IW_GRDH_1SDV_20210102T121350_20210102T121415_035959_043653',
'S1A_IW_GRDH_1SDV_20210105T000309_20210105T000334_035995_043787',
'S1A_IW_GRDH_1SDV_20210109T120543_20210109T120608_036061_0439EE',
'S1A_IW_GRDH_1SDV_20210114T121350_20210114T121415_036134_043C7E',
'S1A_IW_GRDH_1SDV_20210117T000308_20210117T000333_036170_043DAD',
'S1A_IW_GRDH_1SDV_20210121T120542_20210121T120607_036236_044009',
'S1A_IW_GRDH_1SDV_20210126T121349_20210126T121414_036309_04428F',
'S1A_IW_GRDH_1SDV_20210129T000308_20210129T000333_036345_0443C6',
'S1A_IW_GRDH_1SDV_20210202T120542_20210202T120607_036411_044618',
'S1A_IW_GRDH_1SDV_20210207T121349_20210207T121414_036484_04489D',
'S1A_IW_GRDH_1SDV_20210210T000307_20210210T000332_036520_0449D9',
'S1A_IW_GRDH_1SDV_20210214T120541_20210214T120606_036586_044C38',
'S1A_IW_GRDH_1SDV_20210219T121348_20210219T121413_036659_044EBC',
'S1A_IW_GRDH_1SDV_20210222T000307_20210222T000332_036695_044FF8',
'S1A_IW_GRDH_1SDV_20210226T120541_20210226T120606_036761_04524C',
'S1A_IW_GRDH_1SDV_20210303T121348_20210303T121413_036834_0454C9',
'S1A_IW_GRDH_1SDV_20210306T000307_20210306T000332_036870_045604',
'S1A_IW_GRDH_1SDV_20210310T120541_20210310T120606_036936_045868',
'S1A_IW_GRDH_1SDV_20210315T121348_20210315T121413_037009_045AE4',
'S1A_IW_GRDH_1SDV_20210318T000307_20210318T000332_037045_045C26',
...
'S1A_IW_GRDH_1SDV_20220516T120549_20220516T120614_043236_0529DD',
'S1A_IW_GRDH_1SDV_20220521T121357_20220521T121422_043309_052C00',
'S1A_IW_GRDH_1SDV_20220528T120550_20220528T120615_043411_052F0A',
'S1A_IW_GRDH_1SDV_20220602T121358_20220602T121423_043484_053126',
'S1A_IW_GRDH_1SDV_20220605T000317_20220605T000342_043520_05323C',
'S1A_IW_GRDH_1SDV_20220609T120551_20220609T120616_043586_053436',
'S1A_IW_GRDH_1SDV_20220614T121359_20220614T121424_043659_05365F',
'S1A_IW_GRDH_1SDV_20220617T000317_20220617T000342_043695_053770',
'S1A_IW_GRDH_1SDV_20220621T120552_20220621T120617_043761_053978',
'S1A_IW_GRDH_1SDV_20220626T121359_20220626T121424_043834_053BA2',
'S1A_IW_GRDH_1SDV_20220629T000318_20220629T000343_043870_053CB6',
'S1A_IW_GRDH_1SDV_20220703T120553_20220703T120618_043936_053EA7',
'S1A_IW_GRDH_1SDV_20220708T121400_20220708T121425_044009_0540D0',
'S1A_IW_GRDH_1SDV_20220711T000319_20220711T000344_044045_0541E4',
'S1A_IW_GRDH_1SDV_20220715T120553_20220715T120618_044111_0543E4',
'S1A_IW_GRDH_1SDV_20220720T121401_20220720T121426_044184_054615',
'S1A_IW_GRDH_1SDV_20220723T000320_20220723T000345_044220_05471E',
'S1A_IW_GRDH_1SDV_20220727T120554_20220727T120619_044286_05491D',
'S1A_IW_GRDH_1SDV_20220801T121402_20220801T121427_044359_054B39'],
dtype='<U62')
Coordinates:
* time (time) datetime64[ns] 2021-01-02 2021-01-05 ... 2022-08-01
Attributes:
description: source granule ID S1 GRD files used to process PC RTC image...The granule_coord object is a 1-dimensional xarray.DataArray containing the source granule IDs for the original GRD files. The values of the time coordinate align with the time coordinate of the data object pc, allowing us to use the xarray.combine_by_coords() function to merge the two into one object.
First, check the dates between the two coordinates are the same (they should be):
for element in range(len(list(da.time)))[:5]:
print(list(da.time.values)[element])
print(list(granule_coord.time.values)[element])
print('')
print(len(da.time))
print(len(granule_coord.time))
2021-01-02T12:14:03.114206000
2021-01-02T00:00:00.000000000
2021-01-05T00:03:21.634308000
2021-01-05T00:00:00.000000000
2021-01-09T12:05:55.523867000
2021-01-09T00:00:00.000000000
2021-01-14T12:14:02.556282000
2021-01-14T00:00:00.000000000
2021-01-17T00:03:21.123774000
2021-01-17T00:00:00.000000000
143
143
Now, assign granule id as a non-dimensional coordinate of the xarray dataset:
da.coords['granule_id'] = ('time',granule_coord.data)
#rename for when we store it to use in the comparison notebook
da_pc = da
da_pc
<xarray.DataArray 'stackstac-01228b676fa509c76ad69808ca72985e' (time: 143,
band: 2,
y: 1188, x: 869)>
dask.array<fetch_raster_window, shape=(143, 2, 1188, 869), dtype=float64, chunksize=(1, 1, 1024, 869), chunktype=numpy.ndarray>
Coordinates: (12/40)
* time (time) datetime64[ns] 2021-01-02T1...
id (time) <U66 'S1A_IW_GRDH_1SDV_2021...
* band (band) <U2 'vh' 'vv'
* x (x) float64 6.194e+05 ... 6.281e+05
* y (y) float64 3.102e+06 ... 3.09e+06
sar:product_type <U3 'GRD'
... ...
s1:product_timeliness <U8 'Fast-24h'
title (band) <U41 'VH: vertical transmit...
raster:bands object {'nodata': -32768, 'data_ty...
description (band) <U173 'Terrain-corrected ga...
epsg int64 32645
granule_id (time) <U62 'S1A_IW_GRDH_1SDV_2021...
Attributes:
spec: RasterSpec(epsg=32645, bounds=(619420.0, 3089780.0, 628110.0...
crs: epsg:32645
transform: | 10.00, 0.00, 619420.00|\n| 0.00,-10.00, 3101660.00|\n| 0.0...
resolution: 10.0Now we’ll store this object to use in a later notebook:
%store da_pc
Stored 'da_pc' (DataArray)
Great, now we have a data cube of Sentinel-1 RTC backscatter imagery with x,y and time dimensions. Take a look at the coordinates and you can see that there is much more information that we can use to query and filter the dataset.
Let’s do a little bit of looking around. We’ll define a function to convert the backscatter pixel values from power to dB scale but we won’t use it yet. This transformation applies a logarithmic scale to the data which makes visualization easier but we do not want to run any summary statistics on the dB data as it will be distorted.
def power_to_db(input_arr):
return (10*np.log10(np.abs(input_arr)))
What if we only wanted to look at imagery from the VV band?
da_vv = da.sel(band='vv')
We can do the same for VH:
da_vh = da.sel(band='vh')
Next, what if we wanted to look only at imagery taken during ascending or descending passes of the satellite? band is a dimensional coordinate, so we could use xarray’s .sel() method, but orbital direction is a non-dimensional coordinate so we need to approach it a bit differently:
da_asc = da.where(da['sat:orbit_state'] == 'ascending', drop=True)
da_desc = da.where(da['sat:orbit_state'] == 'descending', drop=True)
da_asc
<xarray.DataArray 'stackstac-01228b676fa509c76ad69808ca72985e' (time: 97,
band: 2,
y: 1188, x: 869)>
dask.array<where, shape=(97, 2, 1188, 869), dtype=float64, chunksize=(1, 1, 1024, 869), chunktype=numpy.ndarray>
Coordinates: (12/40)
* time (time) datetime64[ns] 2021-01-02T1...
id (time) <U66 'S1A_IW_GRDH_1SDV_2021...
* band (band) <U2 'vh' 'vv'
* x (x) float64 6.194e+05 ... 6.281e+05
* y (y) float64 3.102e+06 ... 3.09e+06
sar:product_type <U3 'GRD'
... ...
s1:product_timeliness <U8 'Fast-24h'
title (band) <U41 'VH: vertical transmit...
raster:bands object {'nodata': -32768, 'data_ty...
description (band) <U173 'Terrain-corrected ga...
epsg int64 32645
granule_id (time) <U62 'S1A_IW_GRDH_1SDV_2021...
Attributes:
spec: RasterSpec(epsg=32645, bounds=(619420.0, 3089780.0, 628110.0...
crs: epsg:32645
transform: | 10.00, 0.00, 619420.00|\n| 0.00,-10.00, 3101660.00|\n| 0.0...
resolution: 10.0You can see that there are 69 time steps from the Ascending orbital pass and that all of the same dimensions and coordinates still exist, so you can subset for just the VV data from the ascending passes, or other variables you may be interested in.
Let’s take a look at the two polarizations side-by-side. Below, we’ll plot the VV and VH polarizations from the same date next to each other:
import matplotlib.pyplot as plt
fig, axs = plt.subplots(ncols=2, figsize=(16,8))
power_to_db(da_asc.sel(band='vv').isel(time=10)).plot(cmap=plt.cm.Greys_r, ax=axs[0]);
power_to_db(da_asc.sel(band='vh').isel(time=10)).plot(cmap=plt.cm.Greys_r, ax=axs[1]);
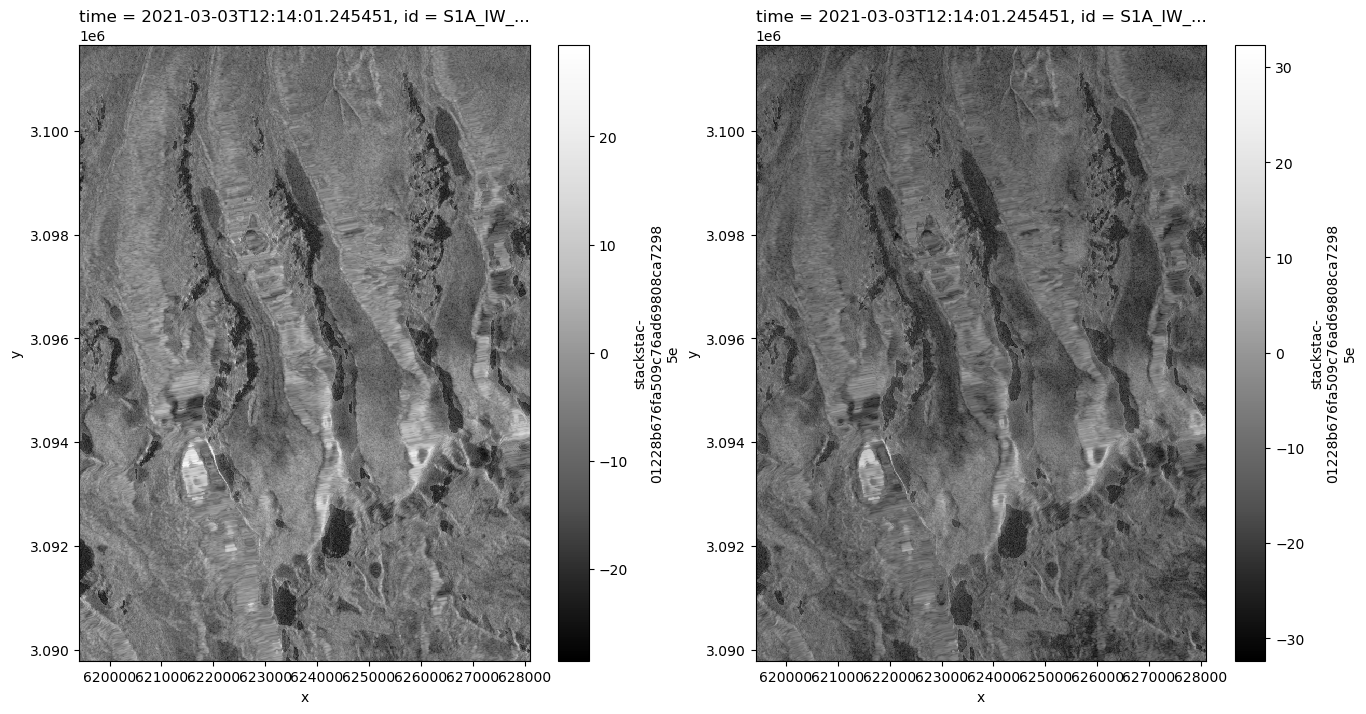
It looks like there is some interesting variability between the two images. What if we wanted to see how these differences persist over time?
Let’s perform a reduction along the x and y dimensions so that we can get a better idea of this data over time rather than a snapshot:
da_asc.sel(band='vv').mean(dim=['x','y'])
<xarray.DataArray 'stackstac-01228b676fa509c76ad69808ca72985e' (time: 97)>
dask.array<mean_agg-aggregate, shape=(97,), dtype=float64, chunksize=(1,), chunktype=numpy.ndarray>
Coordinates: (12/38)
* time (time) datetime64[ns] 2021-01-02T1...
id (time) <U66 'S1A_IW_GRDH_1SDV_2021...
band <U2 'vv'
sar:product_type <U3 'GRD'
sat:absolute_orbit (time) int64 35959 36061 ... 44359
sar:pixel_spacing_azimuth int64 10
... ...
s1:product_timeliness <U8 'Fast-24h'
title <U41 'VV: vertical transmit, verti...
raster:bands object {'nodata': -32768, 'data_ty...
description <U173 'Terrain-corrected gamma nau...
epsg int64 32645
granule_id (time) <U62 'S1A_IW_GRDH_1SDV_2021...fig, ax = plt.subplots(figsize=(12,9))
ax.set_title('Mean backscatter from ASCENDING passes for VH band (red) and VV band (blue) over time');
power_to_db(da_asc.sel(band='vv').mean(dim=['x','y'])).plot(ax=ax, linestyle='None', marker='o', color='red');
power_to_db(da_asc.sel(band='vh').mean(dim=['x','y'])).plot(ax=ax, linestyle='None', marker='o', color='blue');
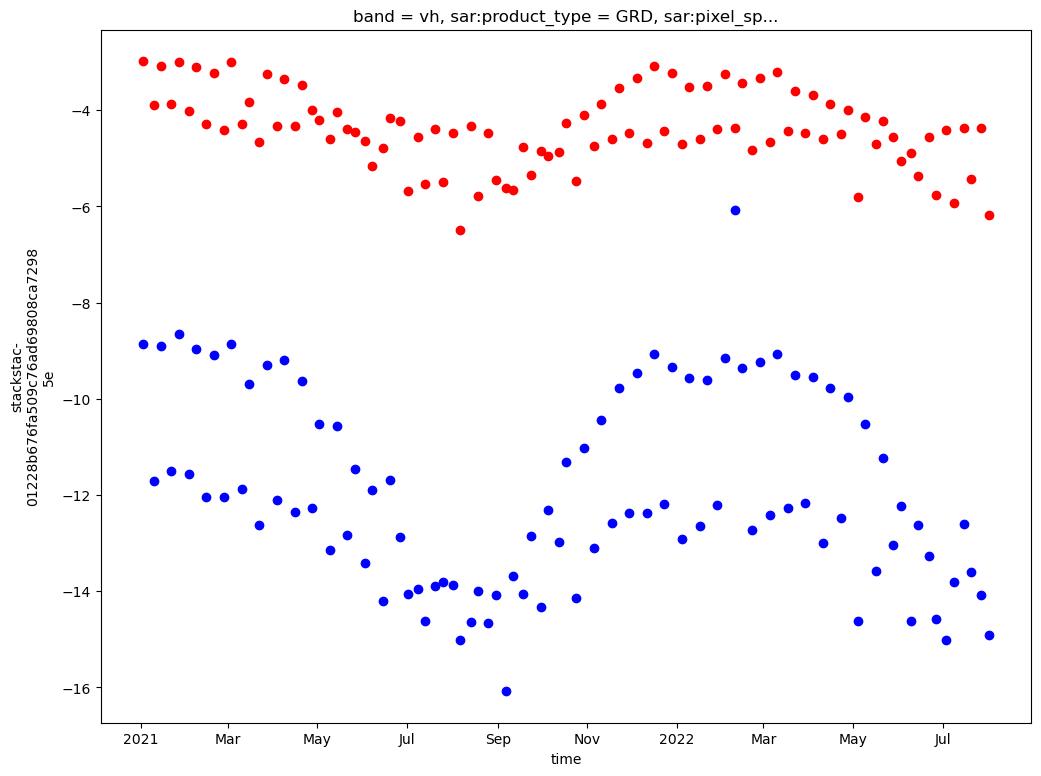
Interesting! It looks like there is more variability in the VH band than the VV band. Over the year, there is about 4 dB variability in the VV band but over twice as much in the VH band. Chapter 2 of the SAR handbook contains information about how polarization impacts radar returns. The above plots are looking only at the ascending passes. Let’s take a look at all of the time steps (ascending + descending). Any effects based on the different viewing geometries of the ascending and descending passes should have been removed during the radiometric terrain correction step.
fig, ax = plt.subplots(figsize=(12,9))
ax.set_title('Mean backscatter for VH band (red) and VV band (blue) over time');
power_to_db(da.sel(band='vv').mean(dim=['x','y'])).plot(ax=ax, linestyle='None', marker='o', color='red');
power_to_db(da.sel(band='vh').mean(dim=['x','y'])).plot(ax=ax, linestyle='None', marker='o', color='blue');
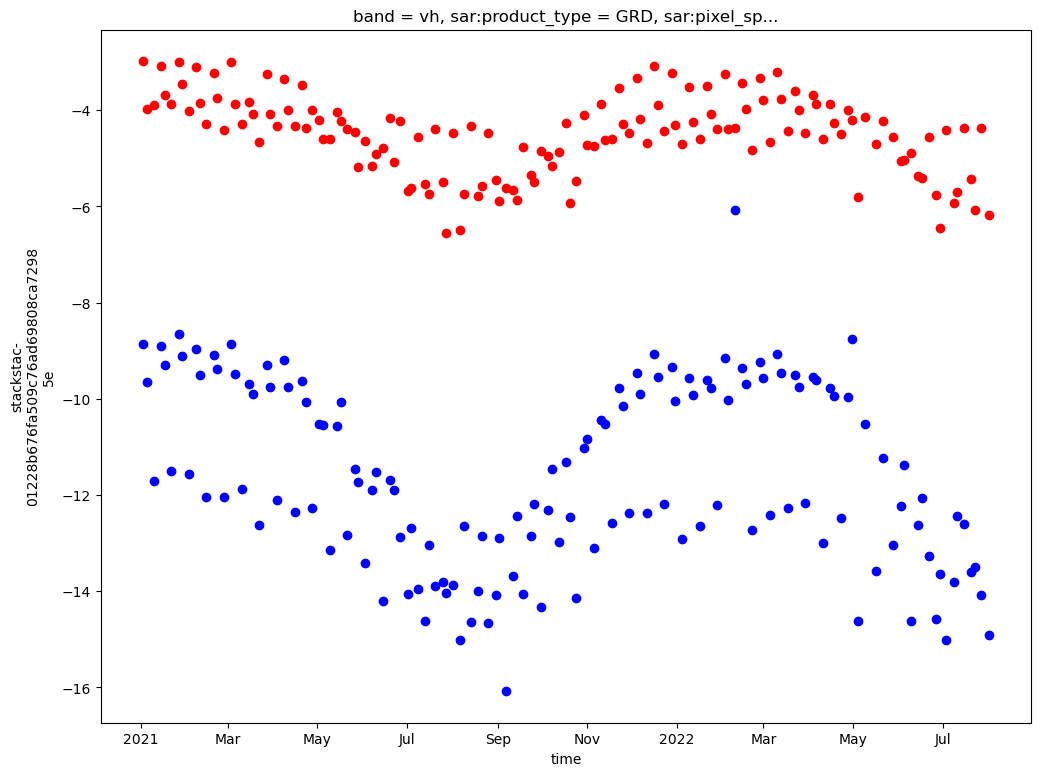
Next, let’s take a look at how backscatter values vary seasonally. To do this we will use xarray’s groupby() and .facetgrid methods.
seasons_gb = da_pc.groupby(da_pc.time.dt.season).mean()
#add the attrs back to the season groupby object
seasons_gb.attrs = da_pc.attrs
seasons_gb
<xarray.DataArray 'stackstac-01228b676fa509c76ad69808ca72985e' (season: 4,
band: 2,
y: 1188, x: 869)>
dask.array<transpose, shape=(4, 2, 1188, 869), dtype=float64, chunksize=(1, 1, 1024, 869), chunktype=numpy.ndarray>
Coordinates: (12/28)
* band (band) <U2 'vh' 'vv'
* x (x) float64 6.194e+05 ... 6.281e+05
* y (y) float64 3.102e+06 ... 3.09e+06
sar:product_type <U3 'GRD'
sar:pixel_spacing_azimuth int64 10
sar:polarizations object {'VH', 'VV'}
... ...
s1:product_timeliness <U8 'Fast-24h'
title (band) <U41 'VH: vertical transmit...
raster:bands object {'nodata': -32768, 'data_ty...
description (band) <U173 'Terrain-corrected ga...
epsg int64 32645
* season (season) object 'DJF' 'JJA' ... 'SON'
Attributes:
spec: RasterSpec(epsg=32645, bounds=(619420.0, 3089780.0, 628110.0...
crs: epsg:32645
transform: | 10.00, 0.00, 619420.00|\n| 0.00,-10.00, 3101660.00|\n| 0.0...
resolution: 10.0Use the seasons groupby object and specify the season dimension in the Facetgrid call to automatically plot mean backscatter for each season:
fg_vv = power_to_db(seasons_gb.sel(band='vv')).plot(col='season', cmap=plt.cm.Greys_r);
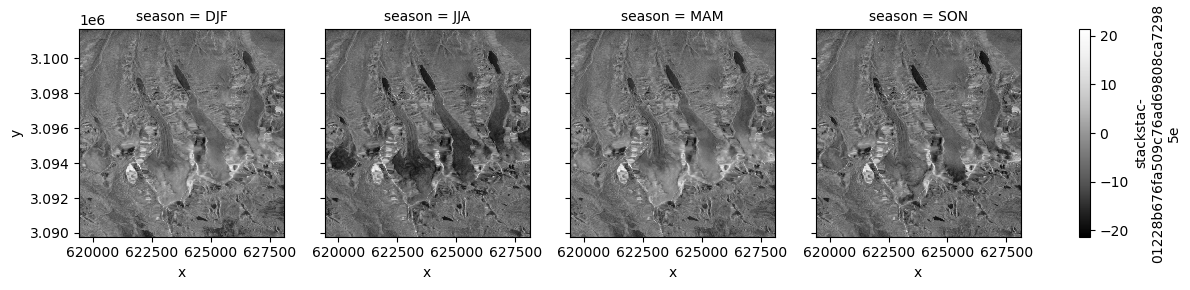
fg_vh = power_to_db(seasons_gb.sel(band='vh')).plot(col='season', cmap=plt.cm.Greys_r);
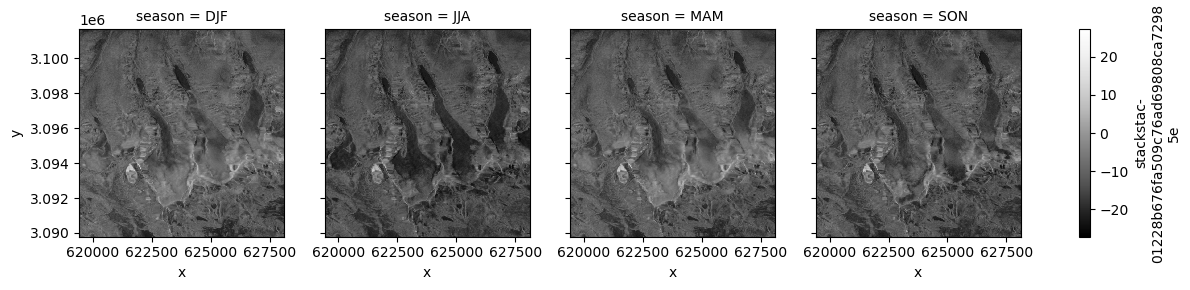
Wrap up#
This notebook demonstrated how to access cloud-hosted data from Microsoft Planetary Computer, some basic dataset organization and preliminary exploration and visualization. The following notebook will compare the Planetary Computer dataset to the ASF dataset.